Super Typhoon Jelawat has developed in the central Pacific Ocean, to the west of Guam and the Marianas Islands. The hourly imagery, above, from Himawari-8, from 2200 UTC on 29 March through 0800 UTC on 30 March show a rapid eye development. Satellite presentation seems best at around 0500 UTC, with... Read More
Himawari-8 “Red” Visible (0.64 µm) Imagery, hourly from 2200 UTC 29 March through 0800 UTC 30 March (Click to animate)
Super Typhoon Jelawat has developed in the central Pacific Ocean, to the west of Guam and the Marianas Islands. The hourly imagery, above, from Himawari-8, from 2200 UTC on 29 March through 0800 UTC on 30 March show a rapid eye development. Satellite presentation seems best at around 0500 UTC, with a well-defined eye. Subsequently, high clouds covered the eye as it became less symmetric.
Himarwari-8 AHI Band 13 (“Clean Window”, 10.41 µm) Infrared Imagery, 2300 UTC on 29 March 2018 through 0140 UTC on 30 March 2018 (Click to enlarge)
Infrared Imagery (10.41 µm) imagery, above, shows a well-defined eye shortly after 0000 UTC. Following a data outage, imagery from 1400 UTC to 1600 UTC, below, shows a central region of cold convective clouds, but no obvious eye.
Himarwari-8 AHI Band 13 (“Clean Window”, 10.41 µm) Infrared Imagery, 1420 UTC on 30 March 2018 through 1600 UTC on 30 March 2018 (Click to enlarge)
Water Vapor Infrared Imagery from Himawari, below, shows that outflow from Jelawat is well-established to the north; outflow appears to be entrained into the mid-latitude westerlies. MIMIC Total Precipitable Water for the 24 hours ending 1600 UTC on 30 March (shown underneath the water vapor infrared imagery below) also shows the entrainment of tropical moisture around Jelawat into mid-latitudes. The Total Precipitable Water shows a band of rich moisture extending to the east-southeast of Jelawat, portending a wet period for the Marianas Islands.
Himawari-8 AHI Water Vapor Imagery, Bands 8 (6.24 µm) and 10 (7.35 µm) at 1600 UTC on 30 March 2018 (Click to enlarge)
Morphed Microwave Observations of Total Precipitable Water, 1700 UTC on 29 March 2018 to 1600 UTC on 30 March 2018 (Click to enlarge)
Morphed Storm-centered Microwave Imagery for the 24 hours ending at 0900 UTC on 30 March, 2018 (from this site), show the rapid intensification after 0000 UTC on 30 March. (Update: a similar animation that ends at 1900 UTC on 30 March 2018 demonstrates a rapid collapse of the eyewall convection!)
Morphed Microwave Imagery for the 24 hours ending at ~0900 UTC on 30 March 2018 (Click to enlarge)
Full-resolution Visible Imagery from AHI (Band 3, 0.64) is shown below. (Faster and slower animations are available). A rapid organization and clearing of the eye is apparent around 0400 UTC with an equally-rapid apparent subsequent obscuration.
Full-Resolution Himawari-8 “Red” Visible (0.64 µm) Imagery, hourly from 0000 UTC 30 March through 0850 UTC 30 March (Click to animate)
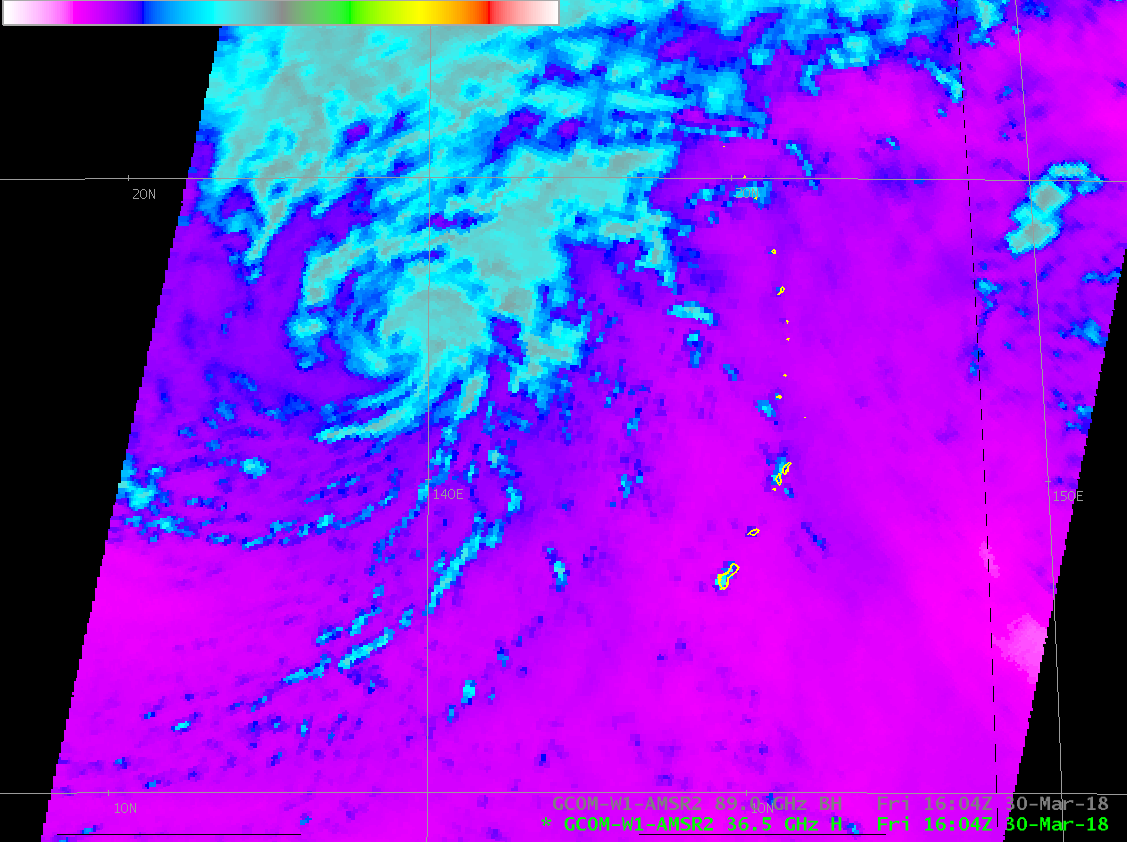
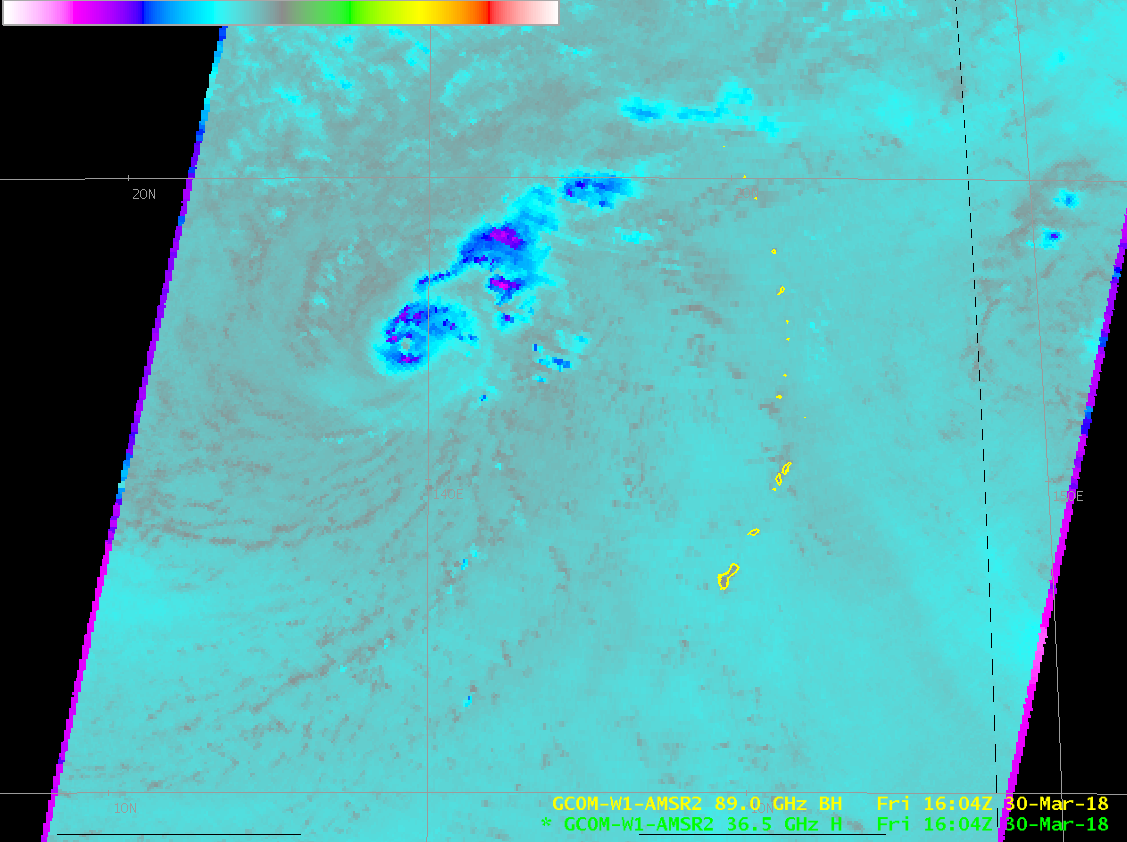
GCOM overflew the storm at around 1610 UTC on 30 March, and the toggle below shows the 36.5 and 89.0 Ghz imagery over the storm (the same enhancement is used in each image). The 36.5 Ghz imagery suggests a very asymmetric storm. Eyewall convection in the 89 Ghz imagery is not robust. (These data were downloaded at the Direct Broadcast antenna on Guam and are courtesy Kathy Strabala, SSEC/CIMSS)

GCOM AMSR-2 36.5 and 89.0 GHz imagery over Jelawat, 1604 UTC on 30 March 2018 (Click to enlarge)
NOAA-20 and Suomi NPP also both overflew Jelawat around 1600 UTC on 30 March. The toggles below show NOAA-20 and then Suomi NPP Day Night Band visible imagery. and Infrared 11.45 Imagery, at 1549 and 1639 UTC. (Imagery courtesy William Straka, SSEC/CIMSS) In contrast to the Visible and Infrared imagery from Himawari earlier in the day (at top), an eye is not present. (Note that NOAA-20 data are provisional, non-operational, and undergoing testing still.)
VIIRS Infrared Imagery (11.45 µm) from NOAA-20 (1549 UTC) and Suomi NPP (1639 UTC) on 30 March 2018 (Click to enlarge)
VIIRS Day Night Band Visible Imagery (0.70 µm) from NOAA-20 (1549 UTC) and Suomi NPP (1639 UTC) on 30 March 2018 (Click to enlarge)
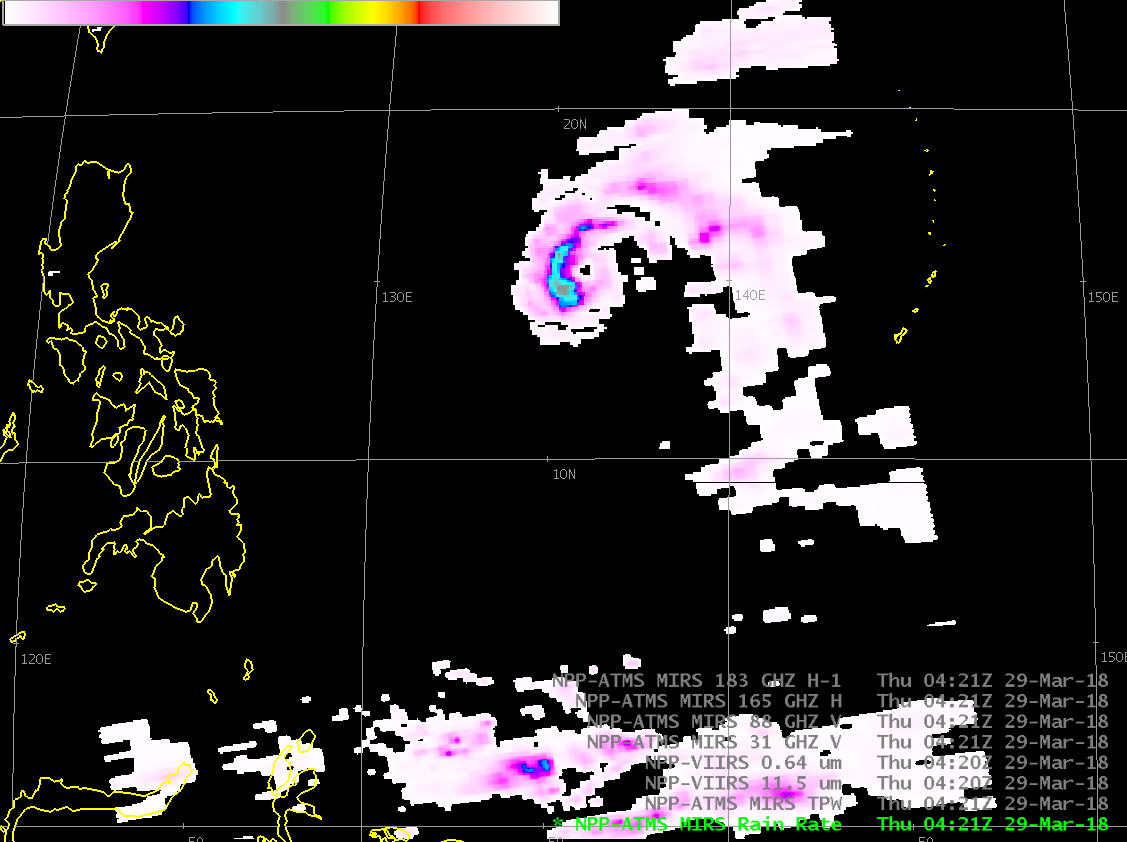
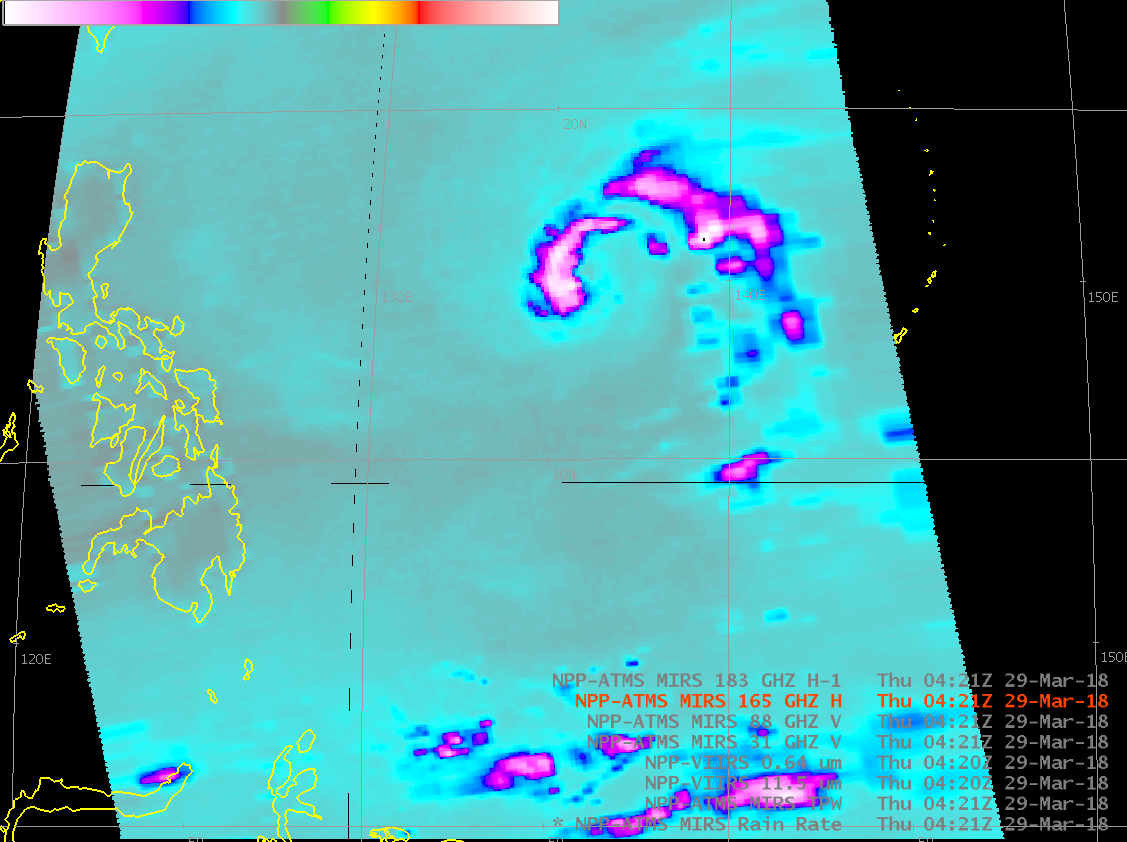
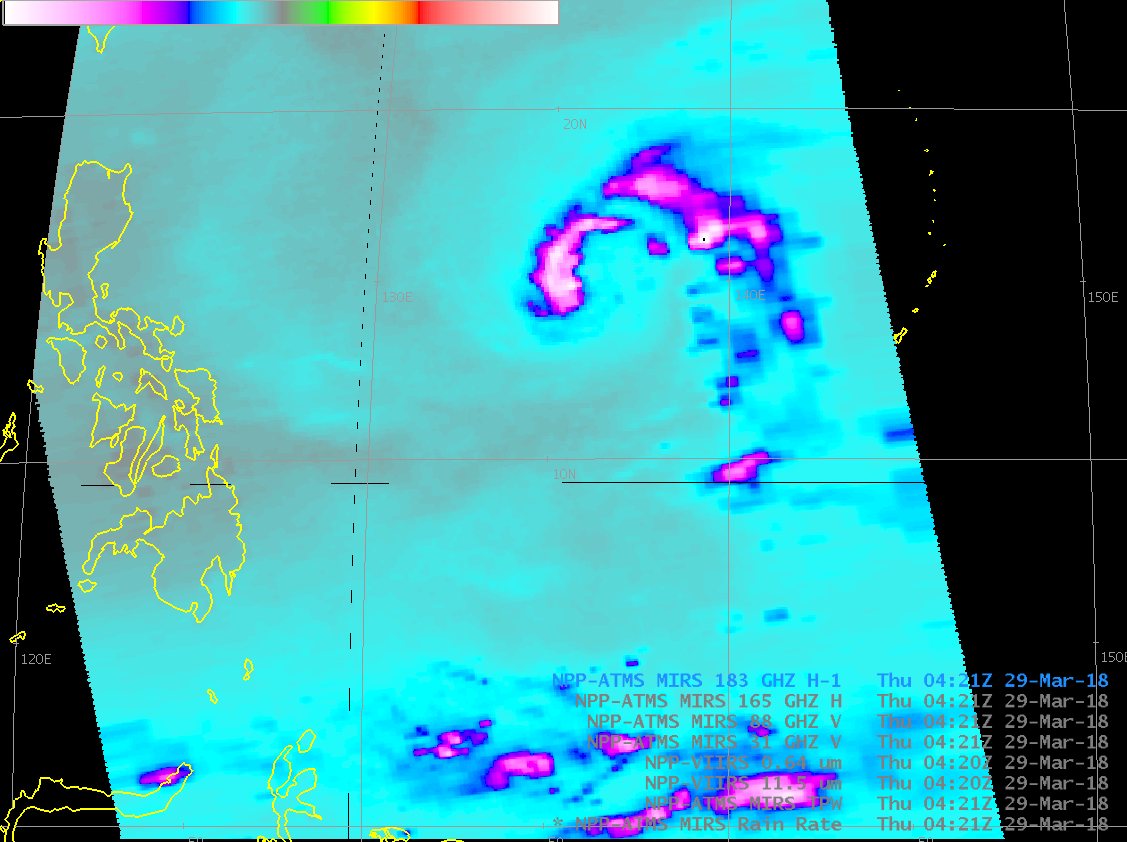
Suomi NPP also overflew the storm on 29 March 2018, at 0421 UTC. This was before Jelawat’s rapid intensification. The toggle below again uses data from the Direct Broadcast antenna on Guam and shows VIIRS visible (0.64 µm) and infrared (11.45 µm) imagery, MIRS products (Total Precipitable Water and Rain Rate) derived from data from the ATMS microwave sounder on Suomi NPP, and individual microwave channels from ATMS: 31, 88, 165 and 183 Ghz.
Suomi NPP VIIRS Visible (0.64 µm) and Infrared (11.45 µm) Imagery, MIRS Total Precipitable Water and Rain Rate, and individual Suomi NPP ATMS Channels: 31, 88, 165 and 183 GHz, all at 0421 UTC on 29 March 2018 (Click to enlarge)
Interests in the Marianas Islands should closely monitor the progress and evolution of this storm. This site and this site both have information on the system.
View only this post
Read Less


