5-minute CONUS Sector GOES-19 (GOES-East) Visible images with an overlay of GLM Flash Extent Density (FED) and contours of LightningCast Probability (above) showed two isolated thunderstorms which passed over the eastern portion of Lake Murray (located in central South Carolina, just northwest of Columbia KCAE) during the late afternoon hours on... Read More

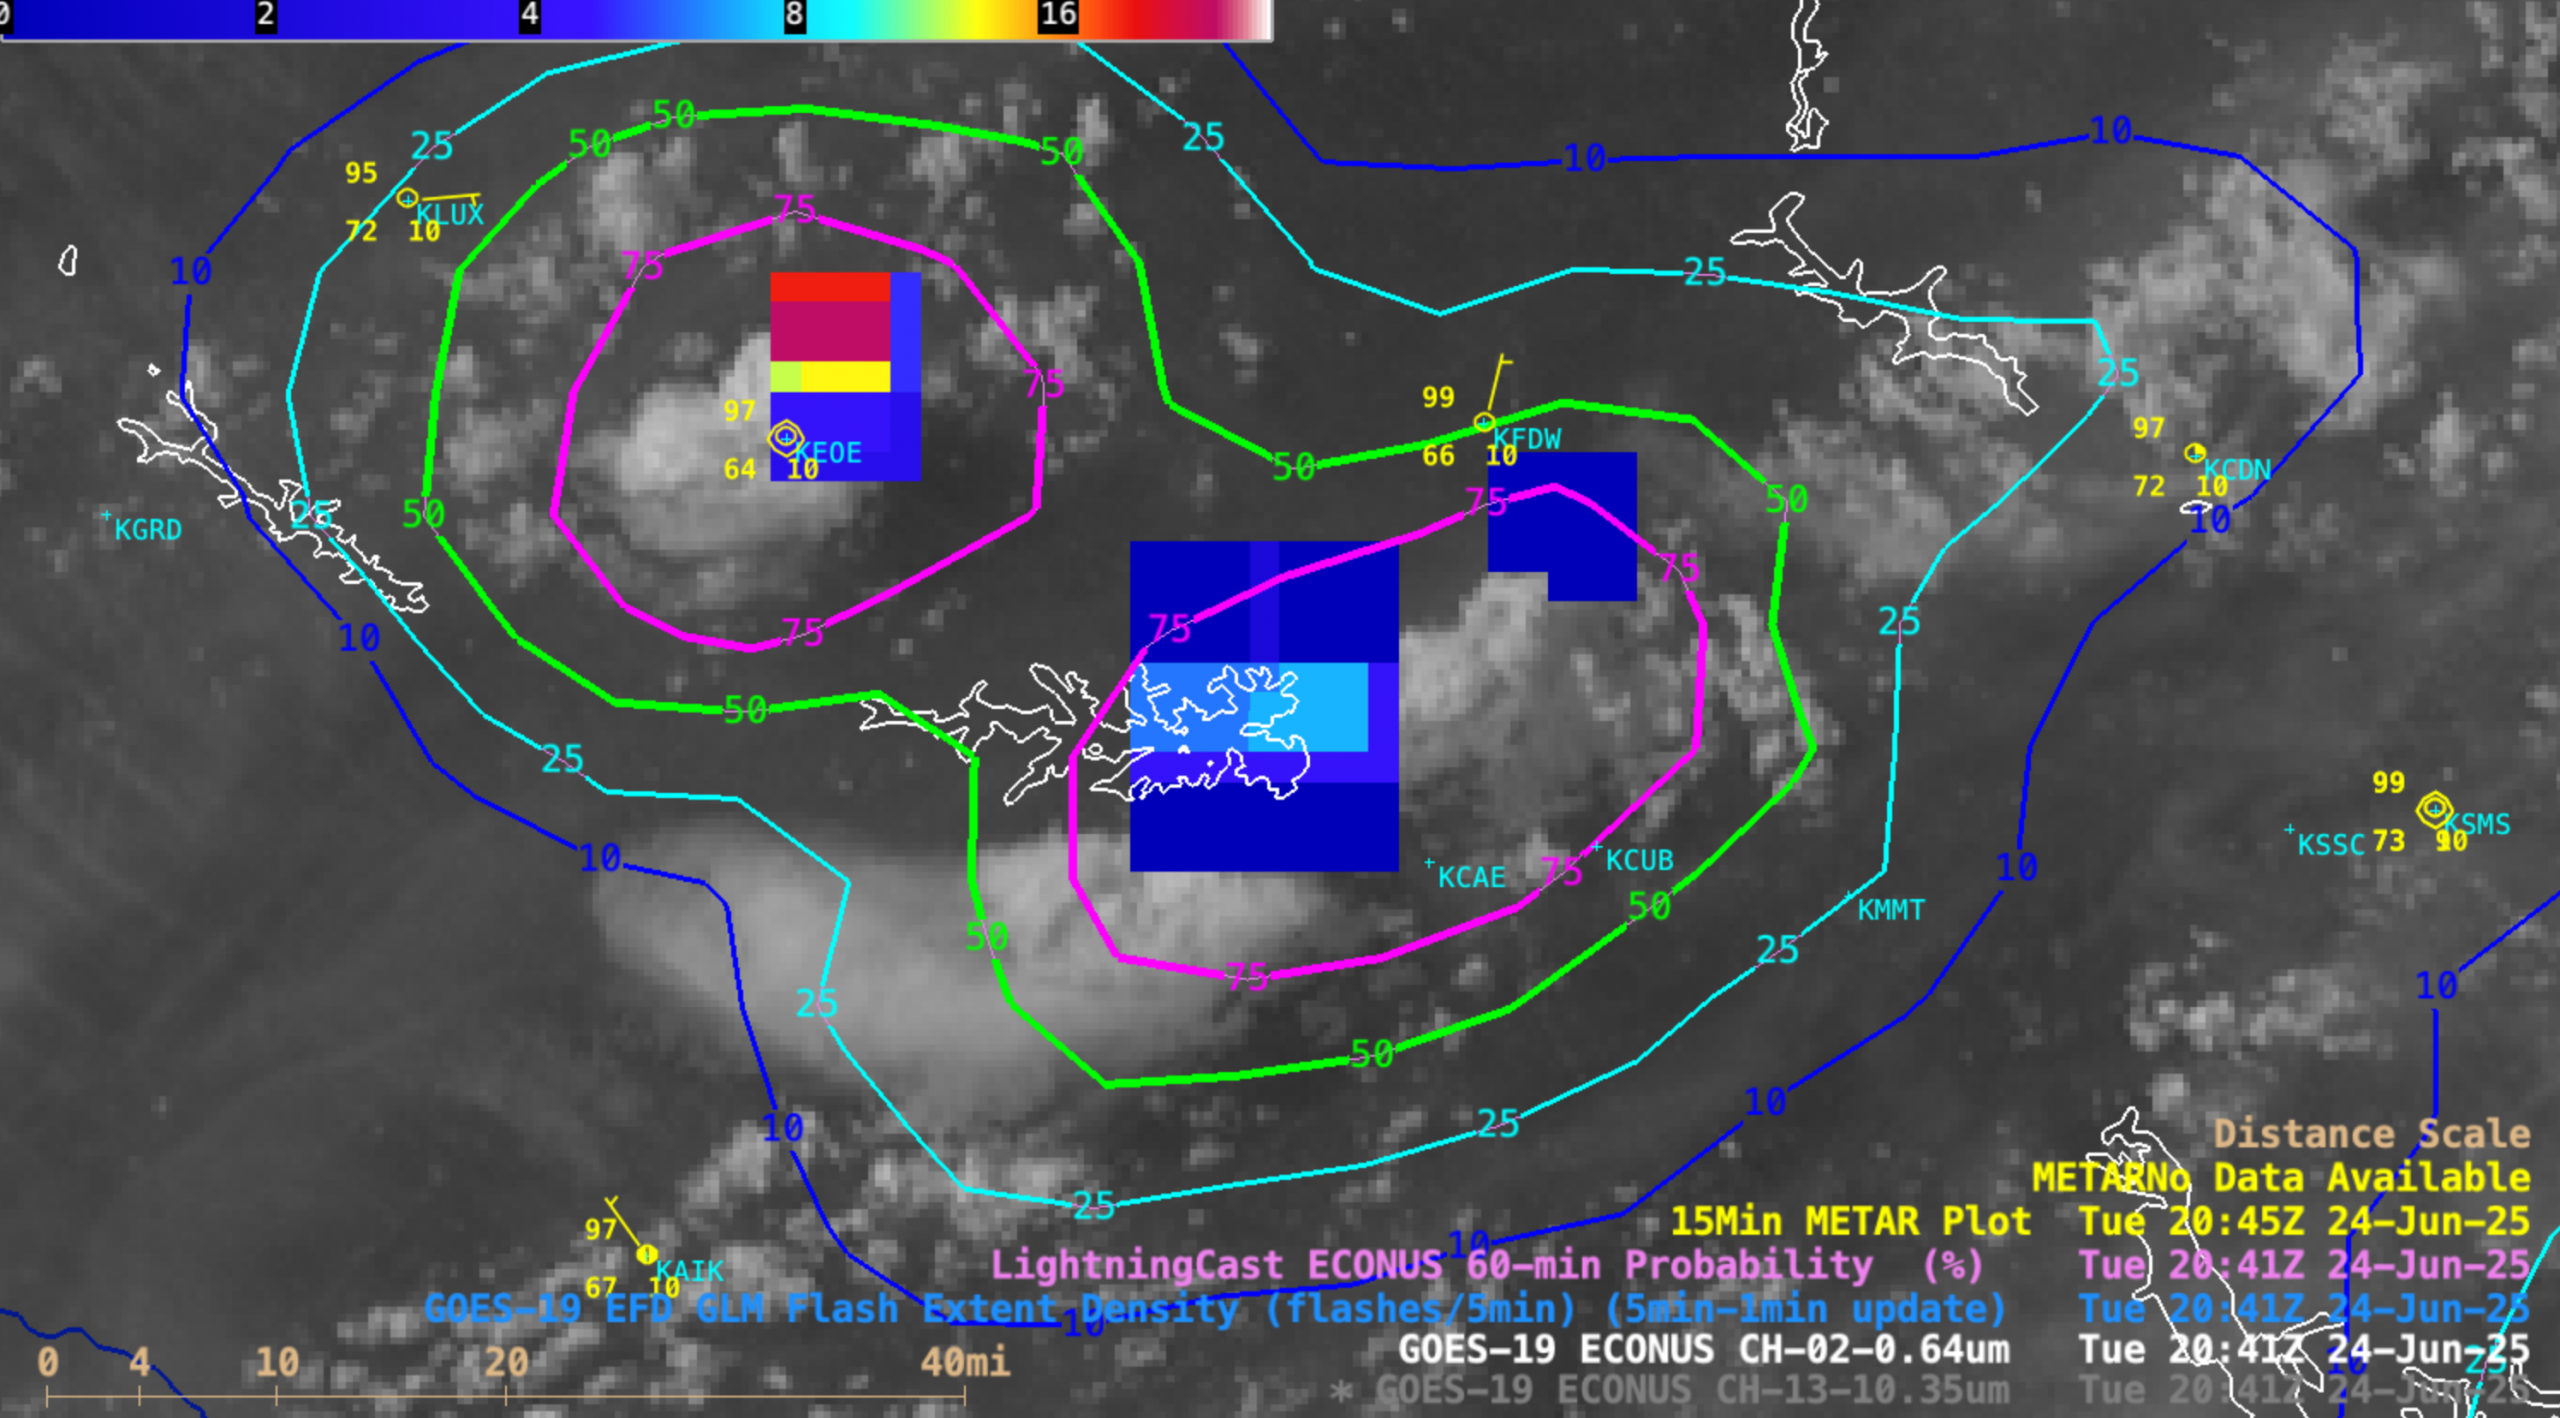
5-minute GOES-19 Visible (0.64 µm) images centered at the eastern edge of Lake Murray, with an overlay of GLM Flash Extent Density and contours of LightningCast Probability, from 1801-2101 UTC on 24 June [click to play MP4 animation]
5-minute CONUS Sector GOES-19
(GOES-East) Visible images with an overlay of
GLM Flash Extent Density (
FED) and contours of
LightningCast Probability
(above) showed two isolated thunderstorms which passed over the eastern portion of
Lake Murray (located in central South Carolina, just northwest of Columbia KCAE) during the late afternoon hours on
24 June 2025. GLM FED highlighted the presence of satellite-detected lightning activity with each of those two storms — and with the second storm, a lightning strike on the lake around 2043 UTC resulted in 20 injuries, with 12 of those being hospitalized (
media report).
A sequence of GOES-19 Infrared and Visible images with LightningCast contours (plus Visible images with both LightningCast contours and GLM FED) is shown below. Note that the LightningCast Probability began to increase in advance of the appearance of FED pixels. The coldest cloud-top infrared brightness temperatures of the isolated thunderstorms were around -55 to -57ºC.
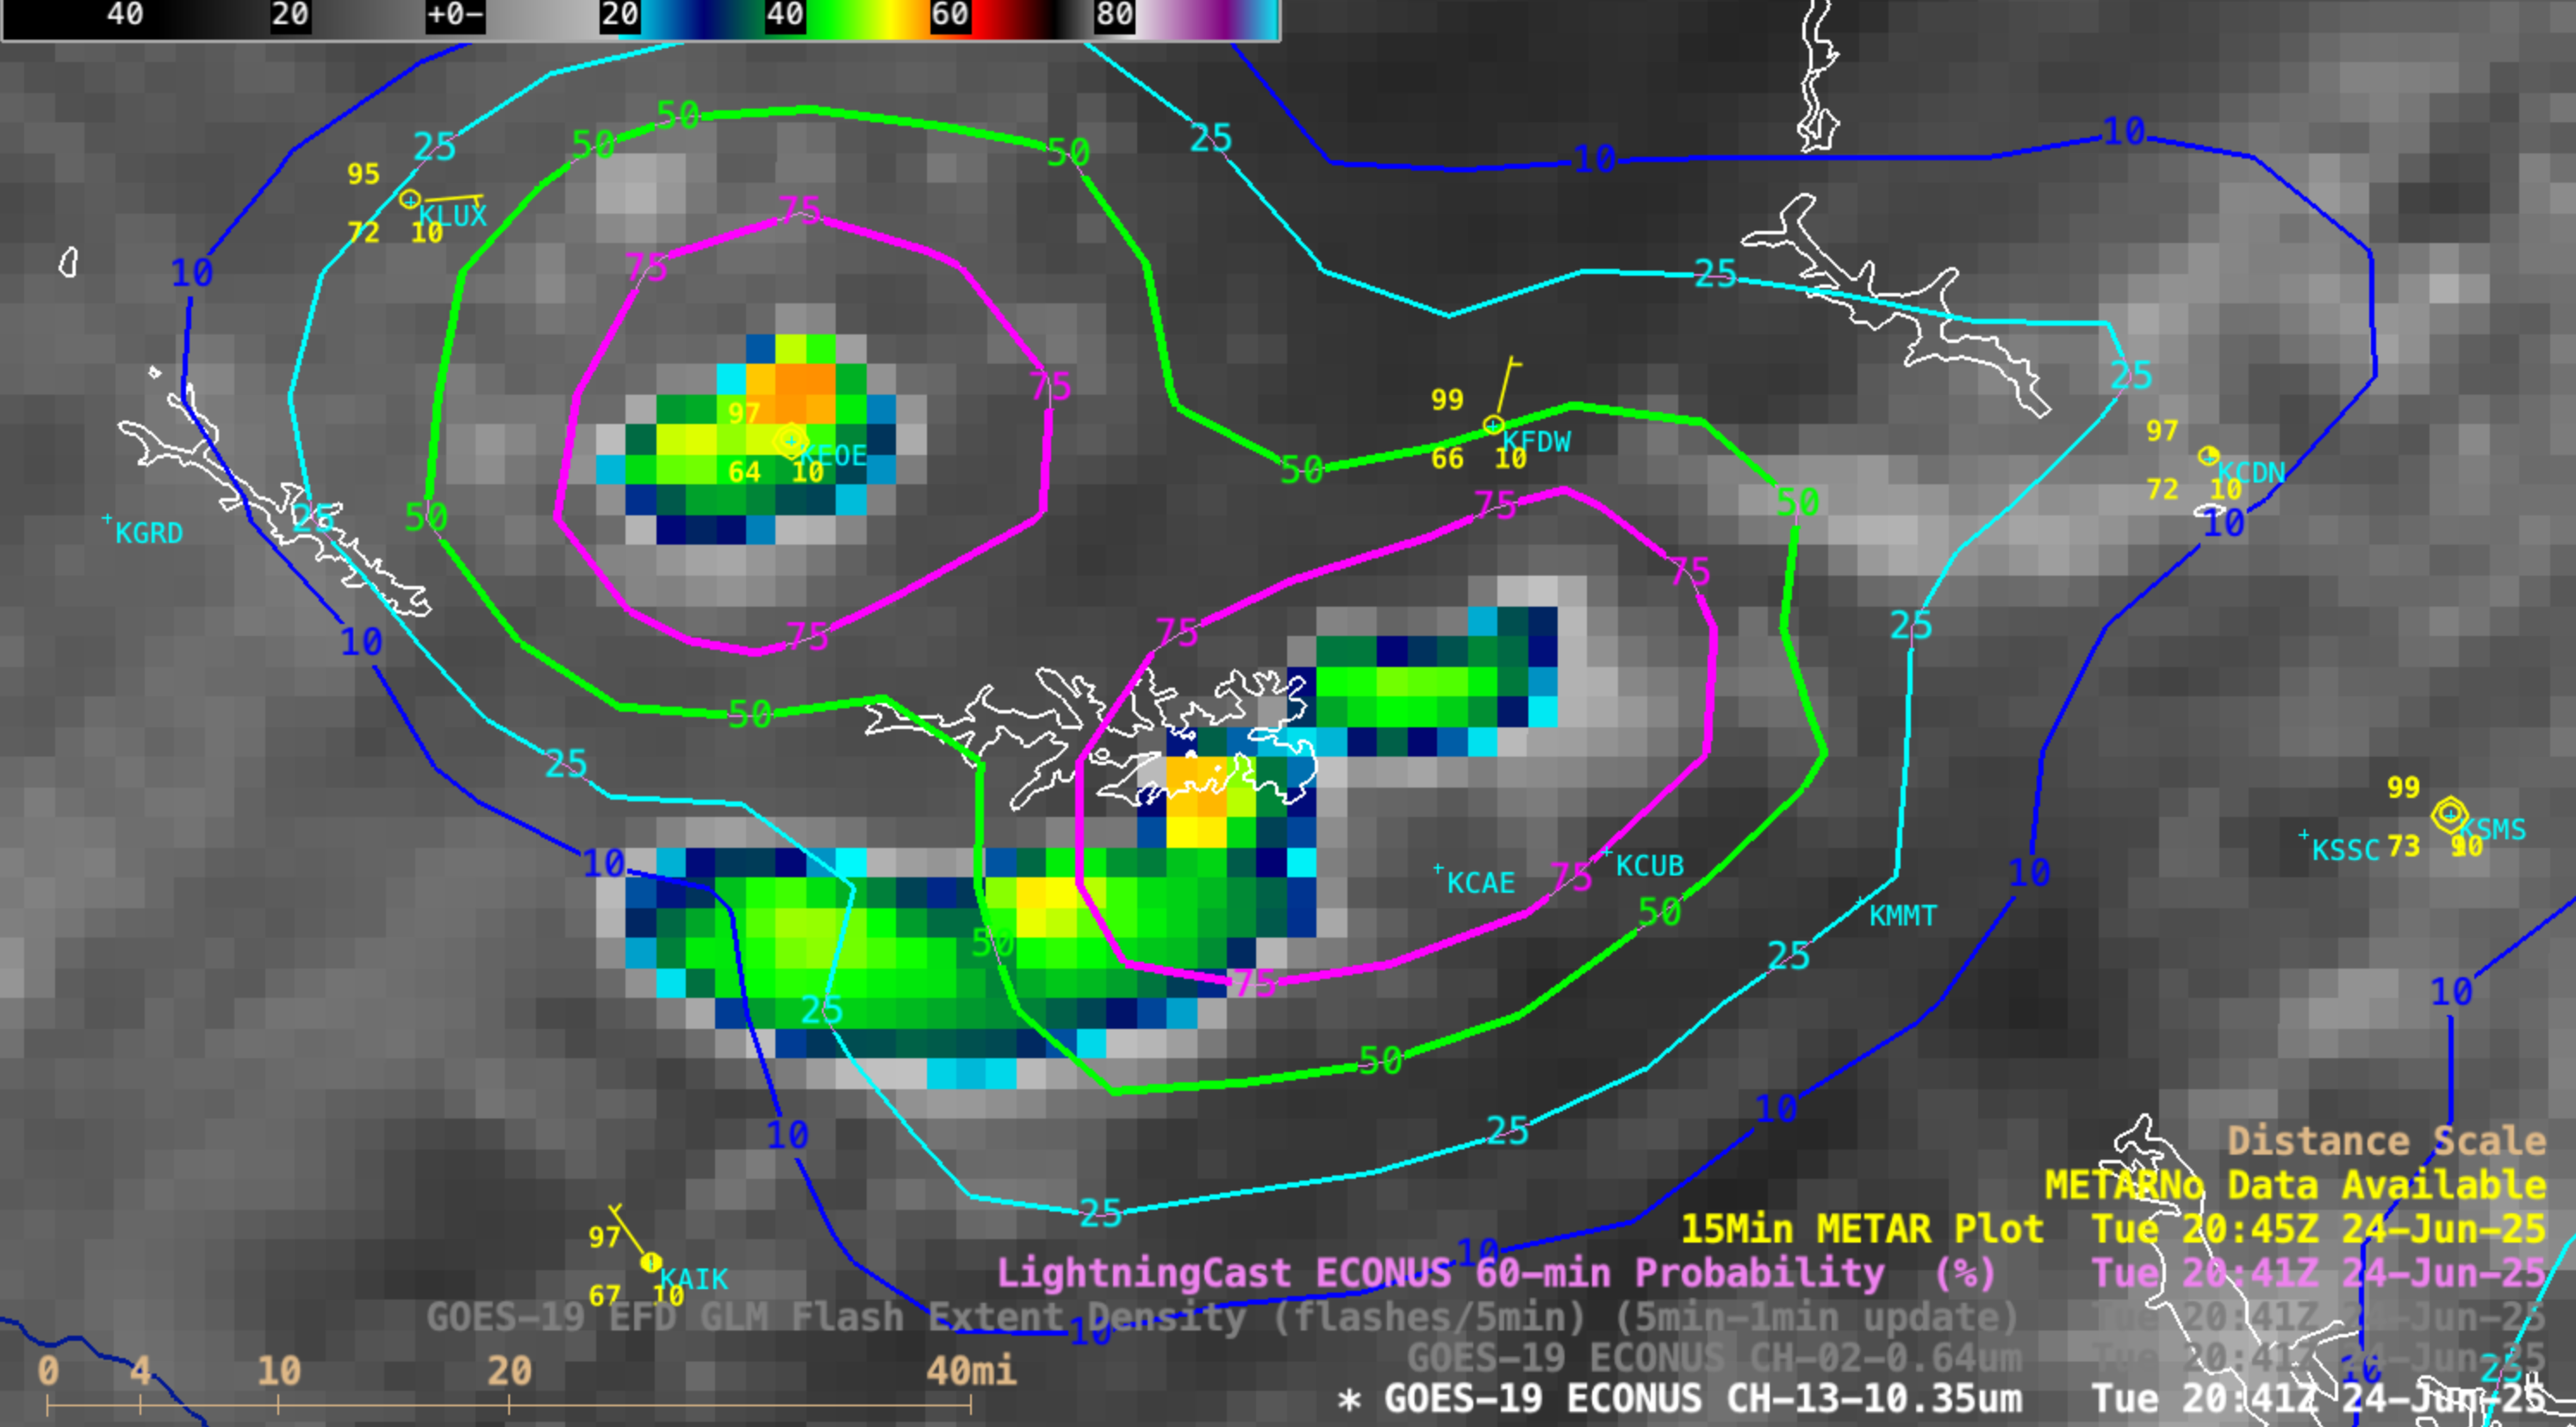
5-minute GOES-19 Infrared (10.3 µm) and Visible (0.64 µm) images with an overlay of contours of LightningCast Probability (in addition to Visible images with an overlay of GLM Flash Extent Density and contours of LightningCast Probability), from 1801-2101 UTC on 24 June [click to play MP4 animation]
A time series plot of LightningCast Probability and GOES-19 GLM flash counts at Columbia Metropolitan Airport KCAE
(below) showed how the LightningCast Probability dramatically ramped up after 1926 UTC, with GLM flash counts within a 10-mile radius of the airport beginning at 1956 UTC. The LightningCast values dipped briefly at 2021 UTC, as the first storm moved farther from the airport (and before the second storm began to produce GLM flash counts as it moved closer).
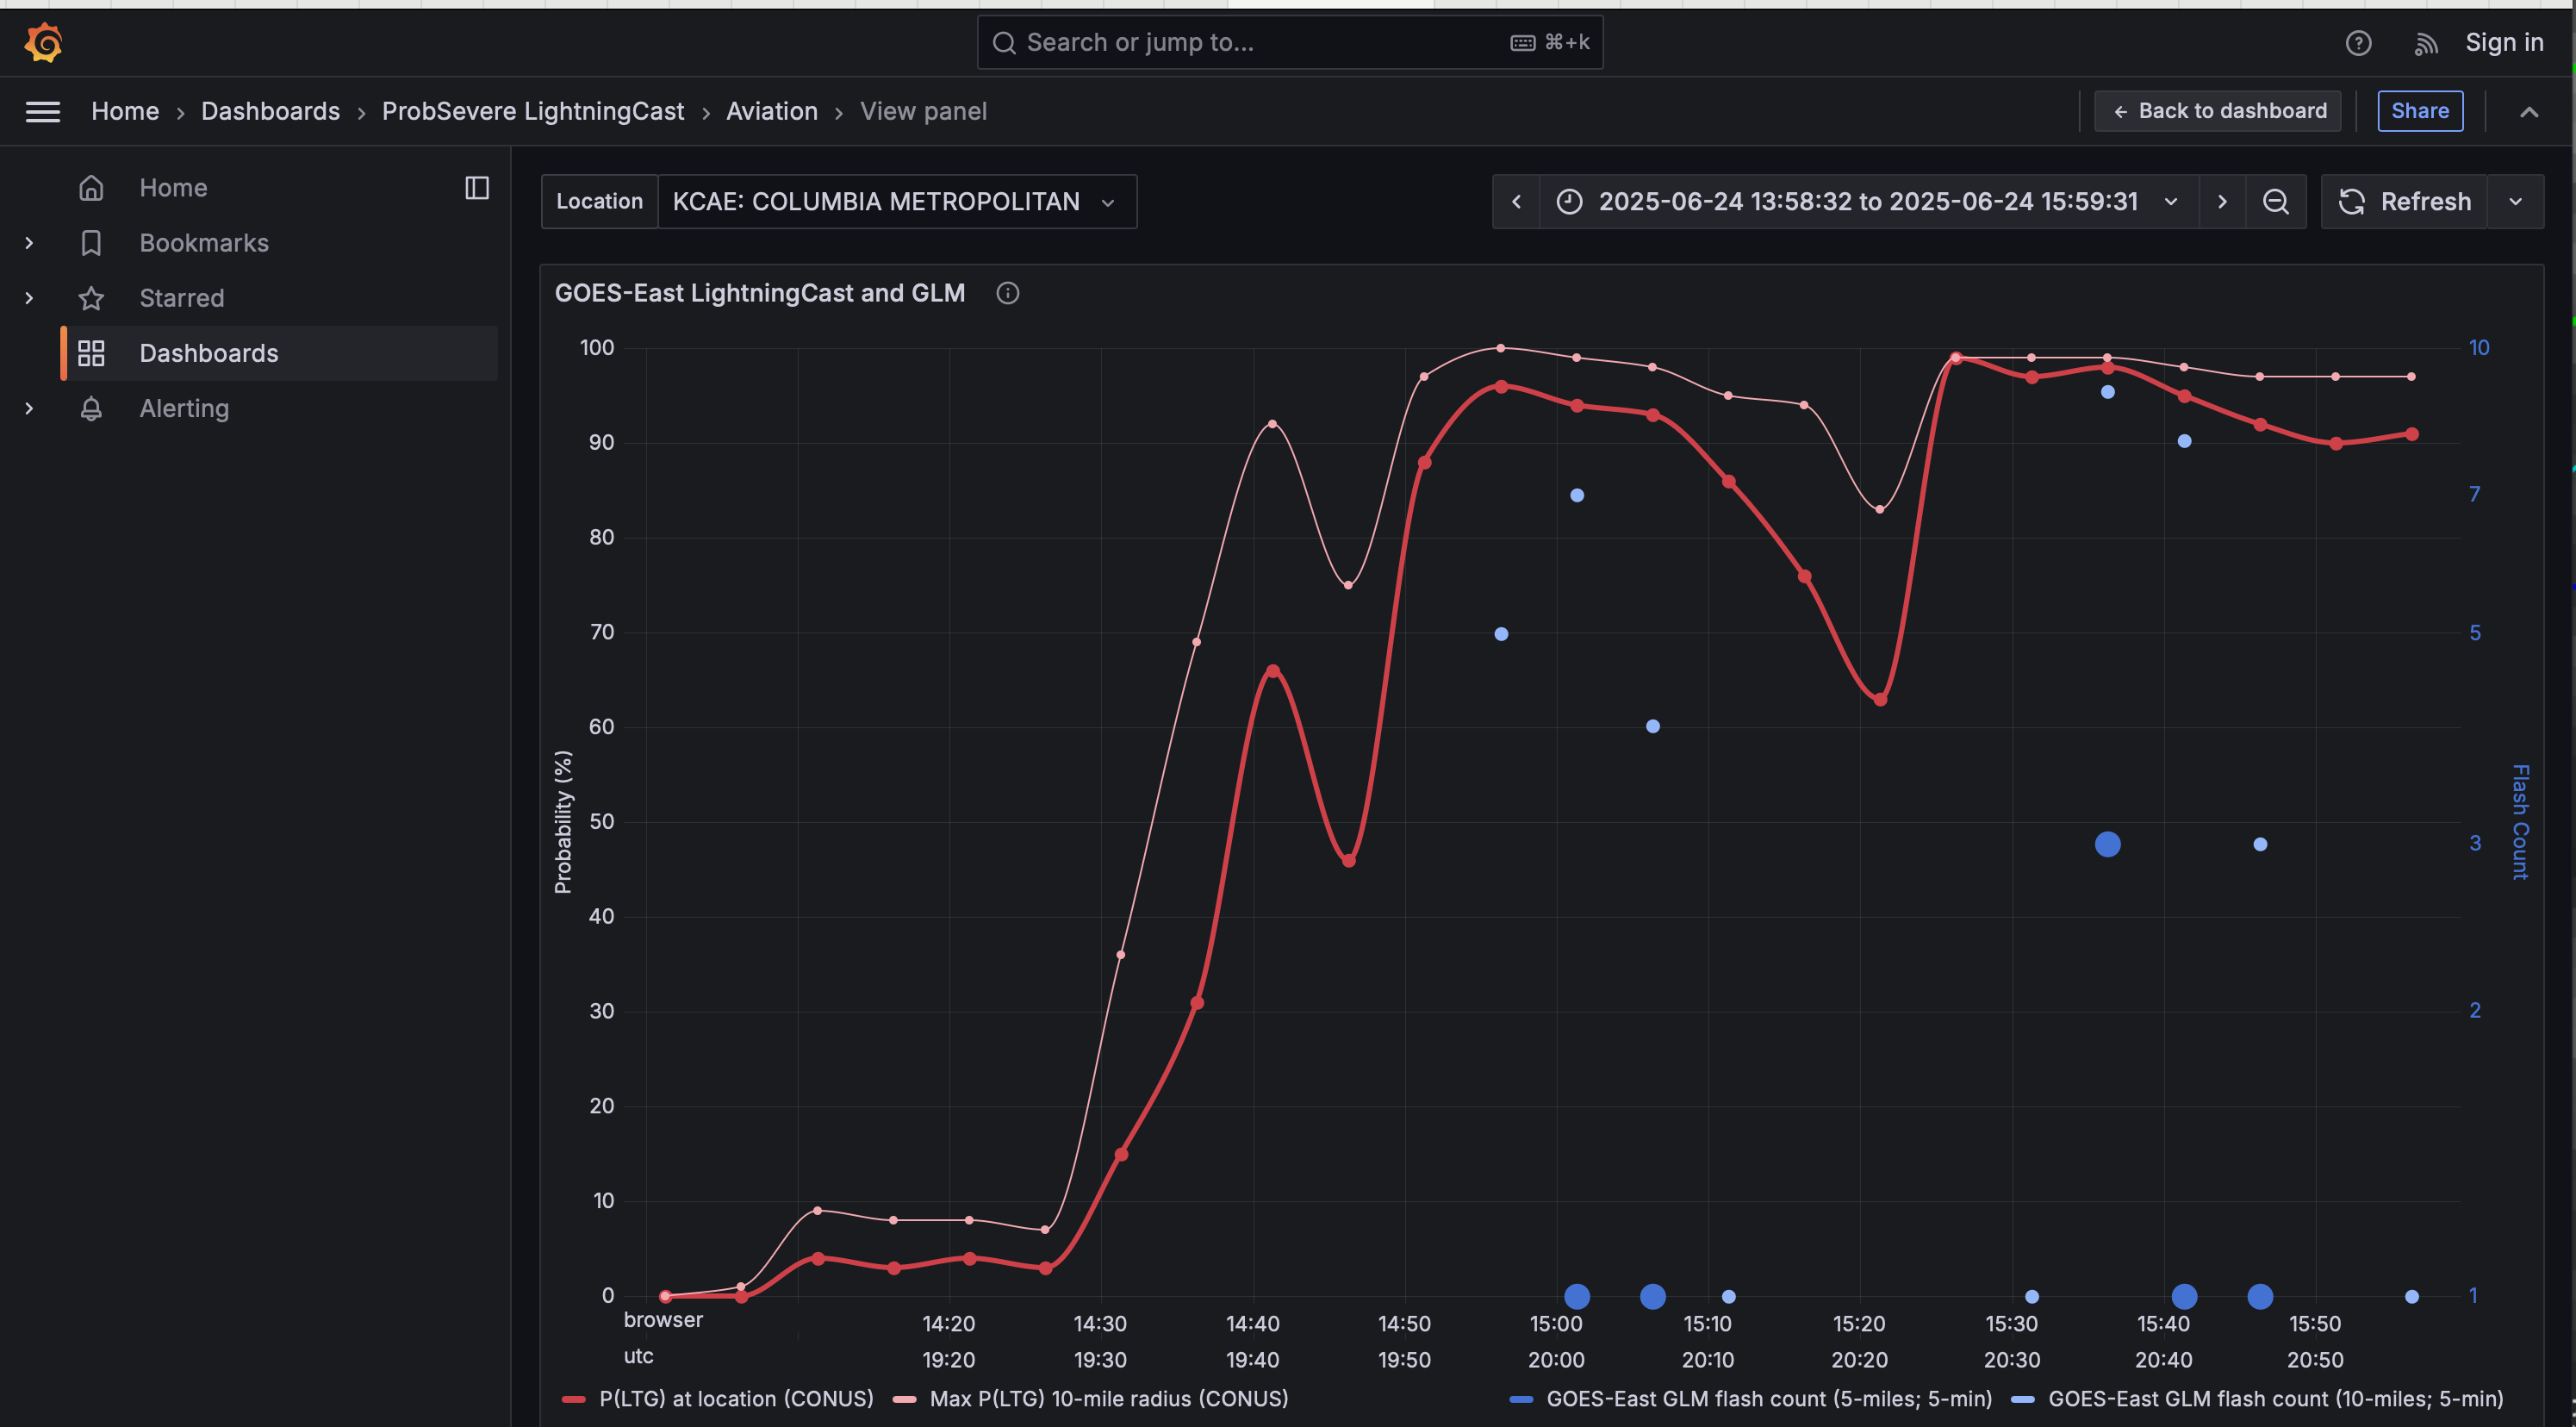
Time series plot of LightningCast Probability and GOES-19 GLM flash counts at Columbia Metropolitan Airport KCAE [click to enlarge]
Cursor samples of LightningCast Probability near the eastern edge of Lake Murray — where the lightning-related injuries occurred — revealed values of 96% from 2026-2041 UTC
(below).
GOES-19 Visible (0.64 µm) images with an overlay of GLM Flash Extent Density and contours of LightningCast Probability (with cursor samples of LightningCast Probability — violet percentage values — near the eastern edge of Lake Murray), from 2026-2041 UTC on 24 June [click to enlarge]
For the storms that affected Lake Murray, lightning was first explicitly mentioned in a METAR report from Fairfield County Airport in Winnsboro at 2015 UTC
(below).
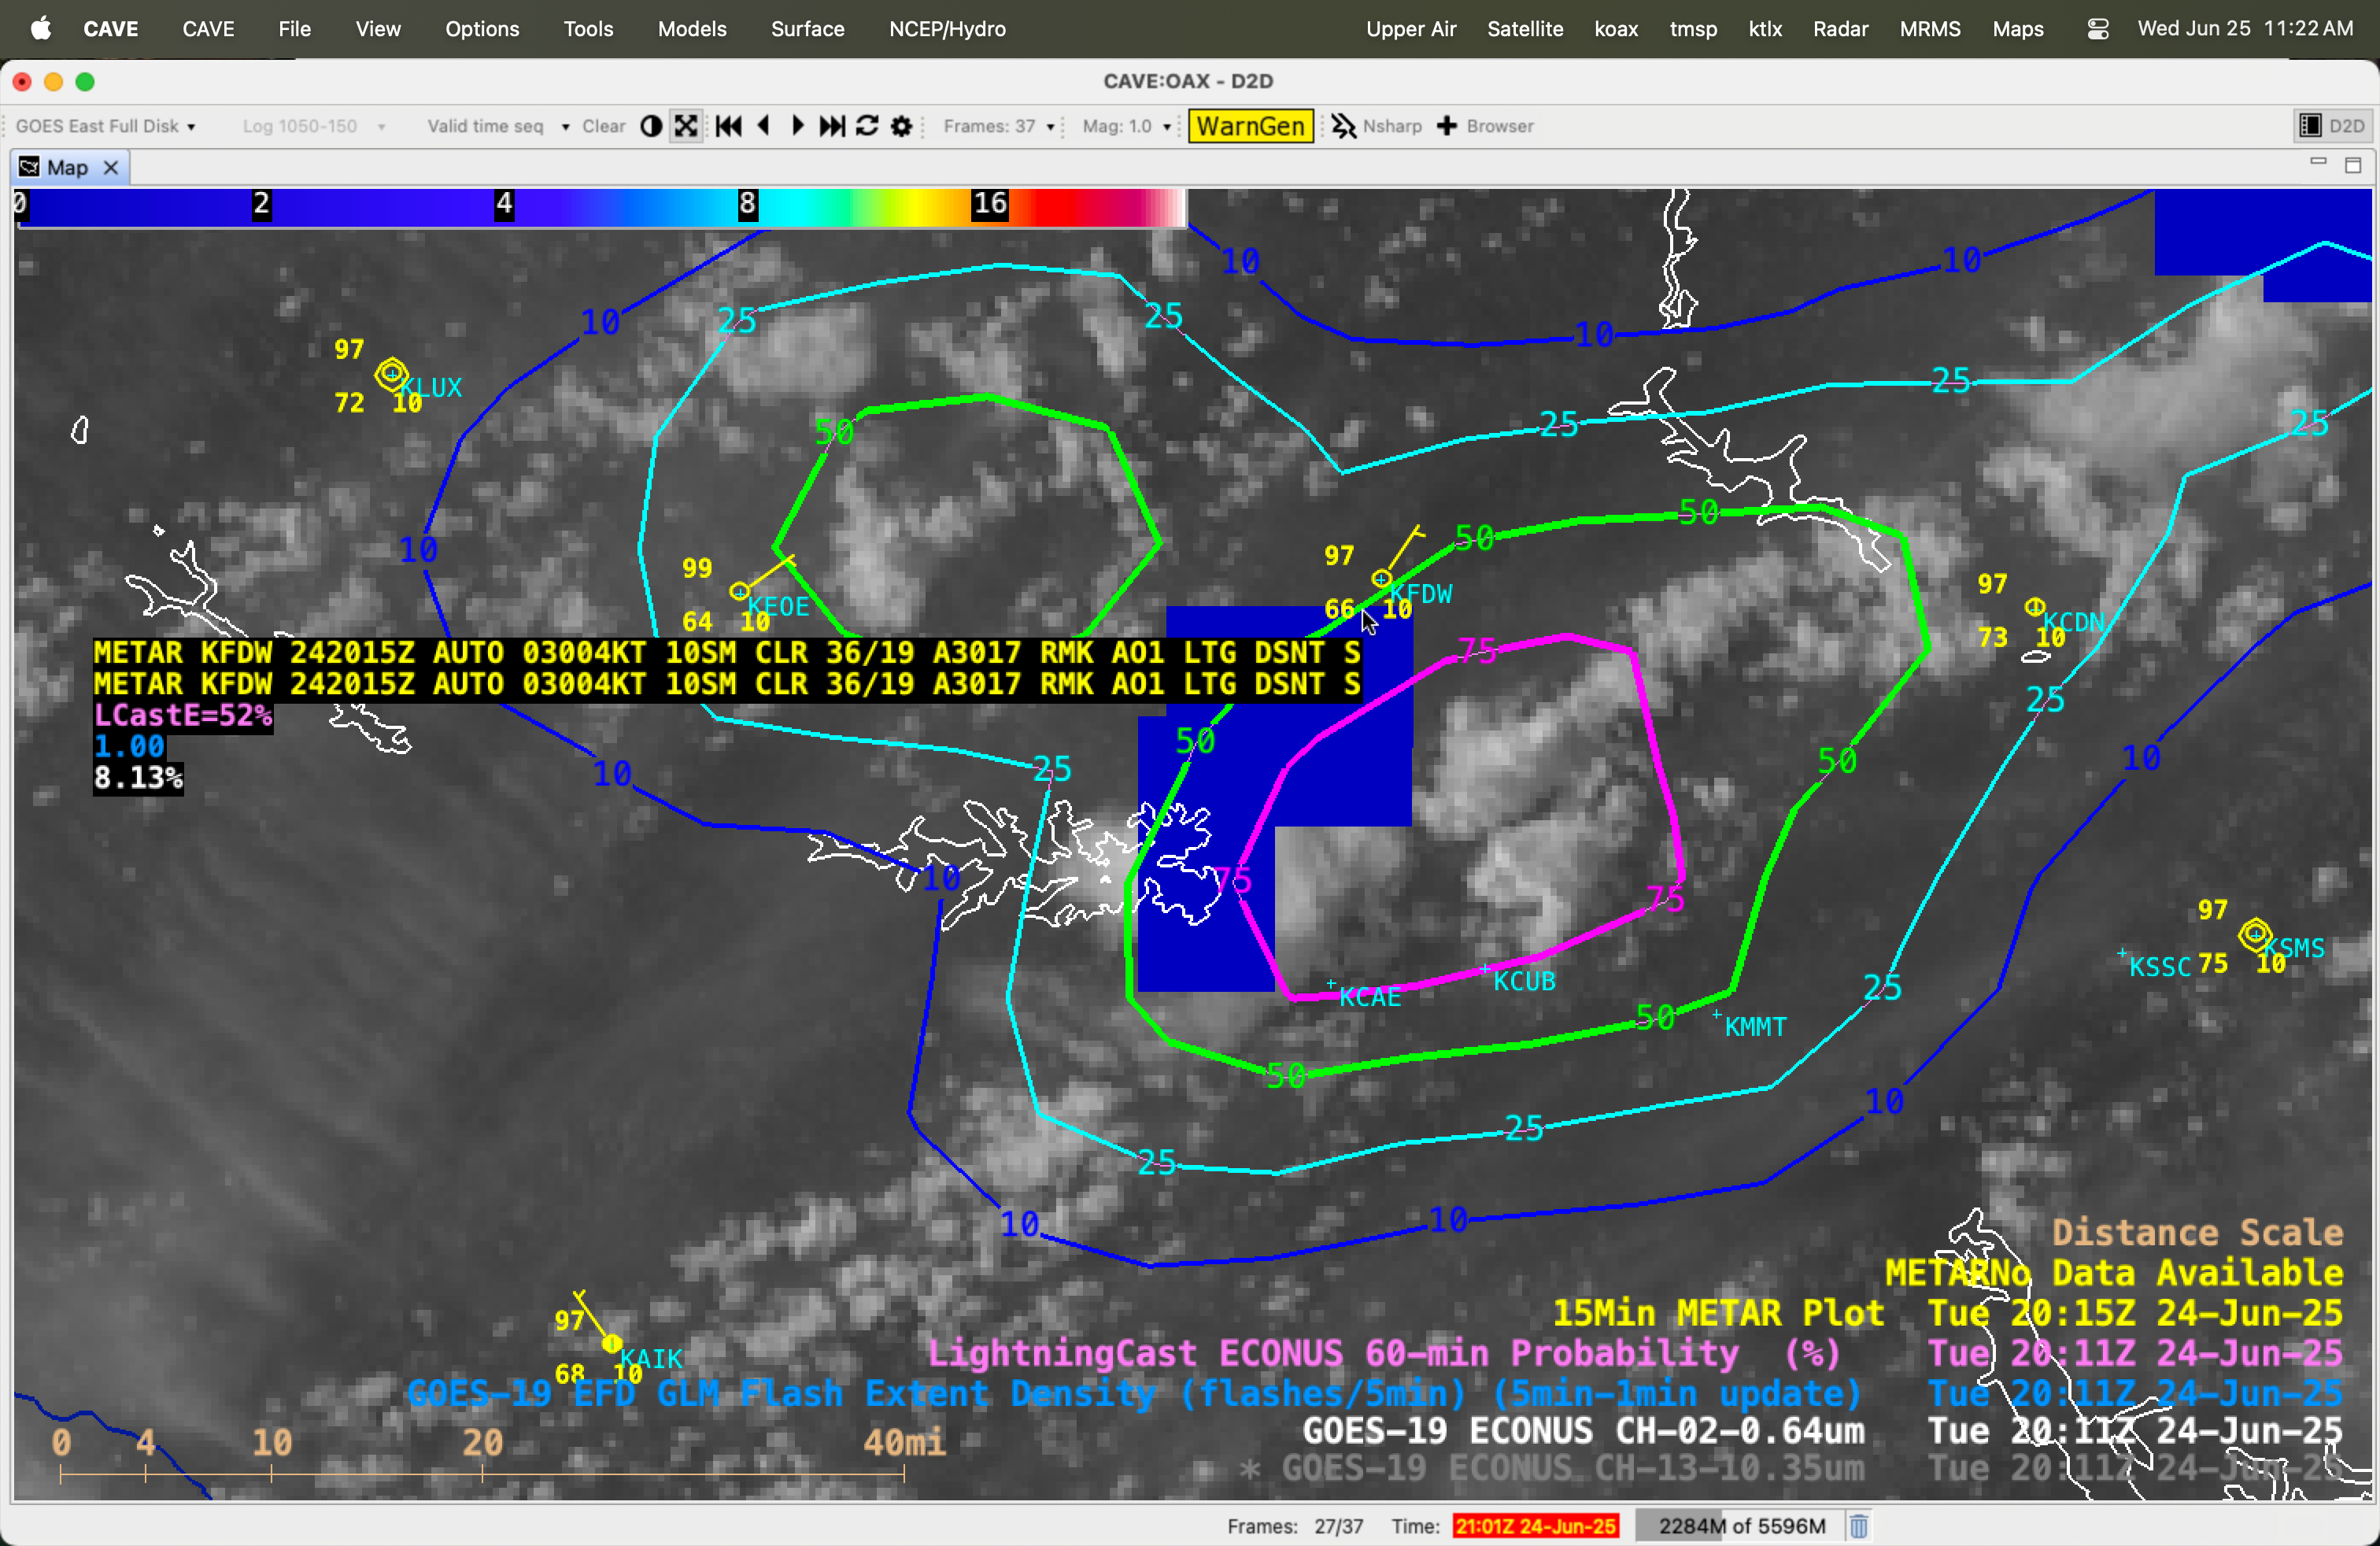
GOES-19 Visible (0.64 µm) image with an overlay of GLM Flash Extent Density and contours of LightningCast Probability at 2011 UTC, with a cursor sample of the 2015 UTC METAR report from Fairfield County Airport KFDW [click to enlarge]
View only this post
Read Less


