This website works best with a newer web browser such as Chrome, Firefox, Safari or Microsoft
Edge. Internet Explorer is not supported by this website.
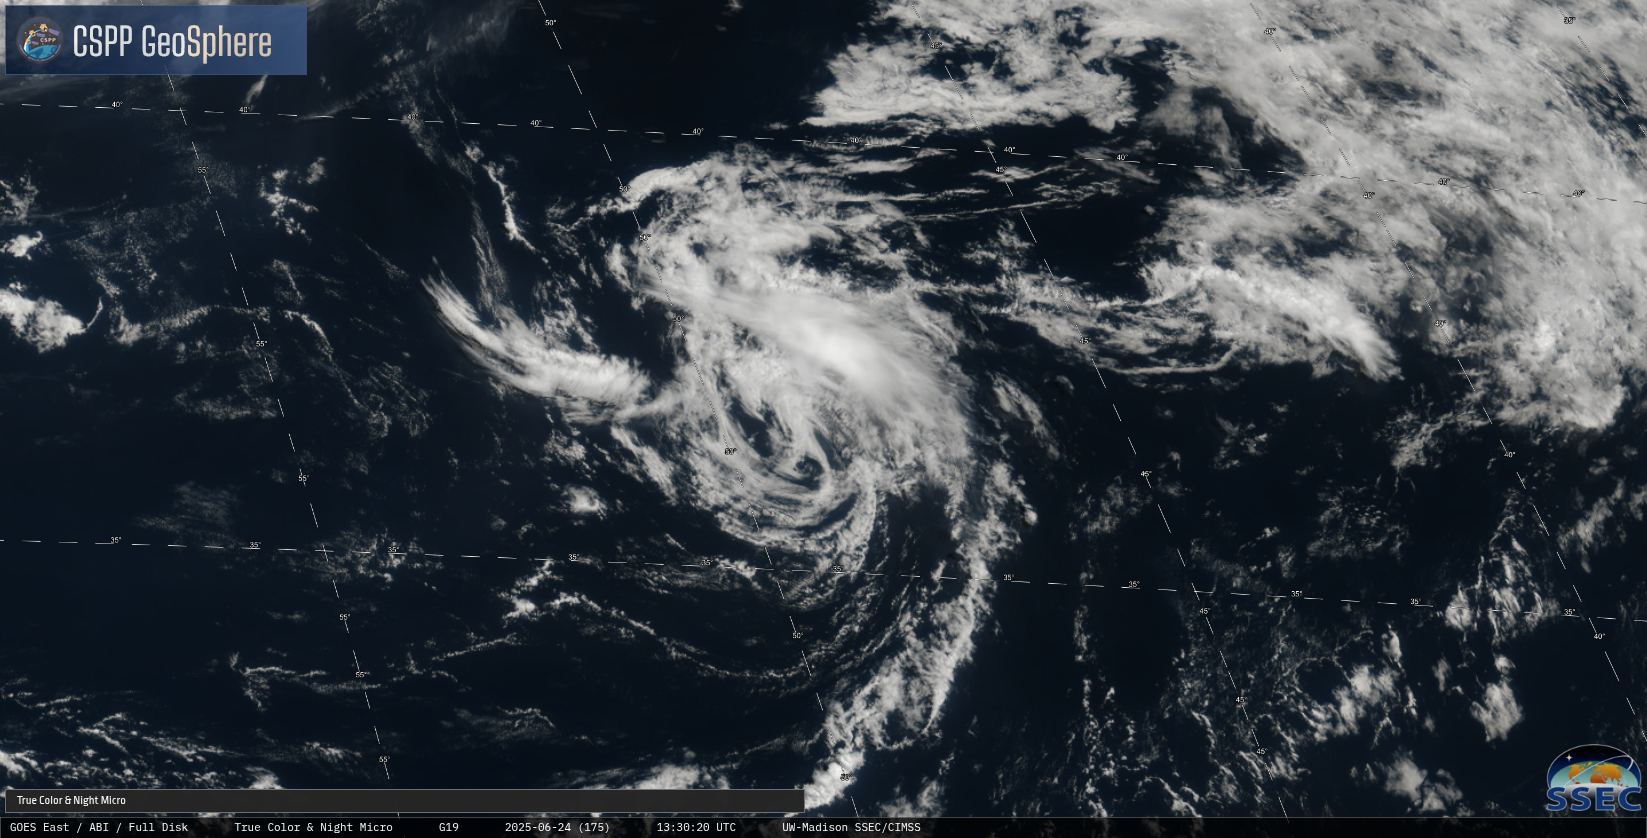
GOES-19 True Color imagery (from CSPP Geosphere) over the mid-Atlantic between 35o and 40oN Latitude, above, shows the circulation of Tropical Storm Andrea, a system that has been tracked for several days now. Overnight, convection developed over the storm, but that convection appears to have dissipated by mid-day on 24 June 2025.... Read More
GOES-19 True Color imagery,
GOES-19 True Color imagery (from CSPP Geosphere) over the mid-Atlantic between 35o and 40oN Latitude, above, shows the circulation of Tropical Storm Andrea, a system that has been tracked for several days now. Overnight, convection developed over the storm, but that convection appears to have dissipated by mid-day on 24 June 2025. A longer (infrared) animation, below, shows an interesting interactions between two circulations. The more prominent of the two is apparent near 39oN at the start of the animation, versus the harder-to-find circulation of what would become Andrea around 35oN. Convection that develops around Andrea — that lead to the storm being named — might have been influenced by the more northerly circulation.
GOES-19 Clean Window infrared (Band 13, 10.3 µm) imagery, 2040 UTC 24 June 2025 – 1620 UTC 25 June 2025 (Click to enlarge)
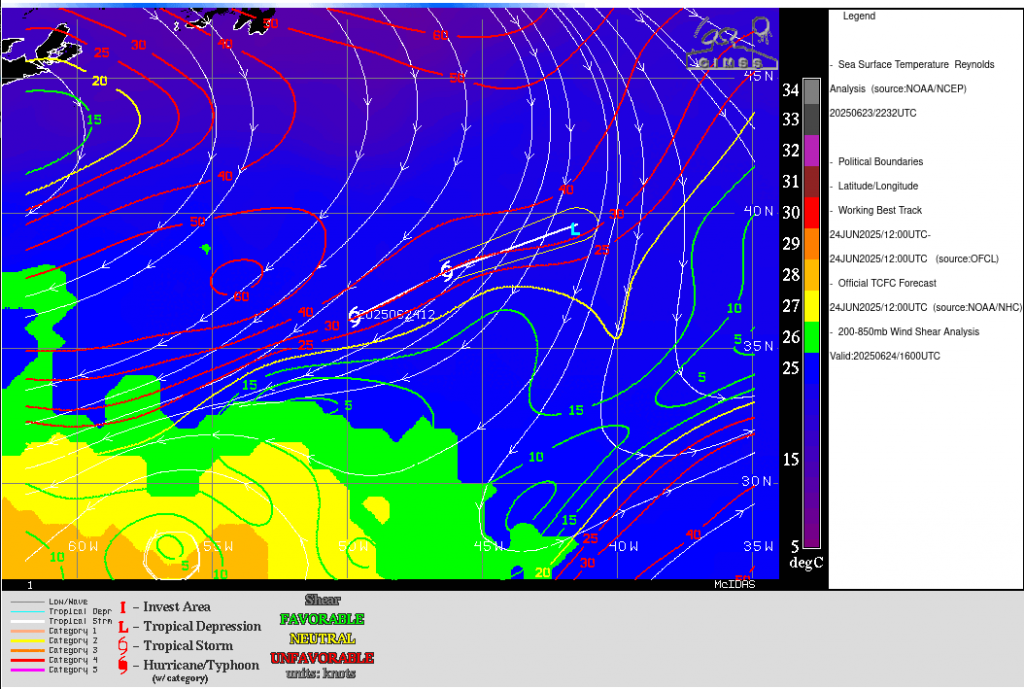
Andrea is in a hostile environment for a tropical storm as shown below (imagery from the CIMSS Tropical Weather Site). Shear is strong, and sea-surface temperatures are cooler than 25oC.
MetopB and MetopC both sampled the storm on 24 June 2025, as shown in the slow toggle below (images taken from the manati website). The compact circulation is moving to the northeast, towards colder waters.
ASCAT imagery from Metop-C (0015 and 1238 UTC) and Metop-B (1325 UTC) on 24 June 2025 (Click to enlarge)
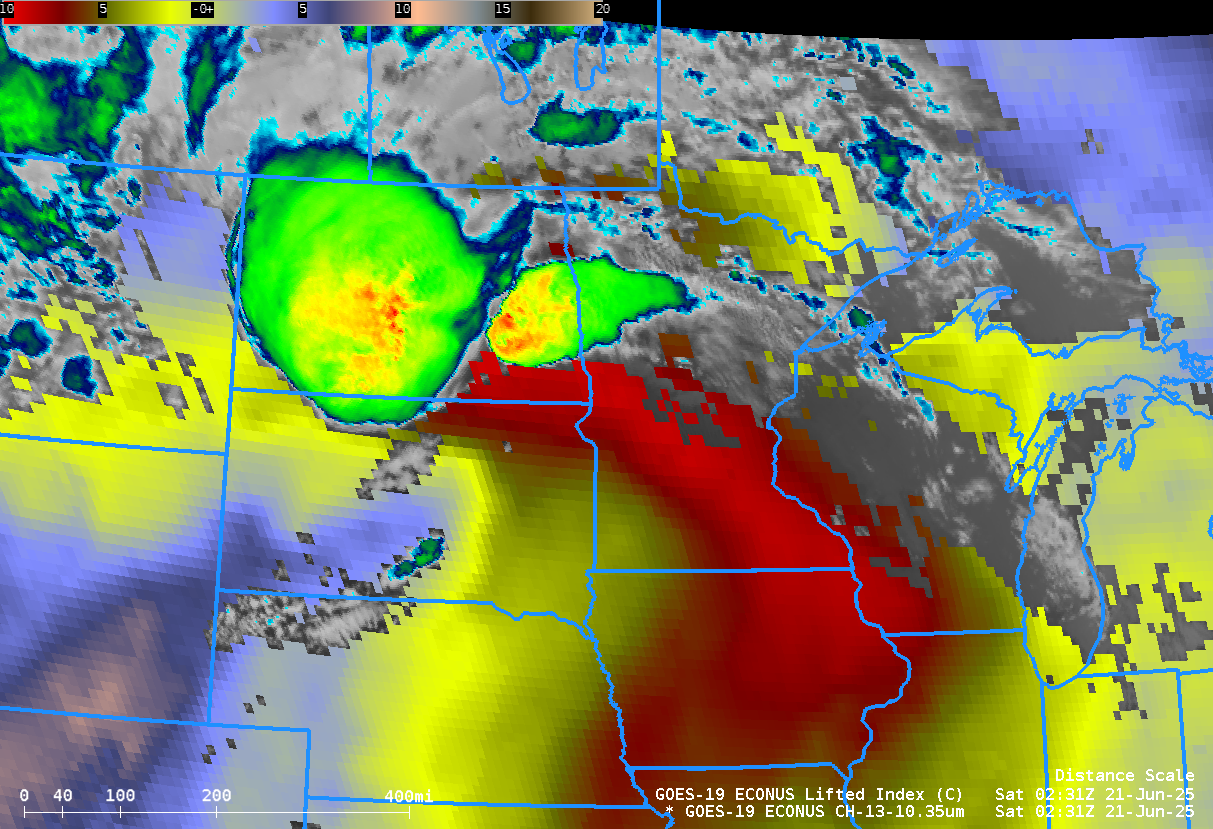
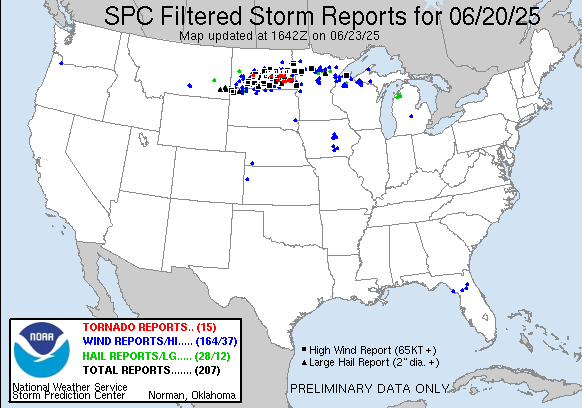
A fast-moving thunderstorm complex raced across North Dakota and Minnesota in the late afternoon/evening/overnight on 20-21 June 2025, as shown above. GOES-19 band 13 (10.3 µm) imagery and derived stability (Lifted Index) show the development of notable instability with an alignment over North Dakota along the direction of convective movement.... Read More
5-minute GOES-19 Clean Window infrared (Band 13, 10.3 µm) imagery, 1701 UTC 20 June 2025 – 0936 UTC 21 June 2025 (Click to enlarge)
A fast-moving thunderstorm complex raced across North Dakota and Minnesota in the late afternoon/evening/overnight on 20-21 June 2025, as shown above. GOES-19 band 13 (10.3 µm) imagery and derived stability (Lifted Index) show the development of notable instability with an alignment over North Dakota along the direction of convective movement. One very noteworthy aspect of the cold cloud-tops in GOES-19 is their very rapid movement across central North Dakota from about 0100-0500 UTC on 21 June. Mesoscale discussions from SPC on this complex are here, here, here, here, here, here, here, here, here and here (!! — there were a lot of them!). SPC Watch numbers 447, 448 and 449 covered this system.
Storm Reports from the Storm Prediction Center, 1200 UTC 20 June – 1200 UTC 21 June 2025 (Click to enlarge)
________________
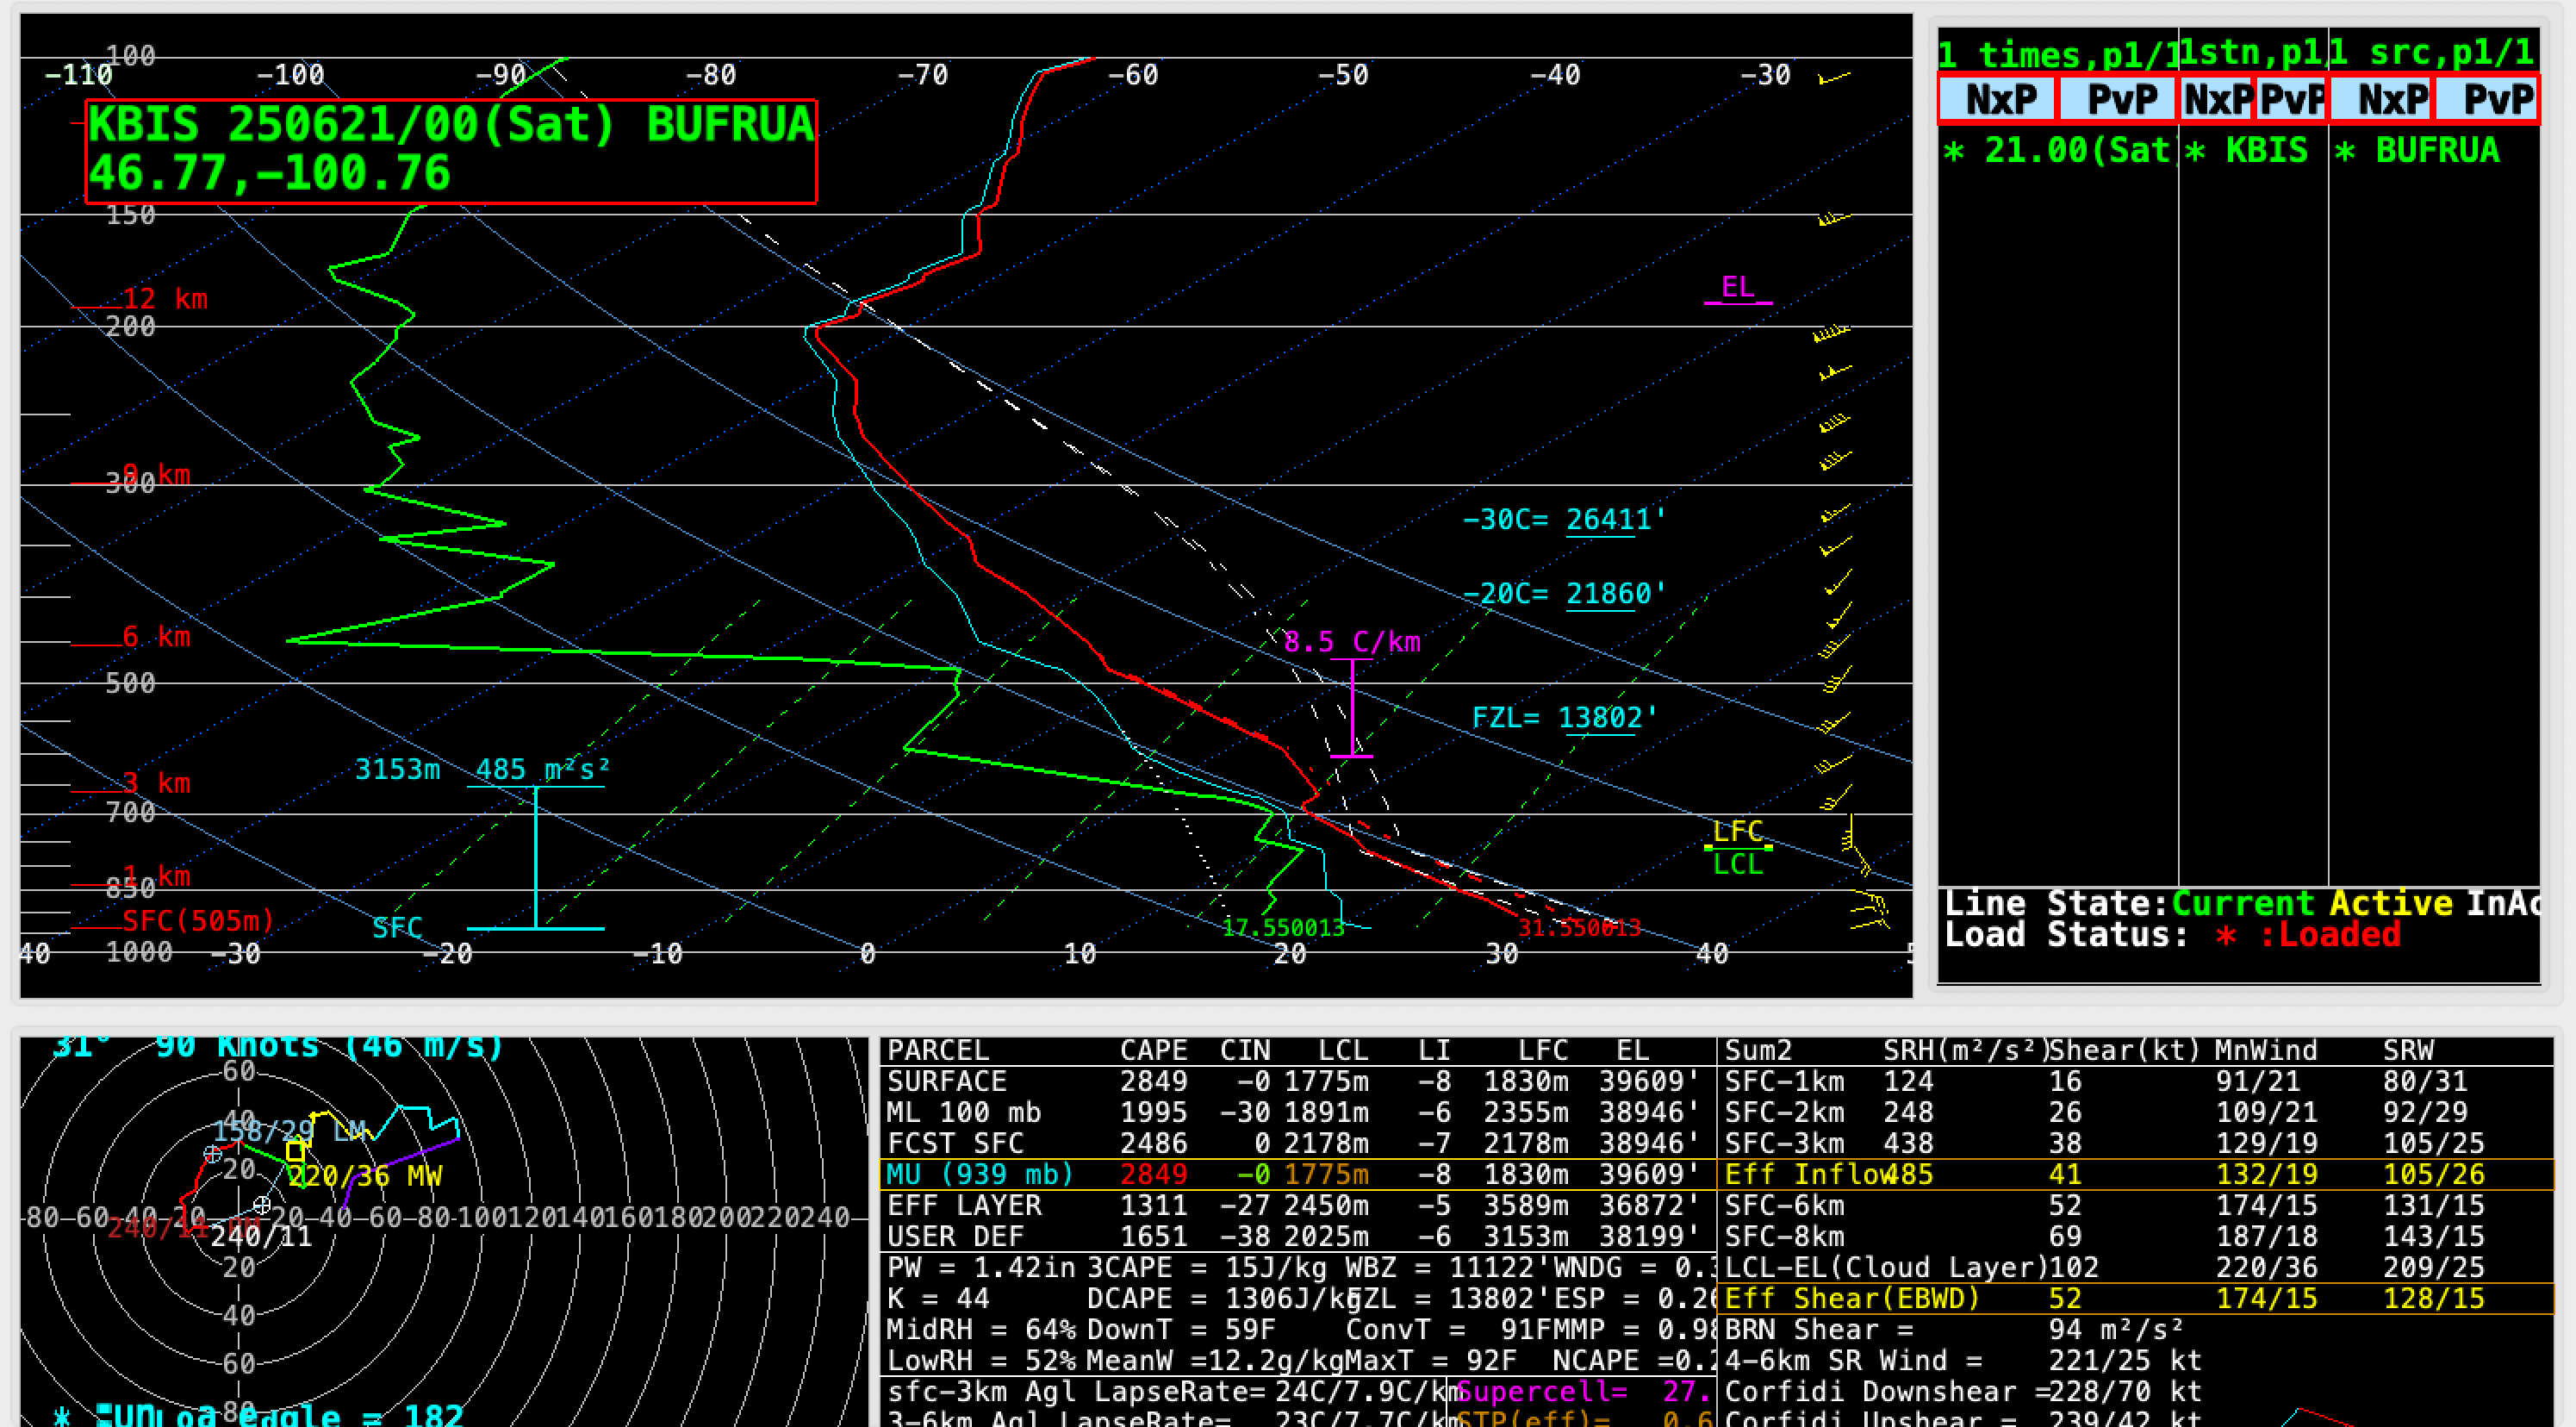
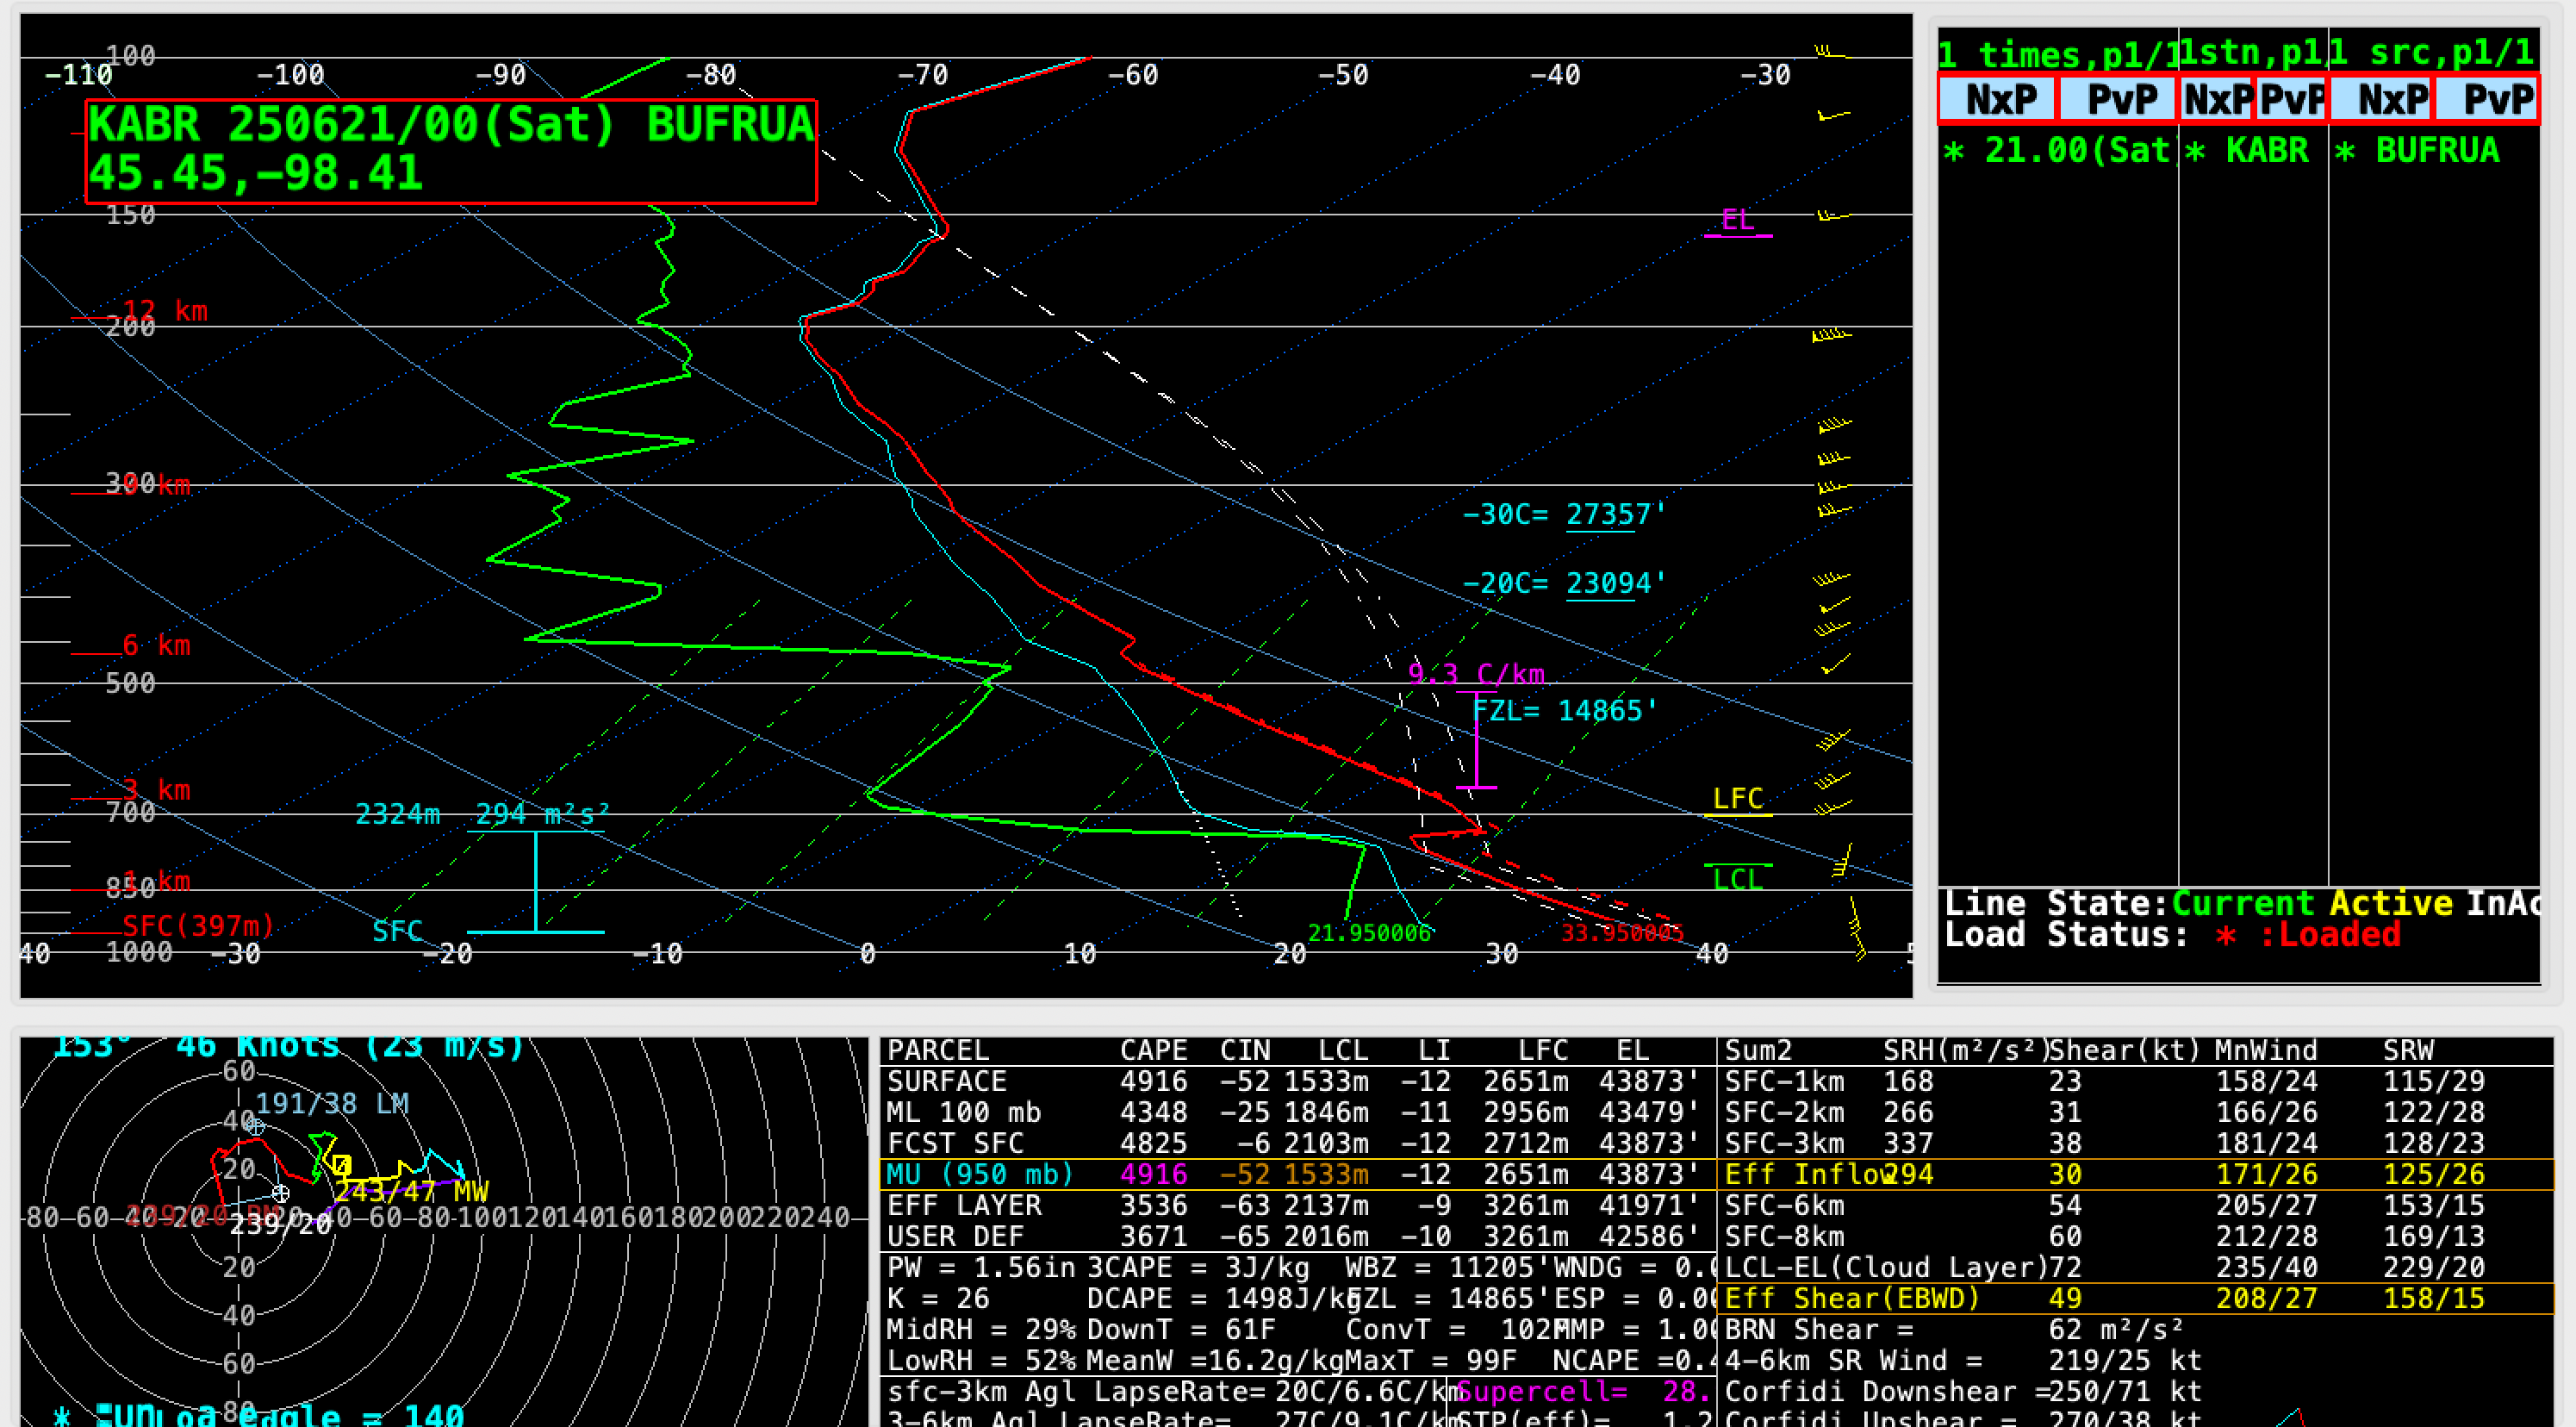
Overlapping 1-minute Mesoscale Domain Sectors provided GOES-19 (GOES-East) imagery at 30-second intervals over much of the area affected by this severe convection; shown below is Infrared imagery of a large mesoscale convective system over western/central North Dakota and a pair of supercell thunderstorms in eastern North Dakota as they eventually merged and began to move eastward across northwestern Minnesota. Pulsing overshooting tops exhibited infrared brightness temperatures in the -75 to -79ºC range (brighter white pixels embedded within dark black areas) — which represented a significant overshoot of the Most Unstable (MU) air parcel’s Equilibrium Level (EL), according to rawinsonde data at Bismarck ND and Aberdeen SD.
The supercell thunderstorms that developed over eastern North Dakota produced several tornadoes, including an EF3-rated tornado near Enderlin shortly after 0400 UTC that was responsible for 3 fatalities (NWS Grand Forks damage survey) **NOTE: after further investigation, Enderlin tornado #1 was upgraded from an EF-3 to an EF-5; specific details are available here. This was the first EF5-rated tornado in the US since 20 May 2013 in Moore OK**. Hail as large as 3.00″ in diameter also was reported with these supercell thunderstorms. The highest wind gusts associated with this derecho event included 111 mph in eastern North Dakota and 106 mph in northwestern Minnesota.
30-second GOES-19 Clean Infrared Window (10.3 µm) images with time-matched (+/- 3 minutes) SPC Storm Reports plotted in white, from 0040-0715 UTC on 21 June (courtesy Scott Bachmeier, CIMSS) [click to play animated GIF | MP4]
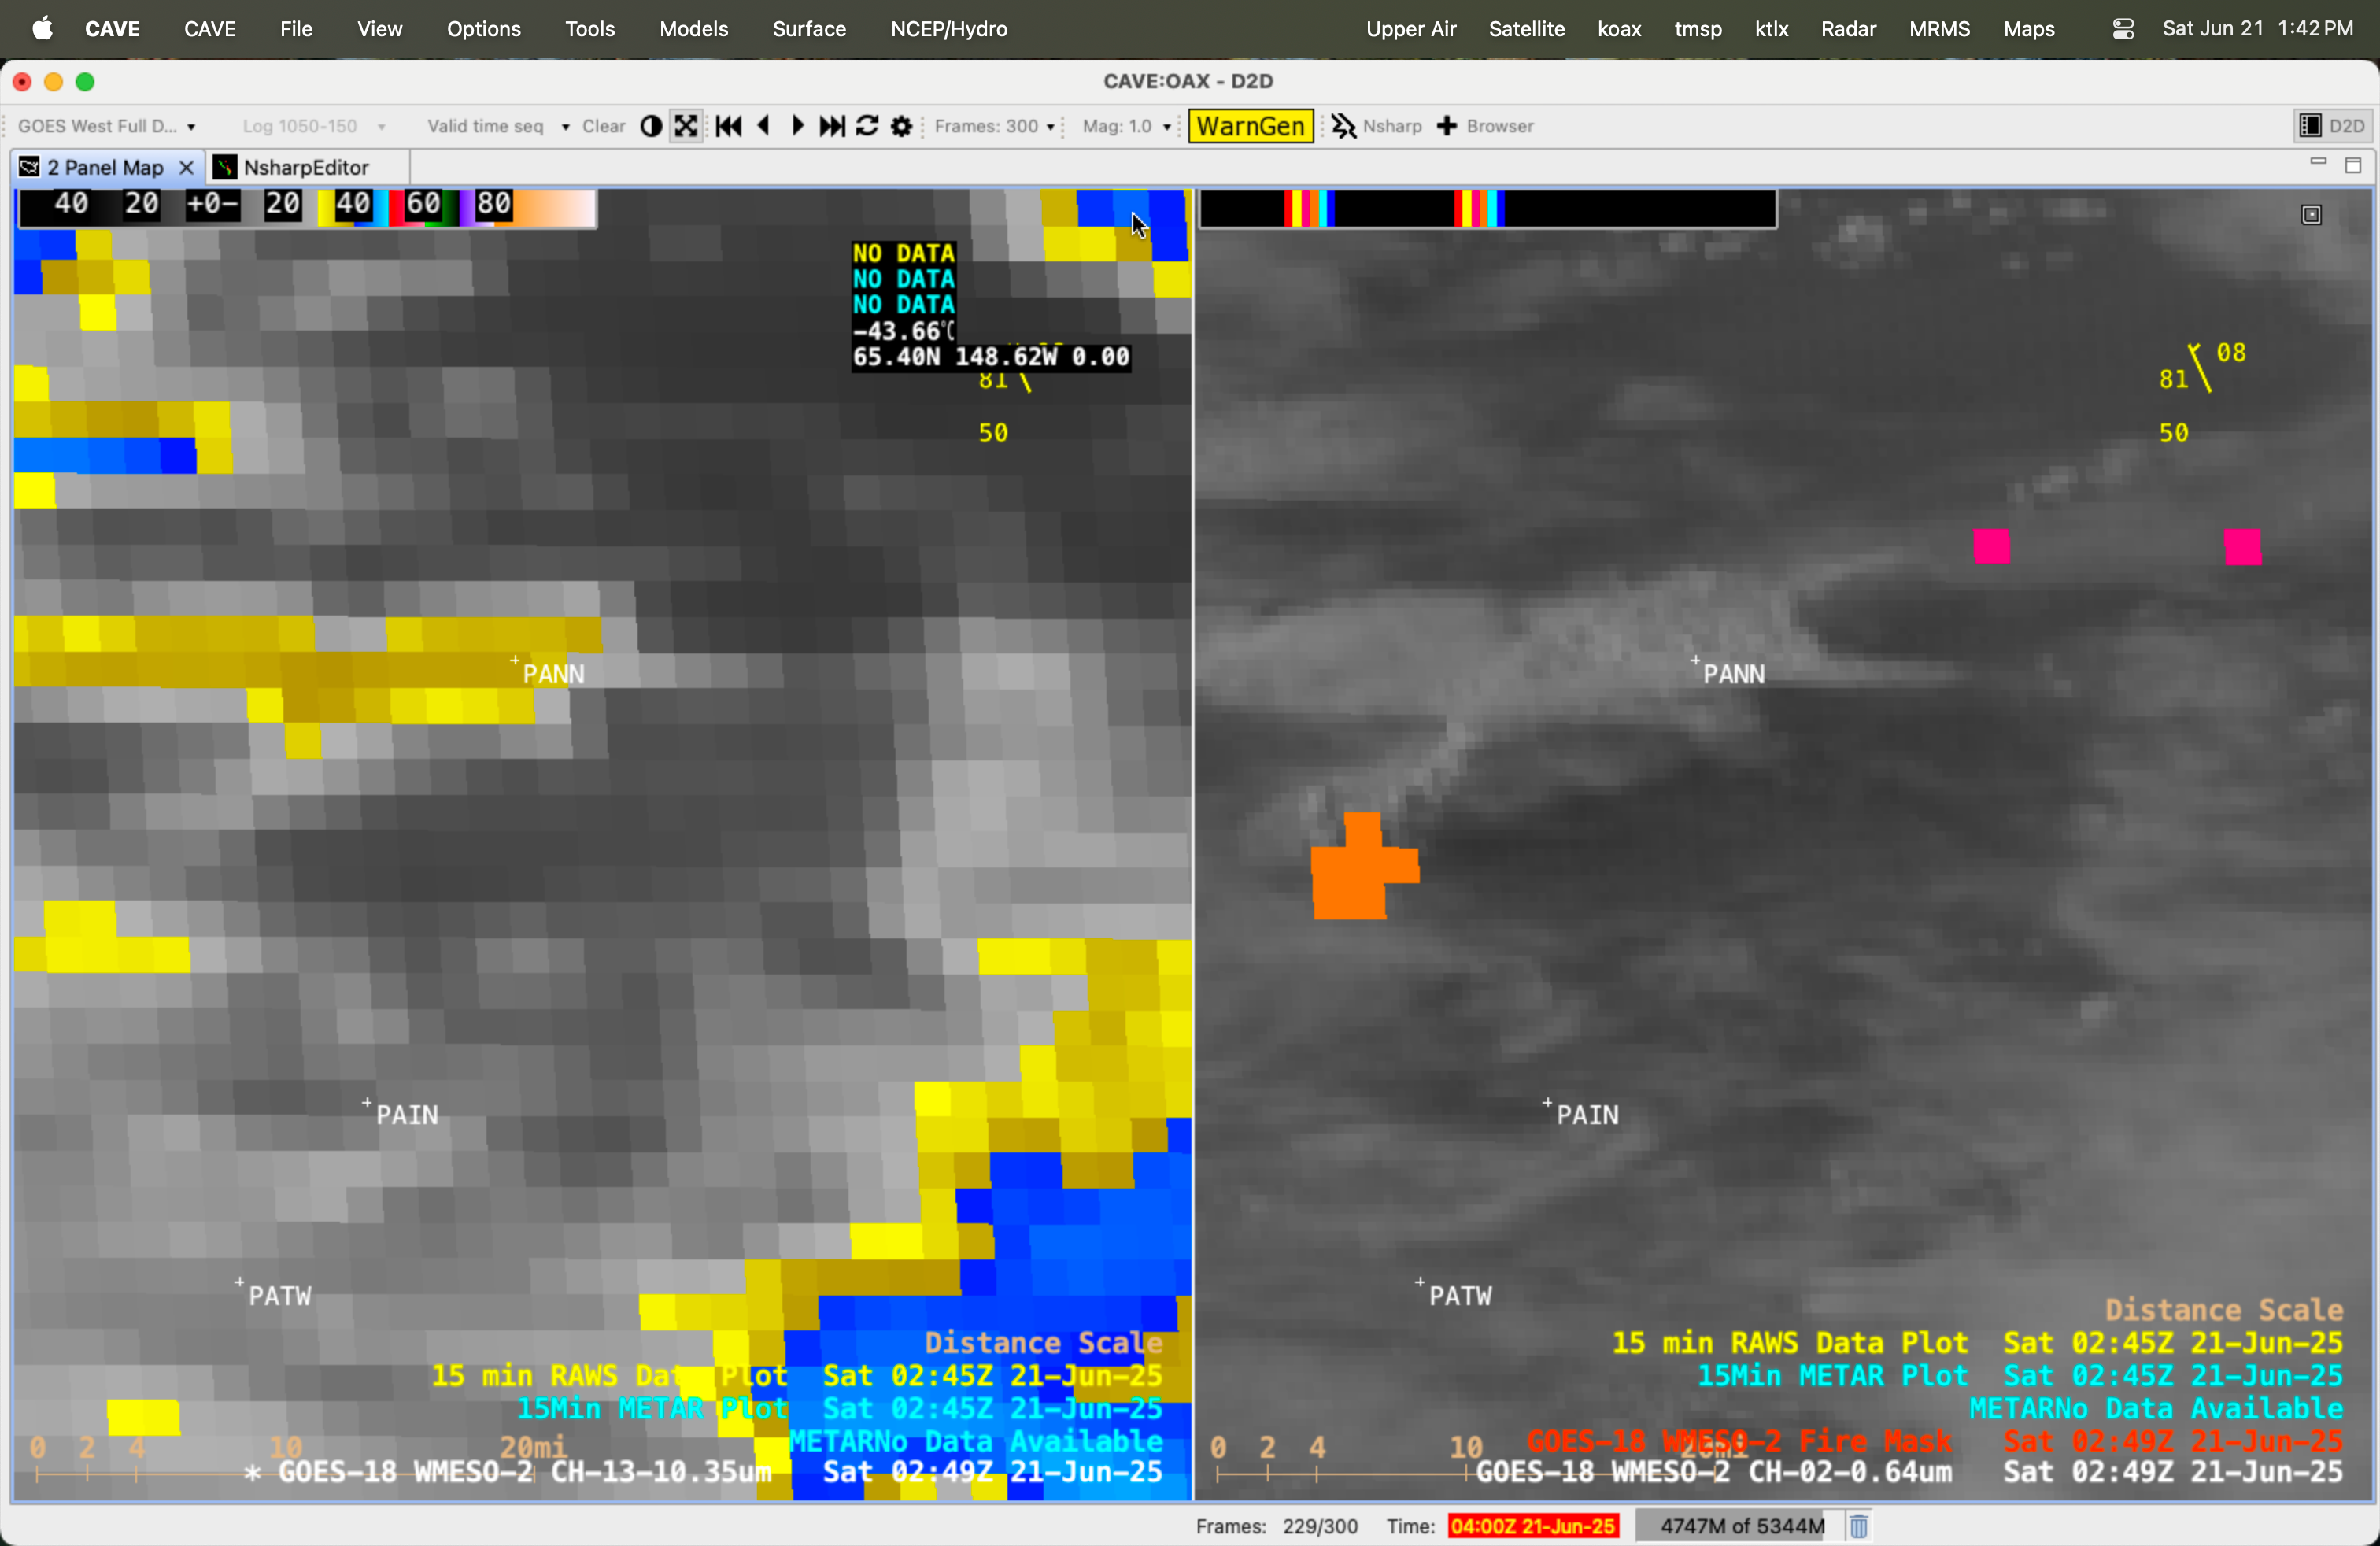
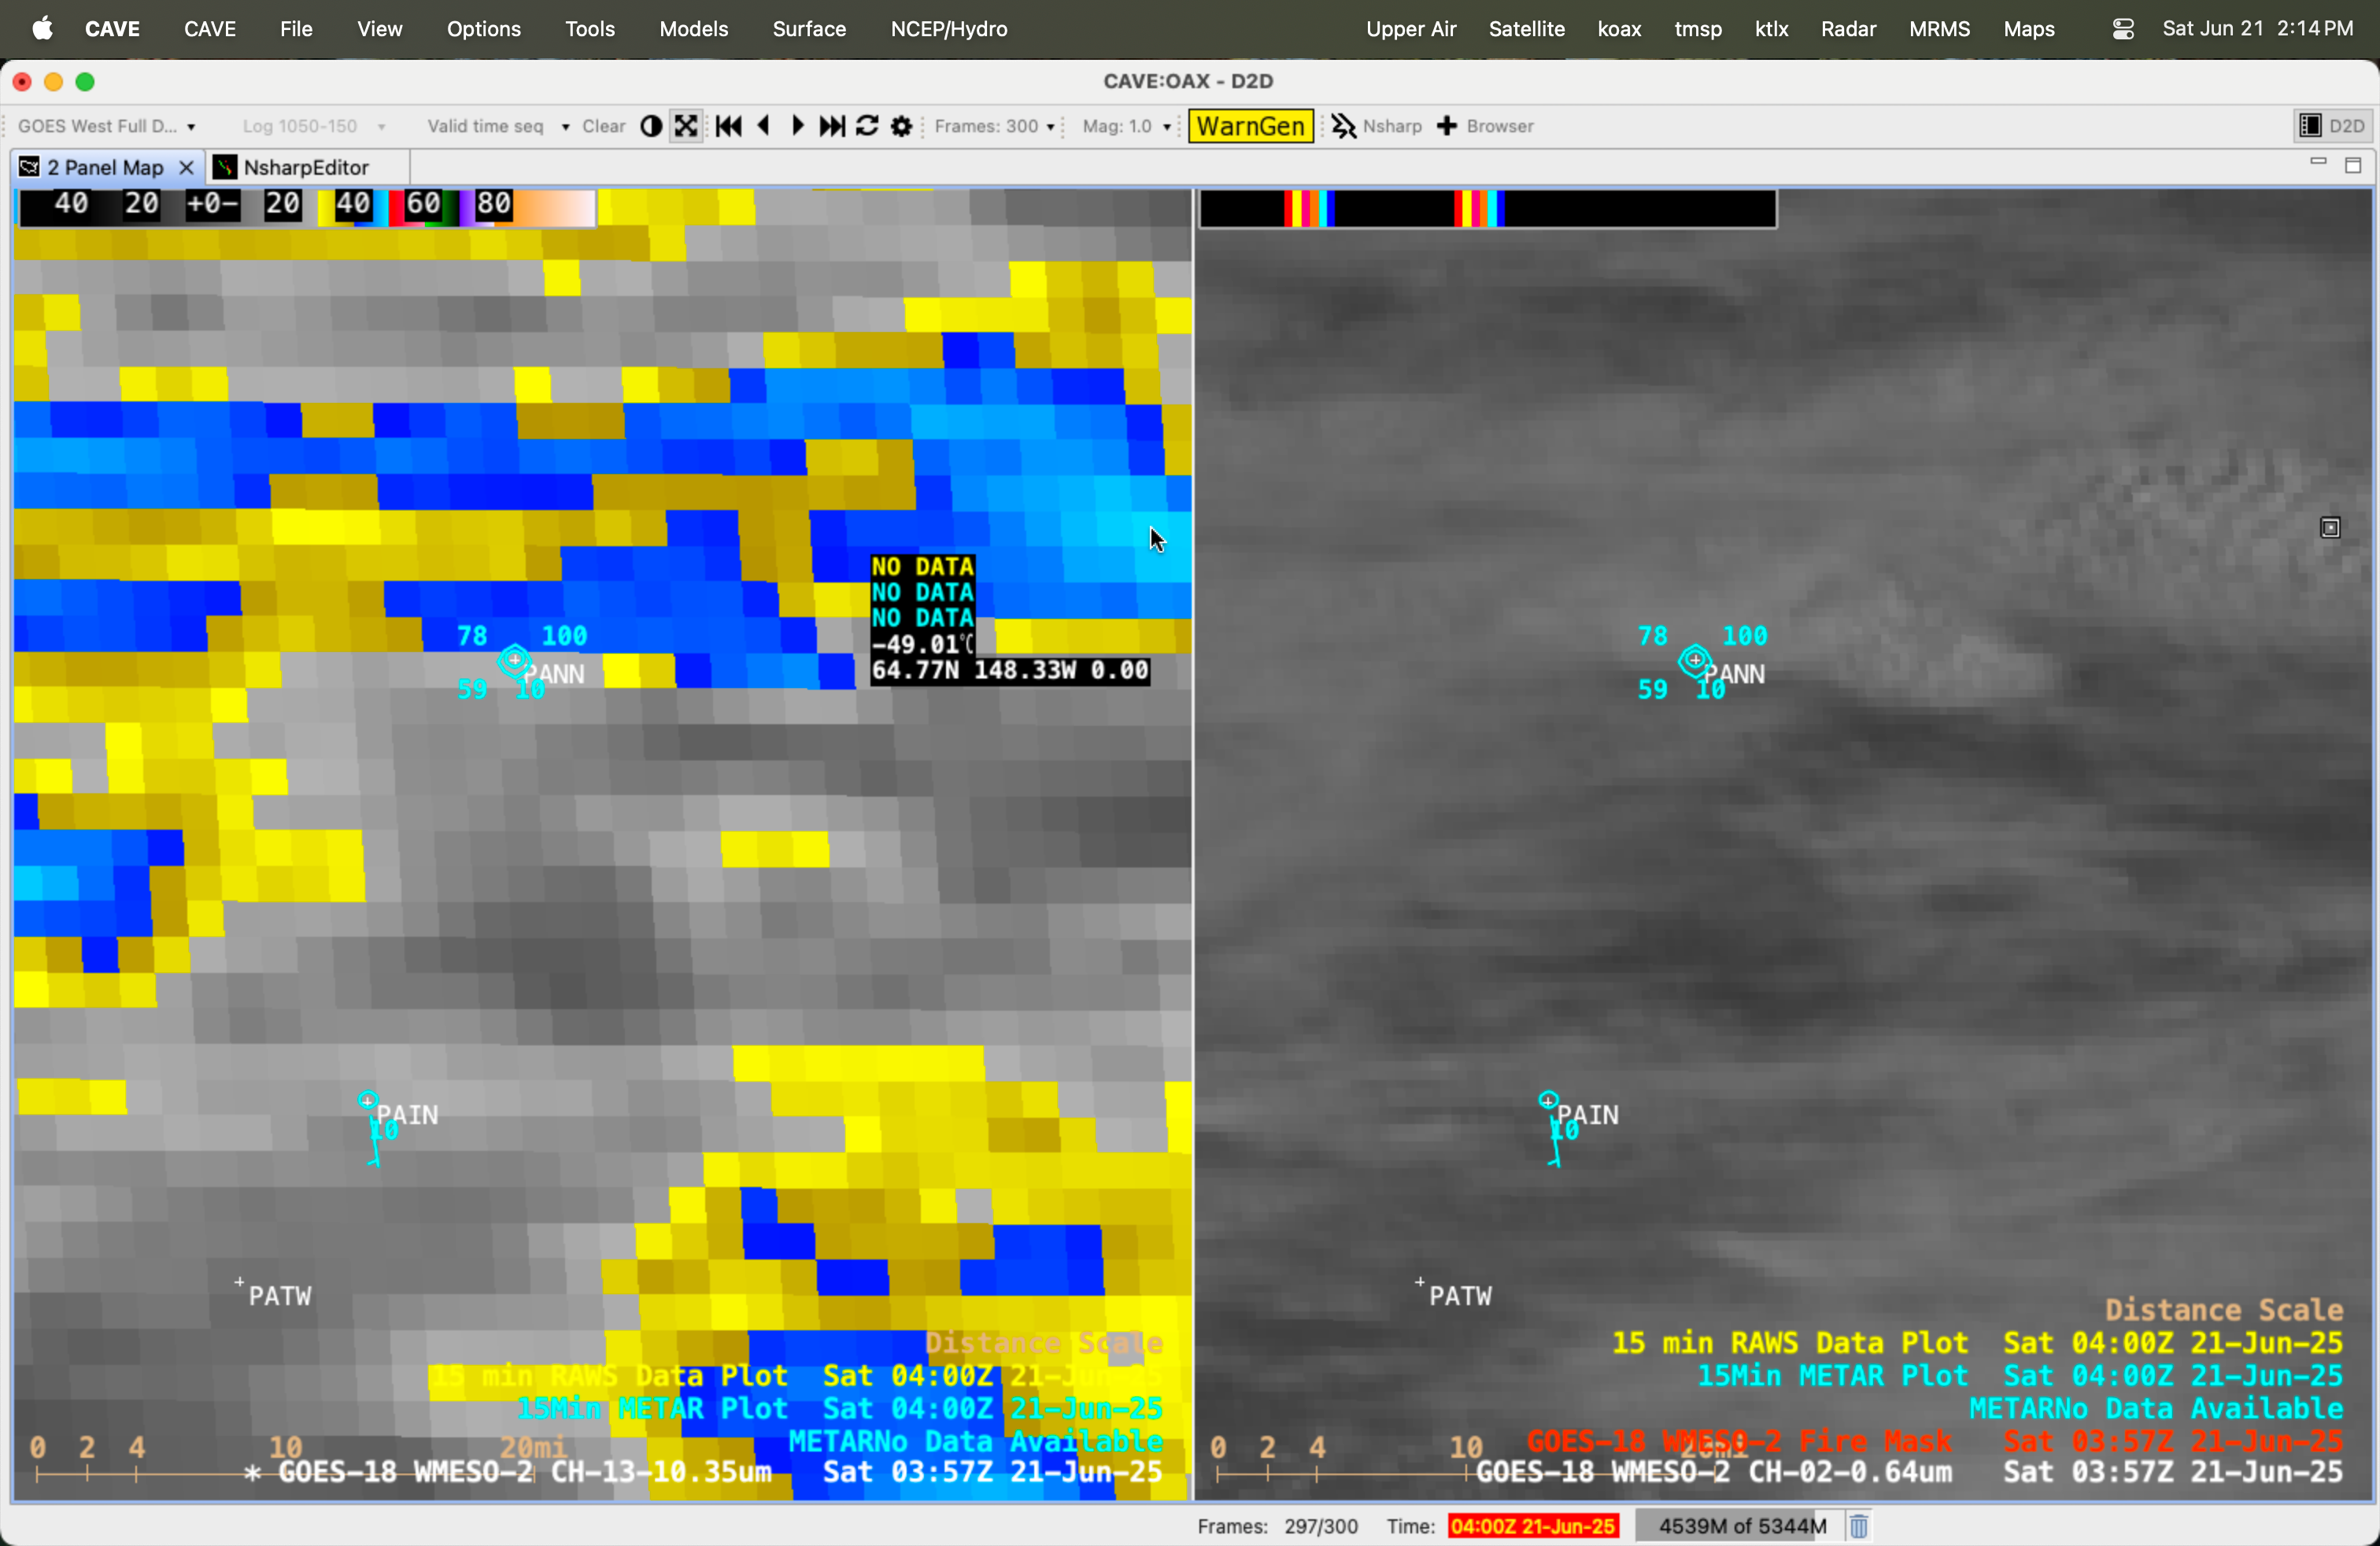
1-minute Mesoscale Domain Sector GOES-18 (GOES-West) “Clean” Infrared Window (10.3 µm) images and “Red” Visible (0.64 µm) images with an overlay of the FDCA Fire Mask derived product (above) showed that a wildfire southwest of Nenana, Alaska (METAR site PANN) produced two pyrocumulonimbus (pyroCb) clouds late in the day on... Read More
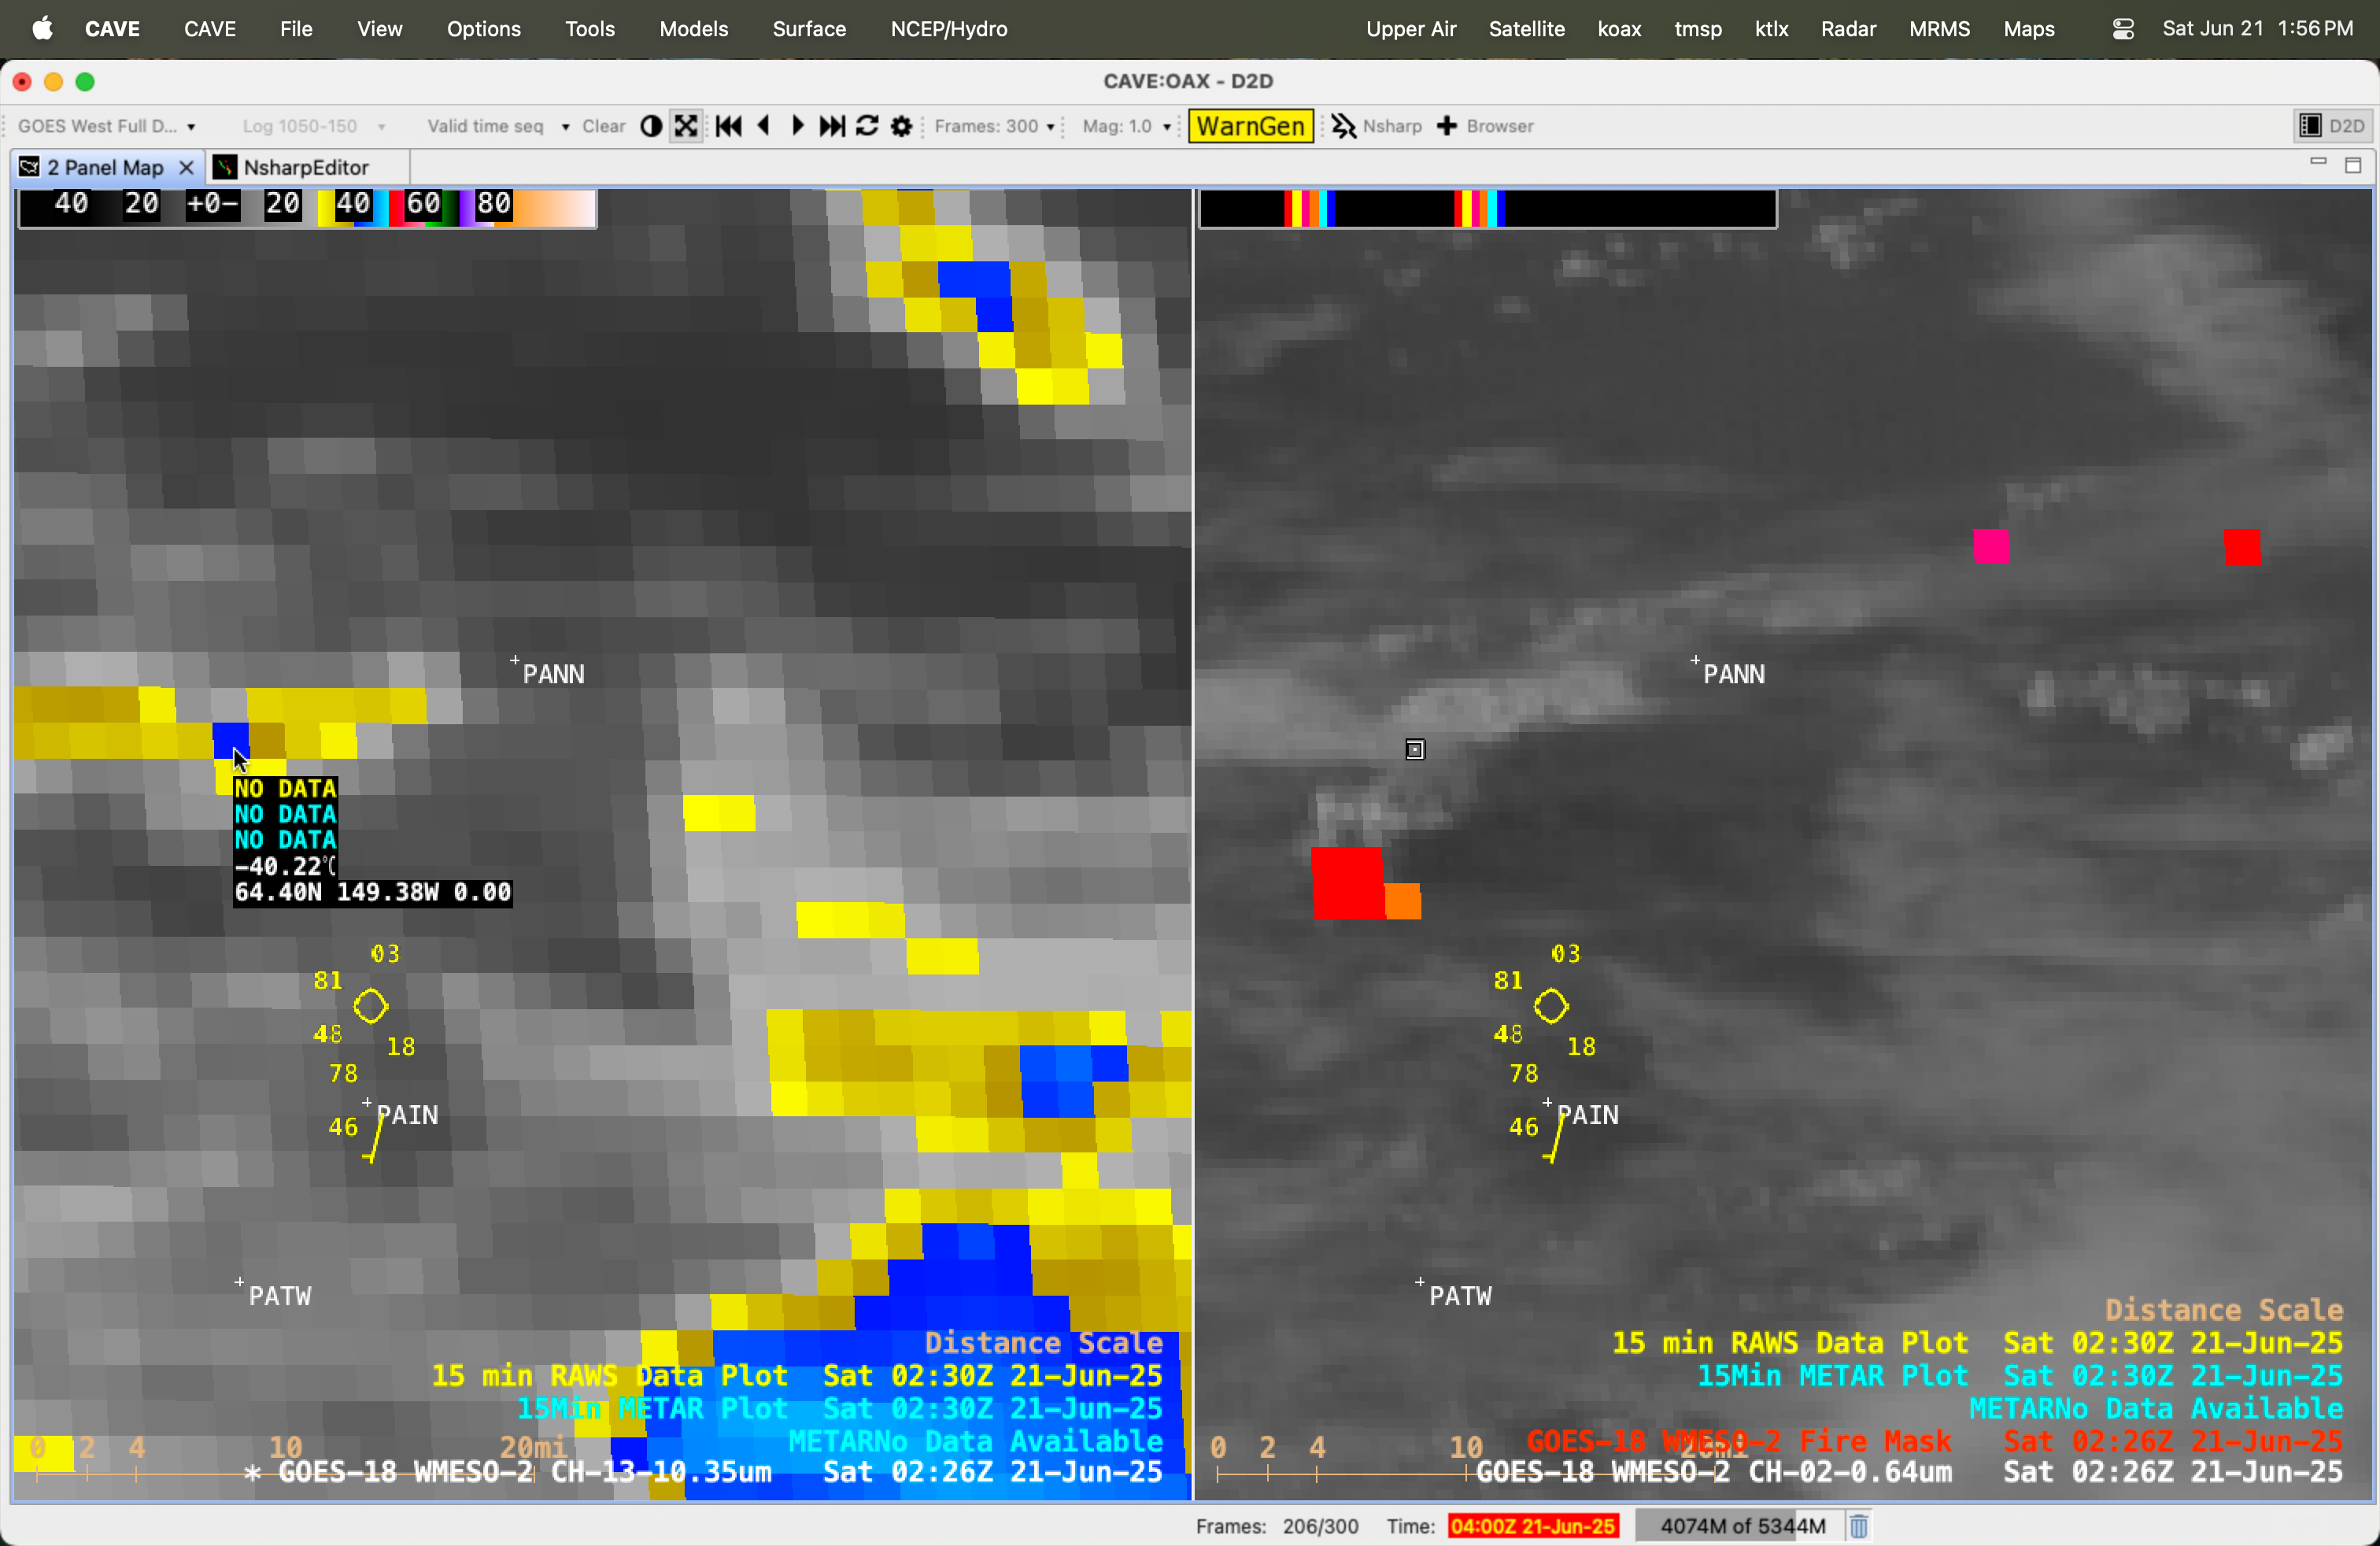
1-minute GOES-18 Clean Infrared Window (10.3 µm, left) images and Red Visible (0.64 µm) images with an overlay of the Fire Mask derived product (right), from 2301 UTC on 20 June to 0400 UTC on 21 June [click to play MP4 animation]
1-minute Mesoscale Domain Sector GOES-18 (GOES-West) “Clean” Infrared Window (10.3 µm) images and “Red” Visible (0.64 µm) images with an overlay of the FDCA Fire Mask derived product (above) showed that a wildfire southwest of Nenana, Alaska (METAR site PANN) produced two pyrocumulonimbus (pyroCb) clouds late in the day on 20 June 2025 . The pyroCb clouds exhibited cloud-top 10.3 µm infrared brightness temperatures (IRBTs) in the -40s C (denoted by shades of blue to cyan) — a necessary condition to be classified as a pyroCb — with the first pyroCb developing at 0027 UTC on 21 June, and the second pyroCb forming at 0226 UTC. These were the first confirmed pyroCbs in Alaska for the 2025 wildfire season.
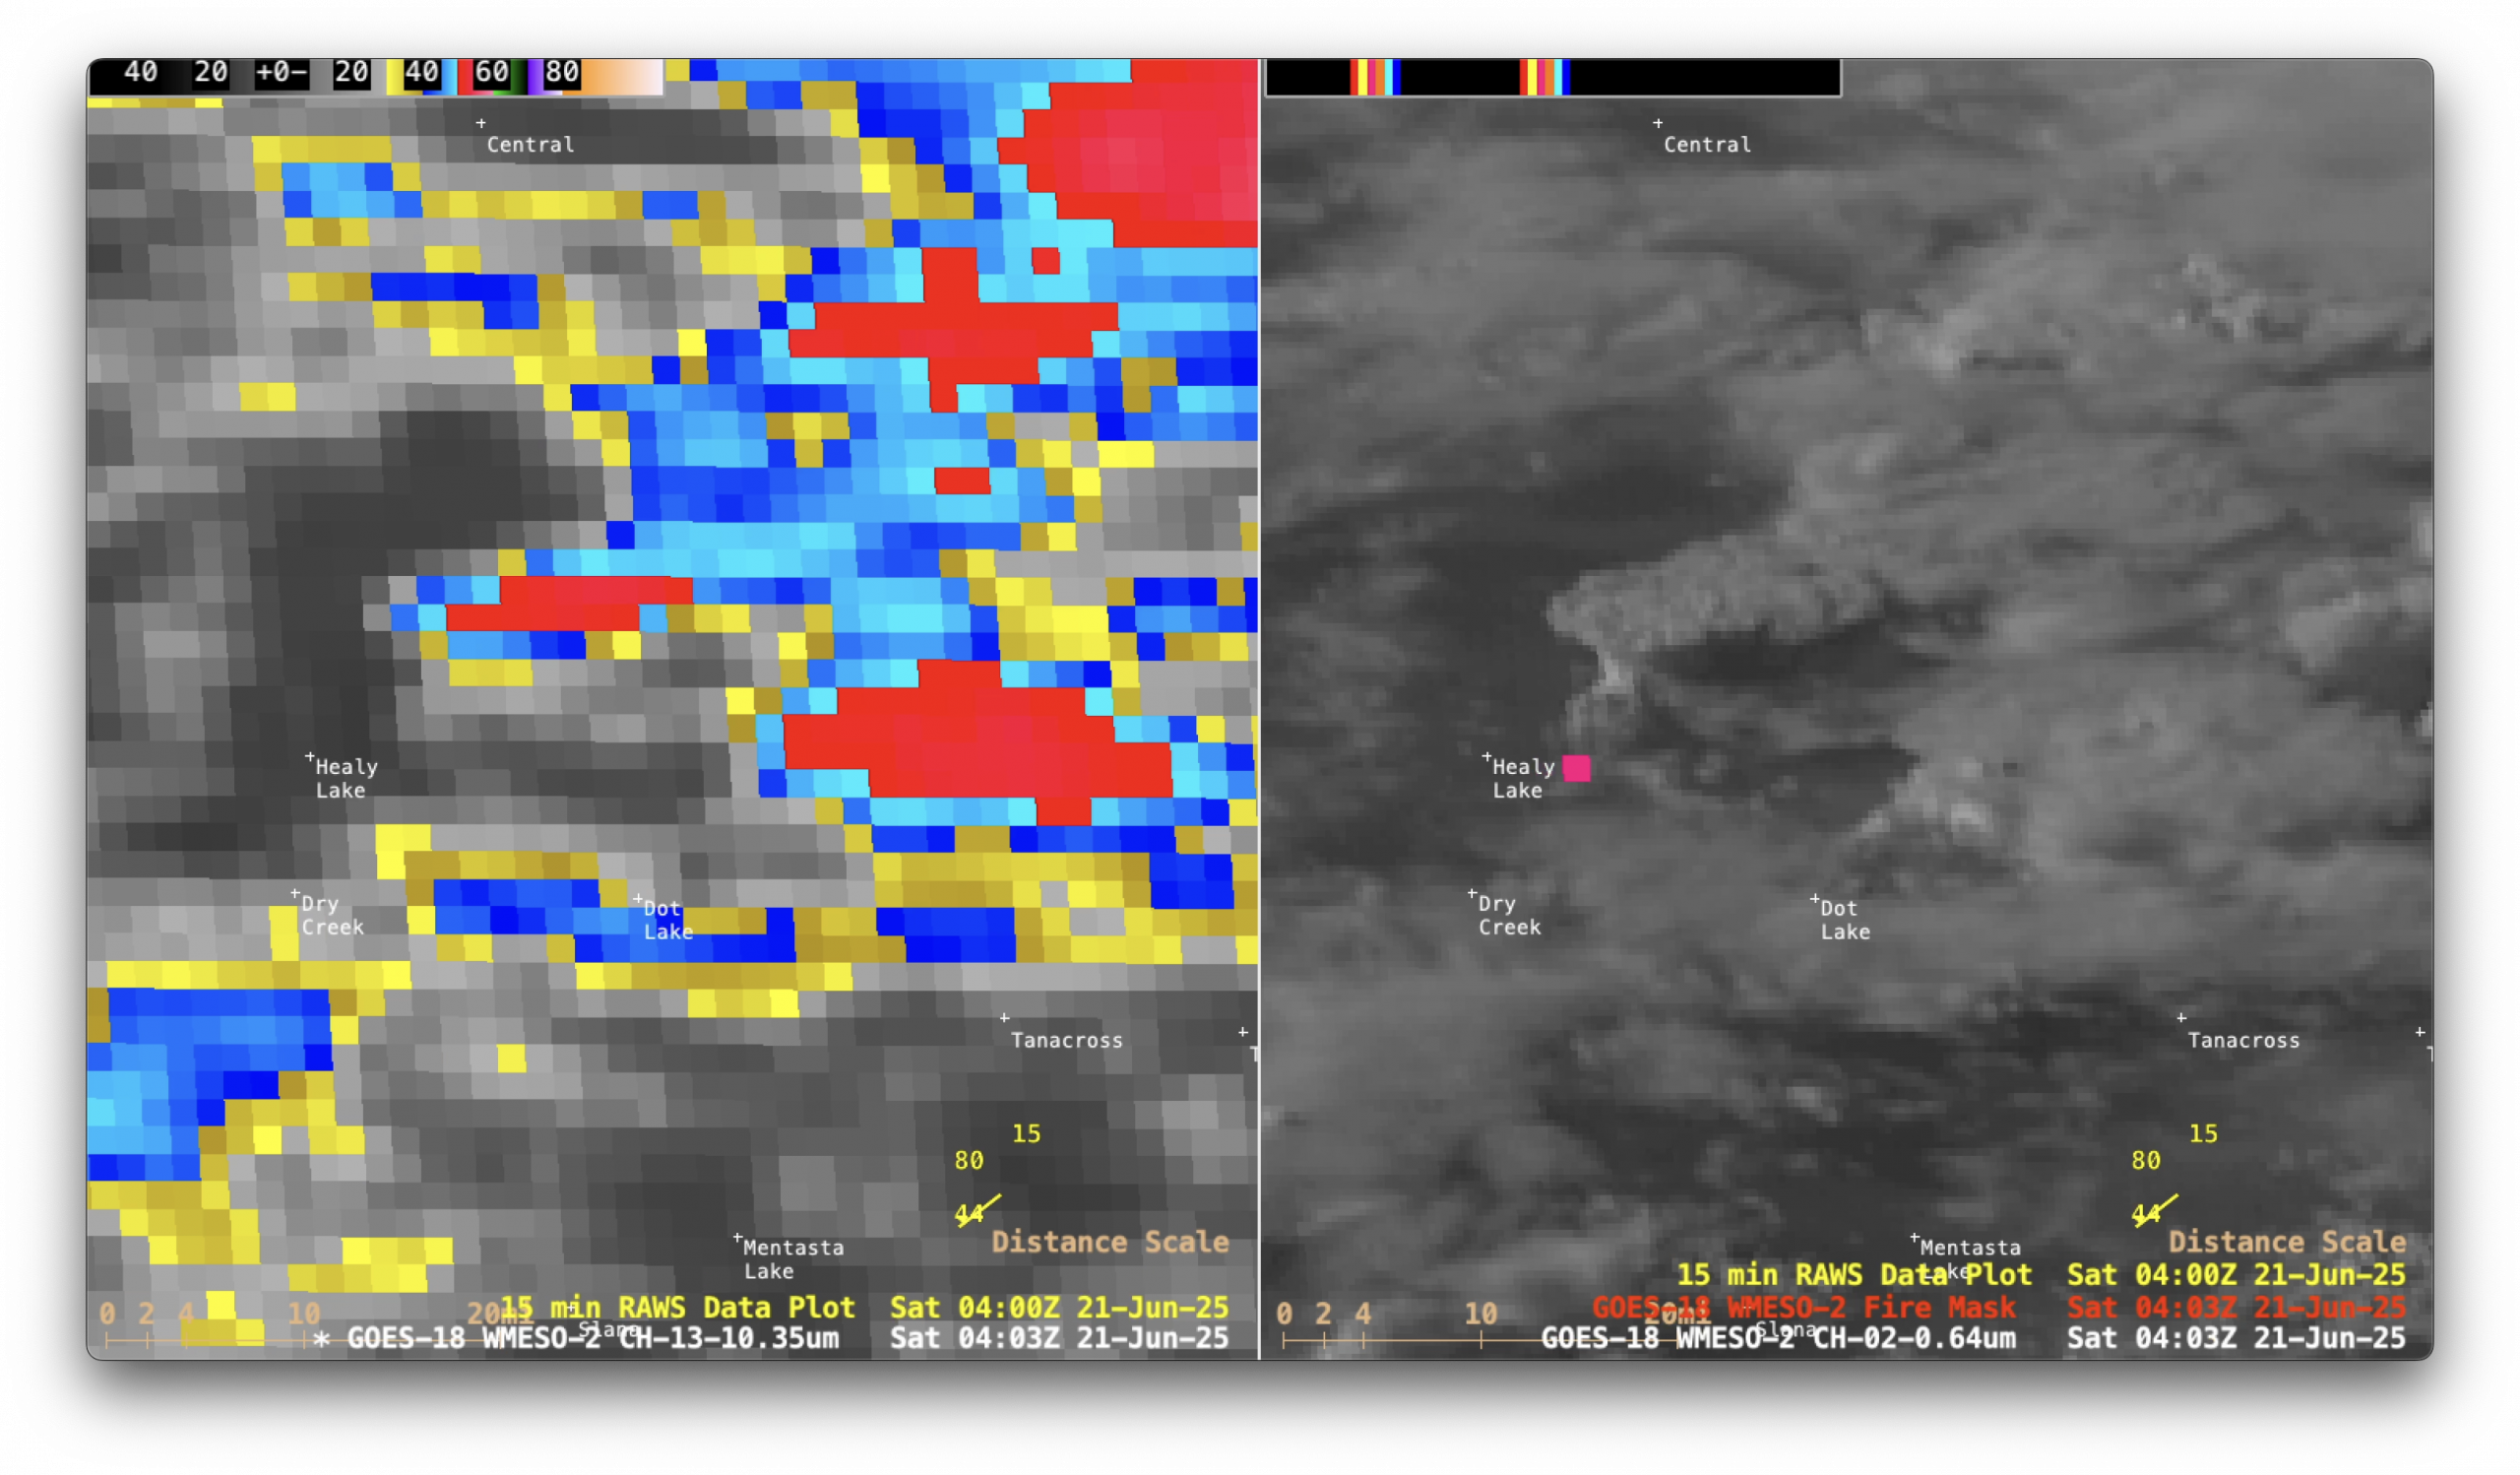
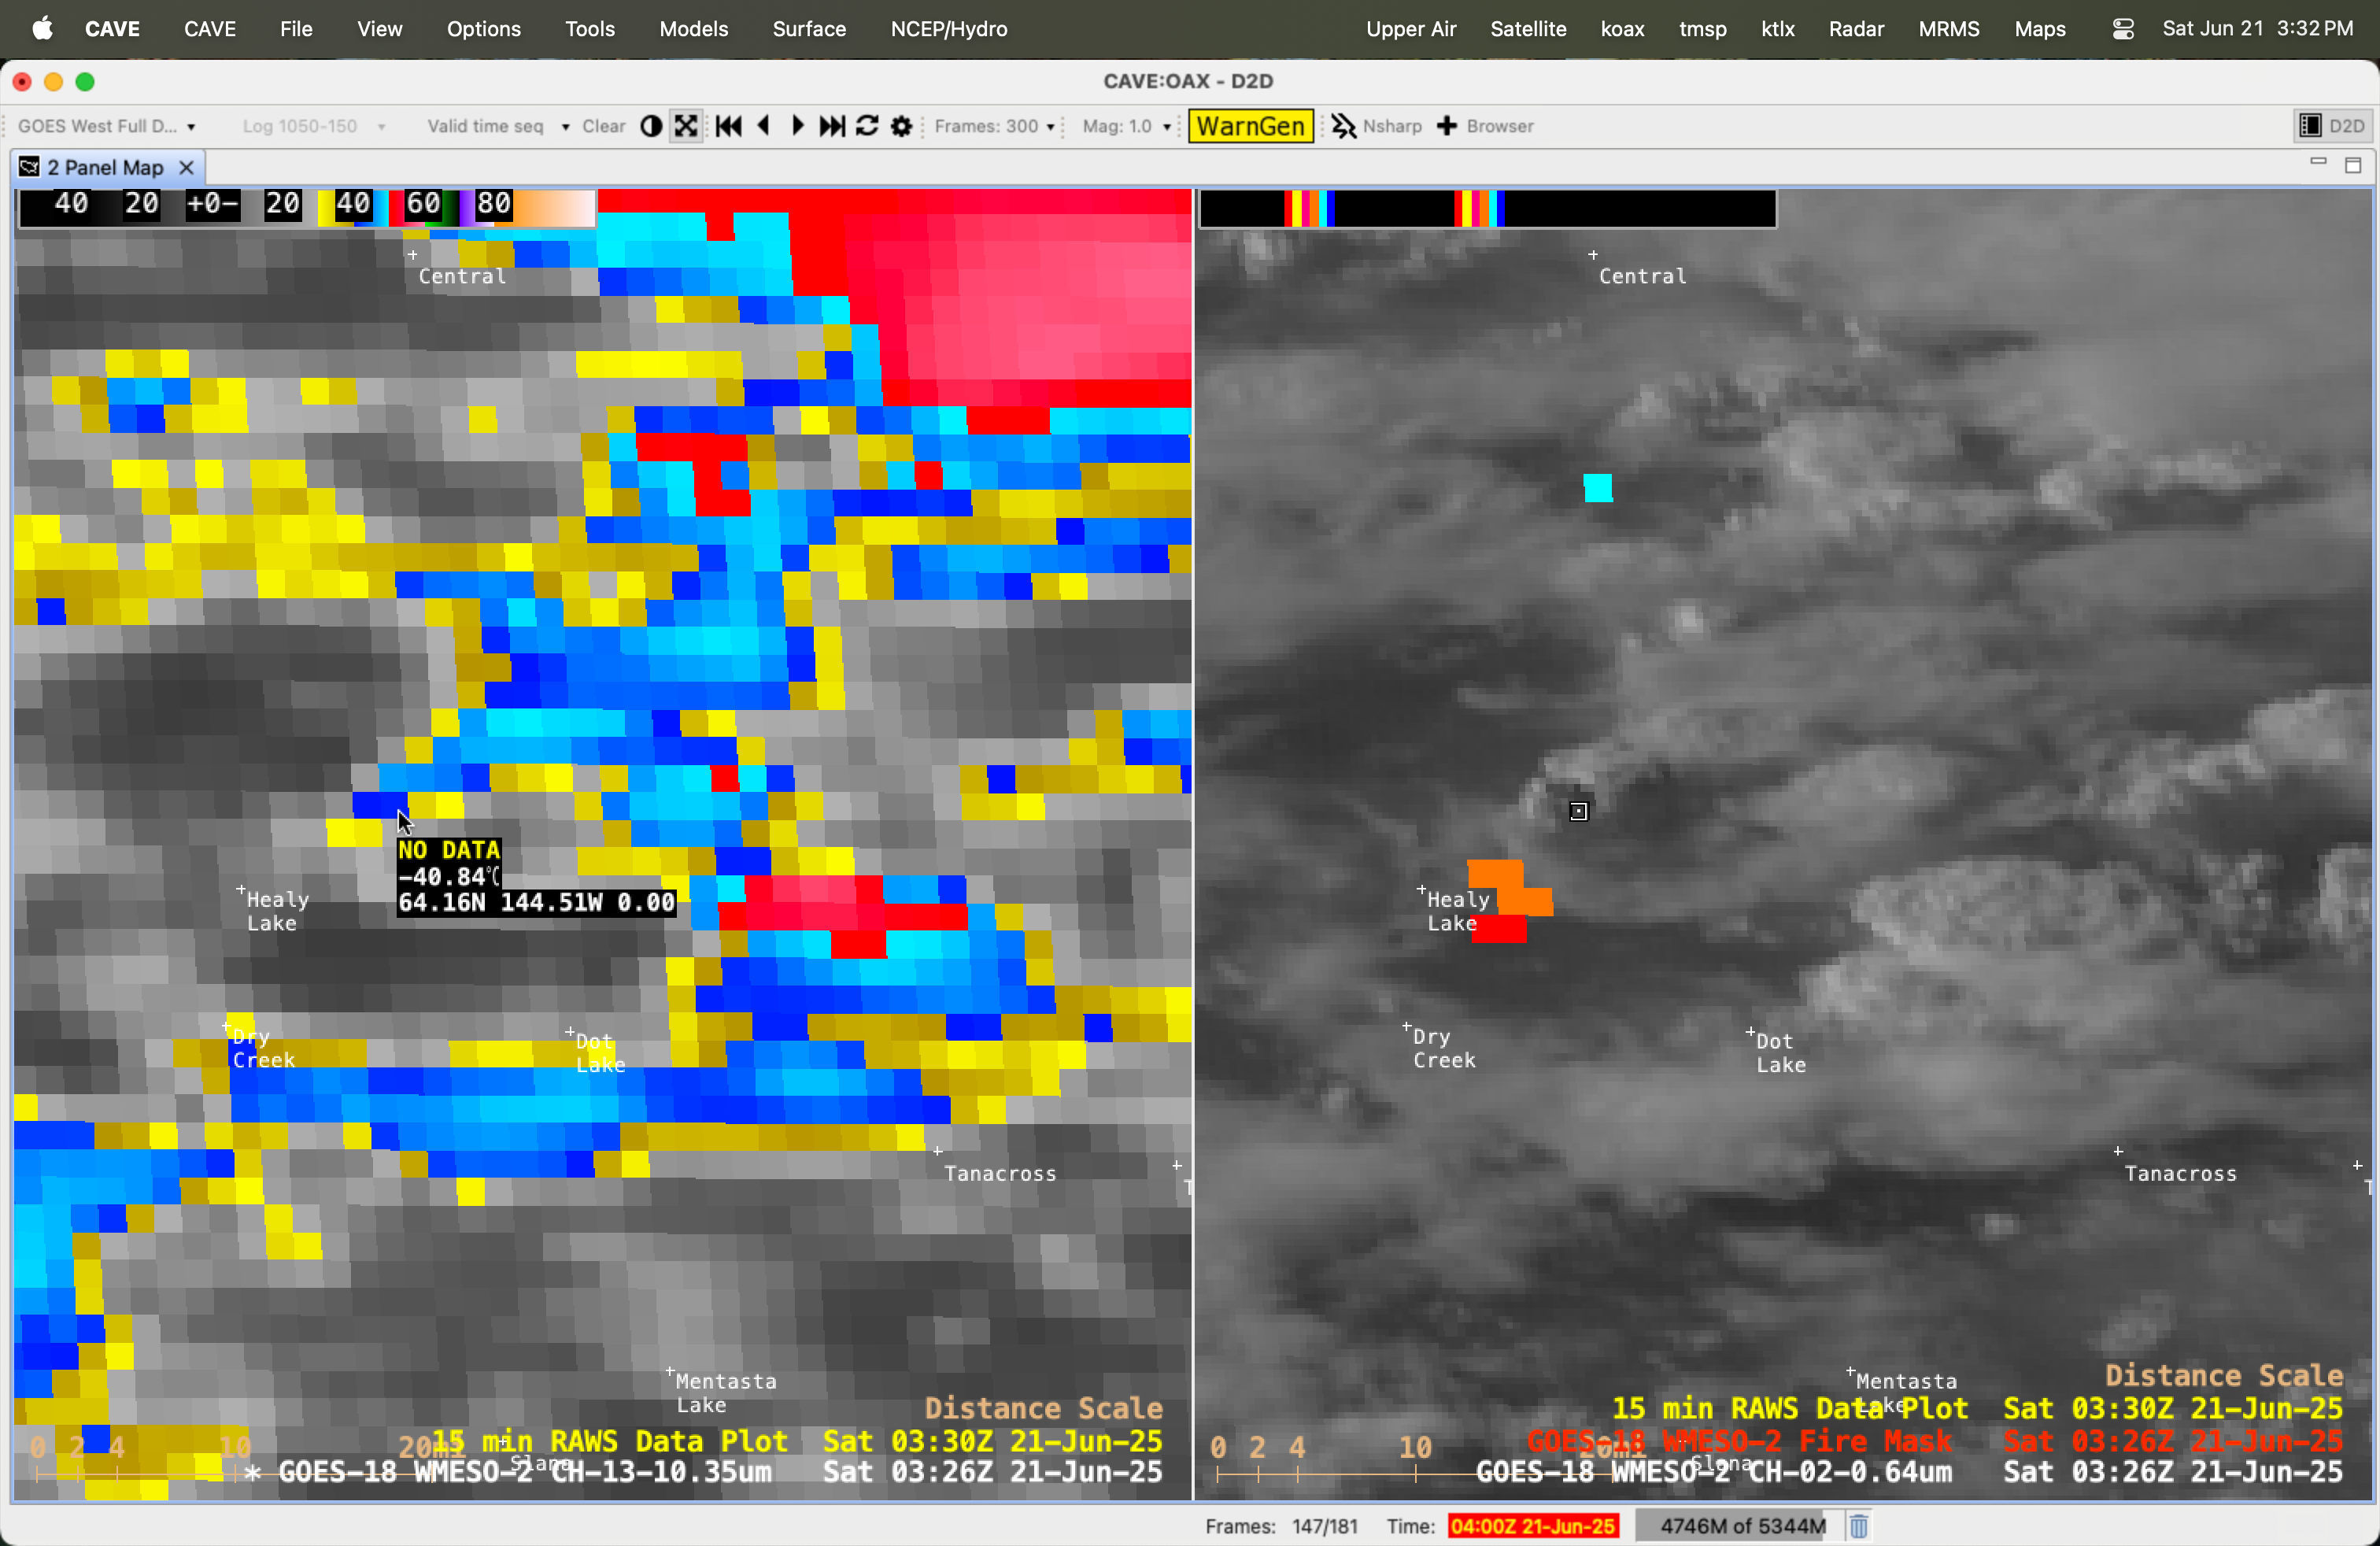
Another wildfire just east of Healy Lake, Alaska later produced a larger pyroCb, developing at 0326 UTC(below).
1-minute GOES-18 Clean Infrared Window (10.3 µm, left) images and Red Visible (0.64 µm) images with an overlay of the Fire Mask derived product (right), from 0100-0700 UTC on 21 June [click to play MP4 animation]
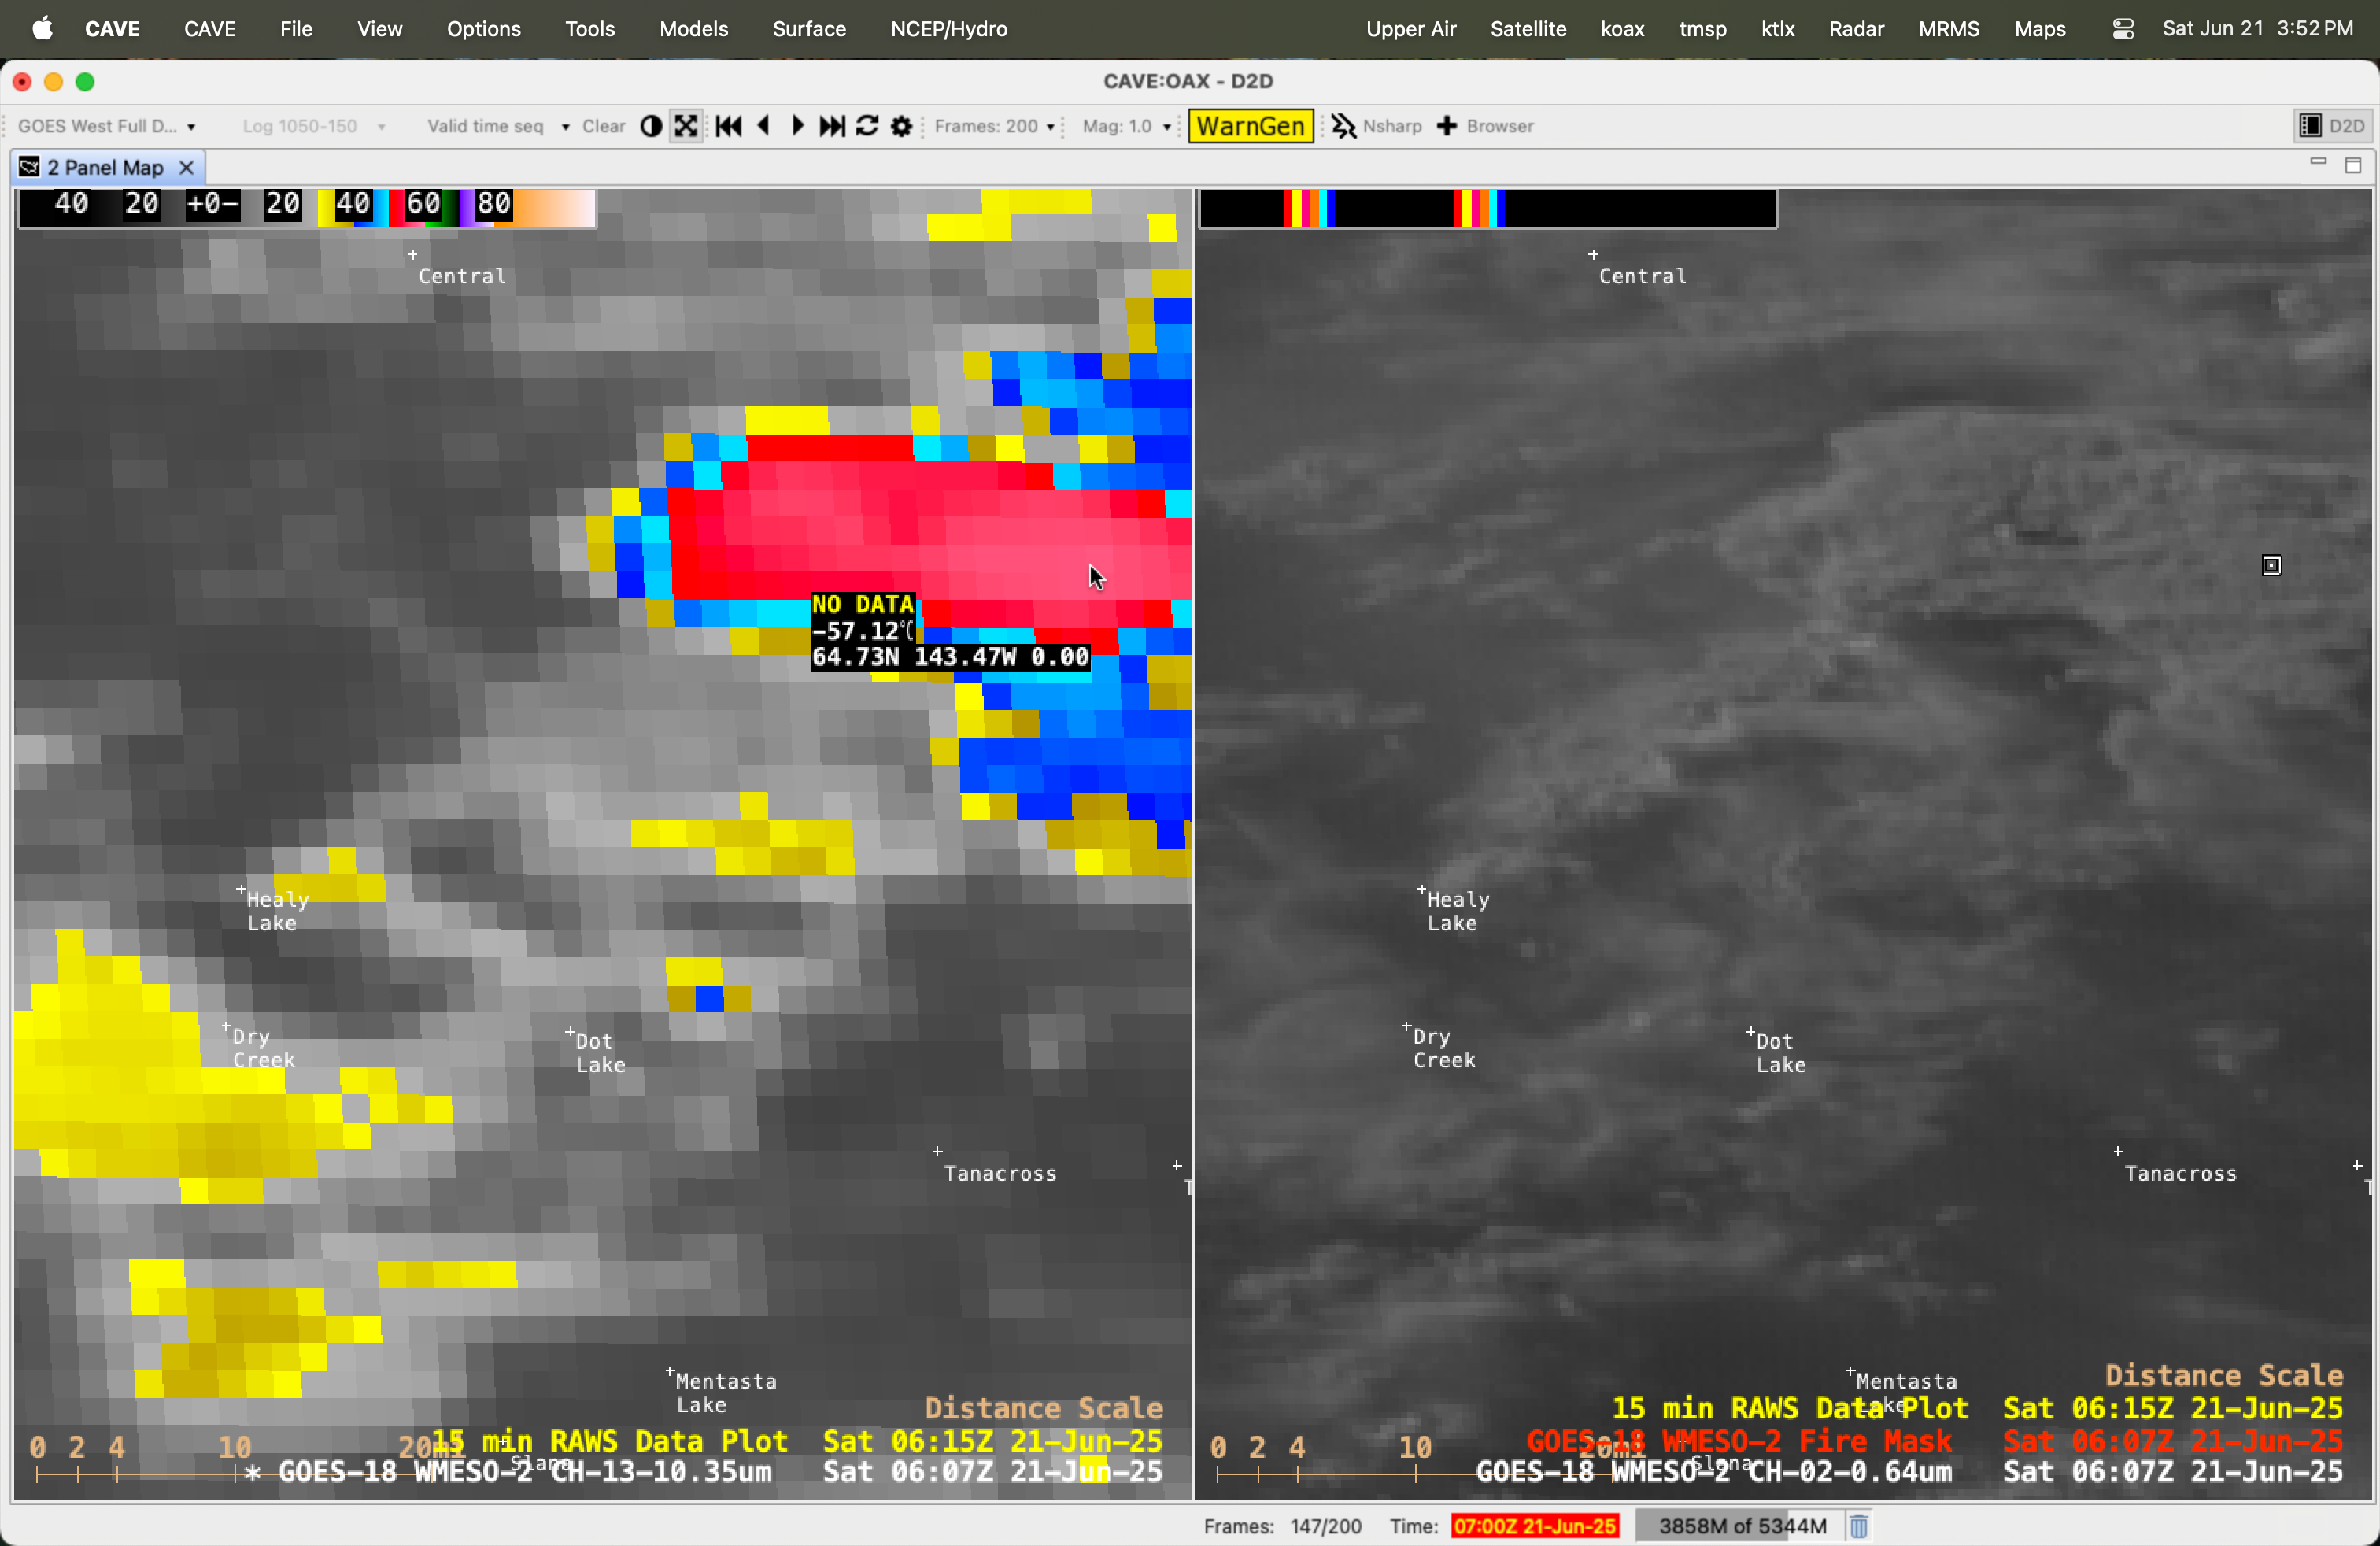
The coldest cloud-top IRBT exhibited by the Healy Lake pyroCb was -57.12 C at 0607 UTC (below) — colder than the -43.66 C and -49.01 C IRBTs for the two pyroCbs produced by the wildfire southwest of Nenana.
GOES-18 Clean Infrared Window (10.3 µm, left) image and Red Visible (0.64 µm) image + Fire Mask derived product (right) at 0607 UTC on 21 June, with a cursor sample of the coldest pyroCb cloud-top infrared brightness temperature [click to enlarge]
1-minute Mesoscale Domain Sector GOES-19 (GOES-East) Visible and Infrared images (above) showed Hurricane Erick as it intensified from a Category 2 storm at 1800 UTC on 18 June to a Category 3 storm by 0000 UTC on 19 June 2025. The eye became a bit more defined during that time period... Read More
1-minute GOES-19 Visible (0.64 µm) and Infrared (10.3 µm) images, from 1800 UTC on 18 June to 0053 UTC on 19 June [click to play animated GIF]
1-minute Mesoscale Domain Sector GOES-19 (GOES-East) Visible and Infrared images (above) showed Hurricane Erick as it intensified from a Category 2 storm at 1800 UTC on 18 June to a Category 3 storm by 0000 UTC on 19 June 2025. The eye became a bit more defined during that time period — and convective bursts within the eyewall occasionally exhibited cloud-top infrared brightness temperatures of -80ºC or colder (violet pixels embedded within brighter white regions).
Erick was moving through an environment characterized by low values of deep-layer wind shear(below) — a factor that favored further intensification.
GOES-19 Infrared images, with an overlay of deep-layer wind shear at 0000 UTC on 19 June
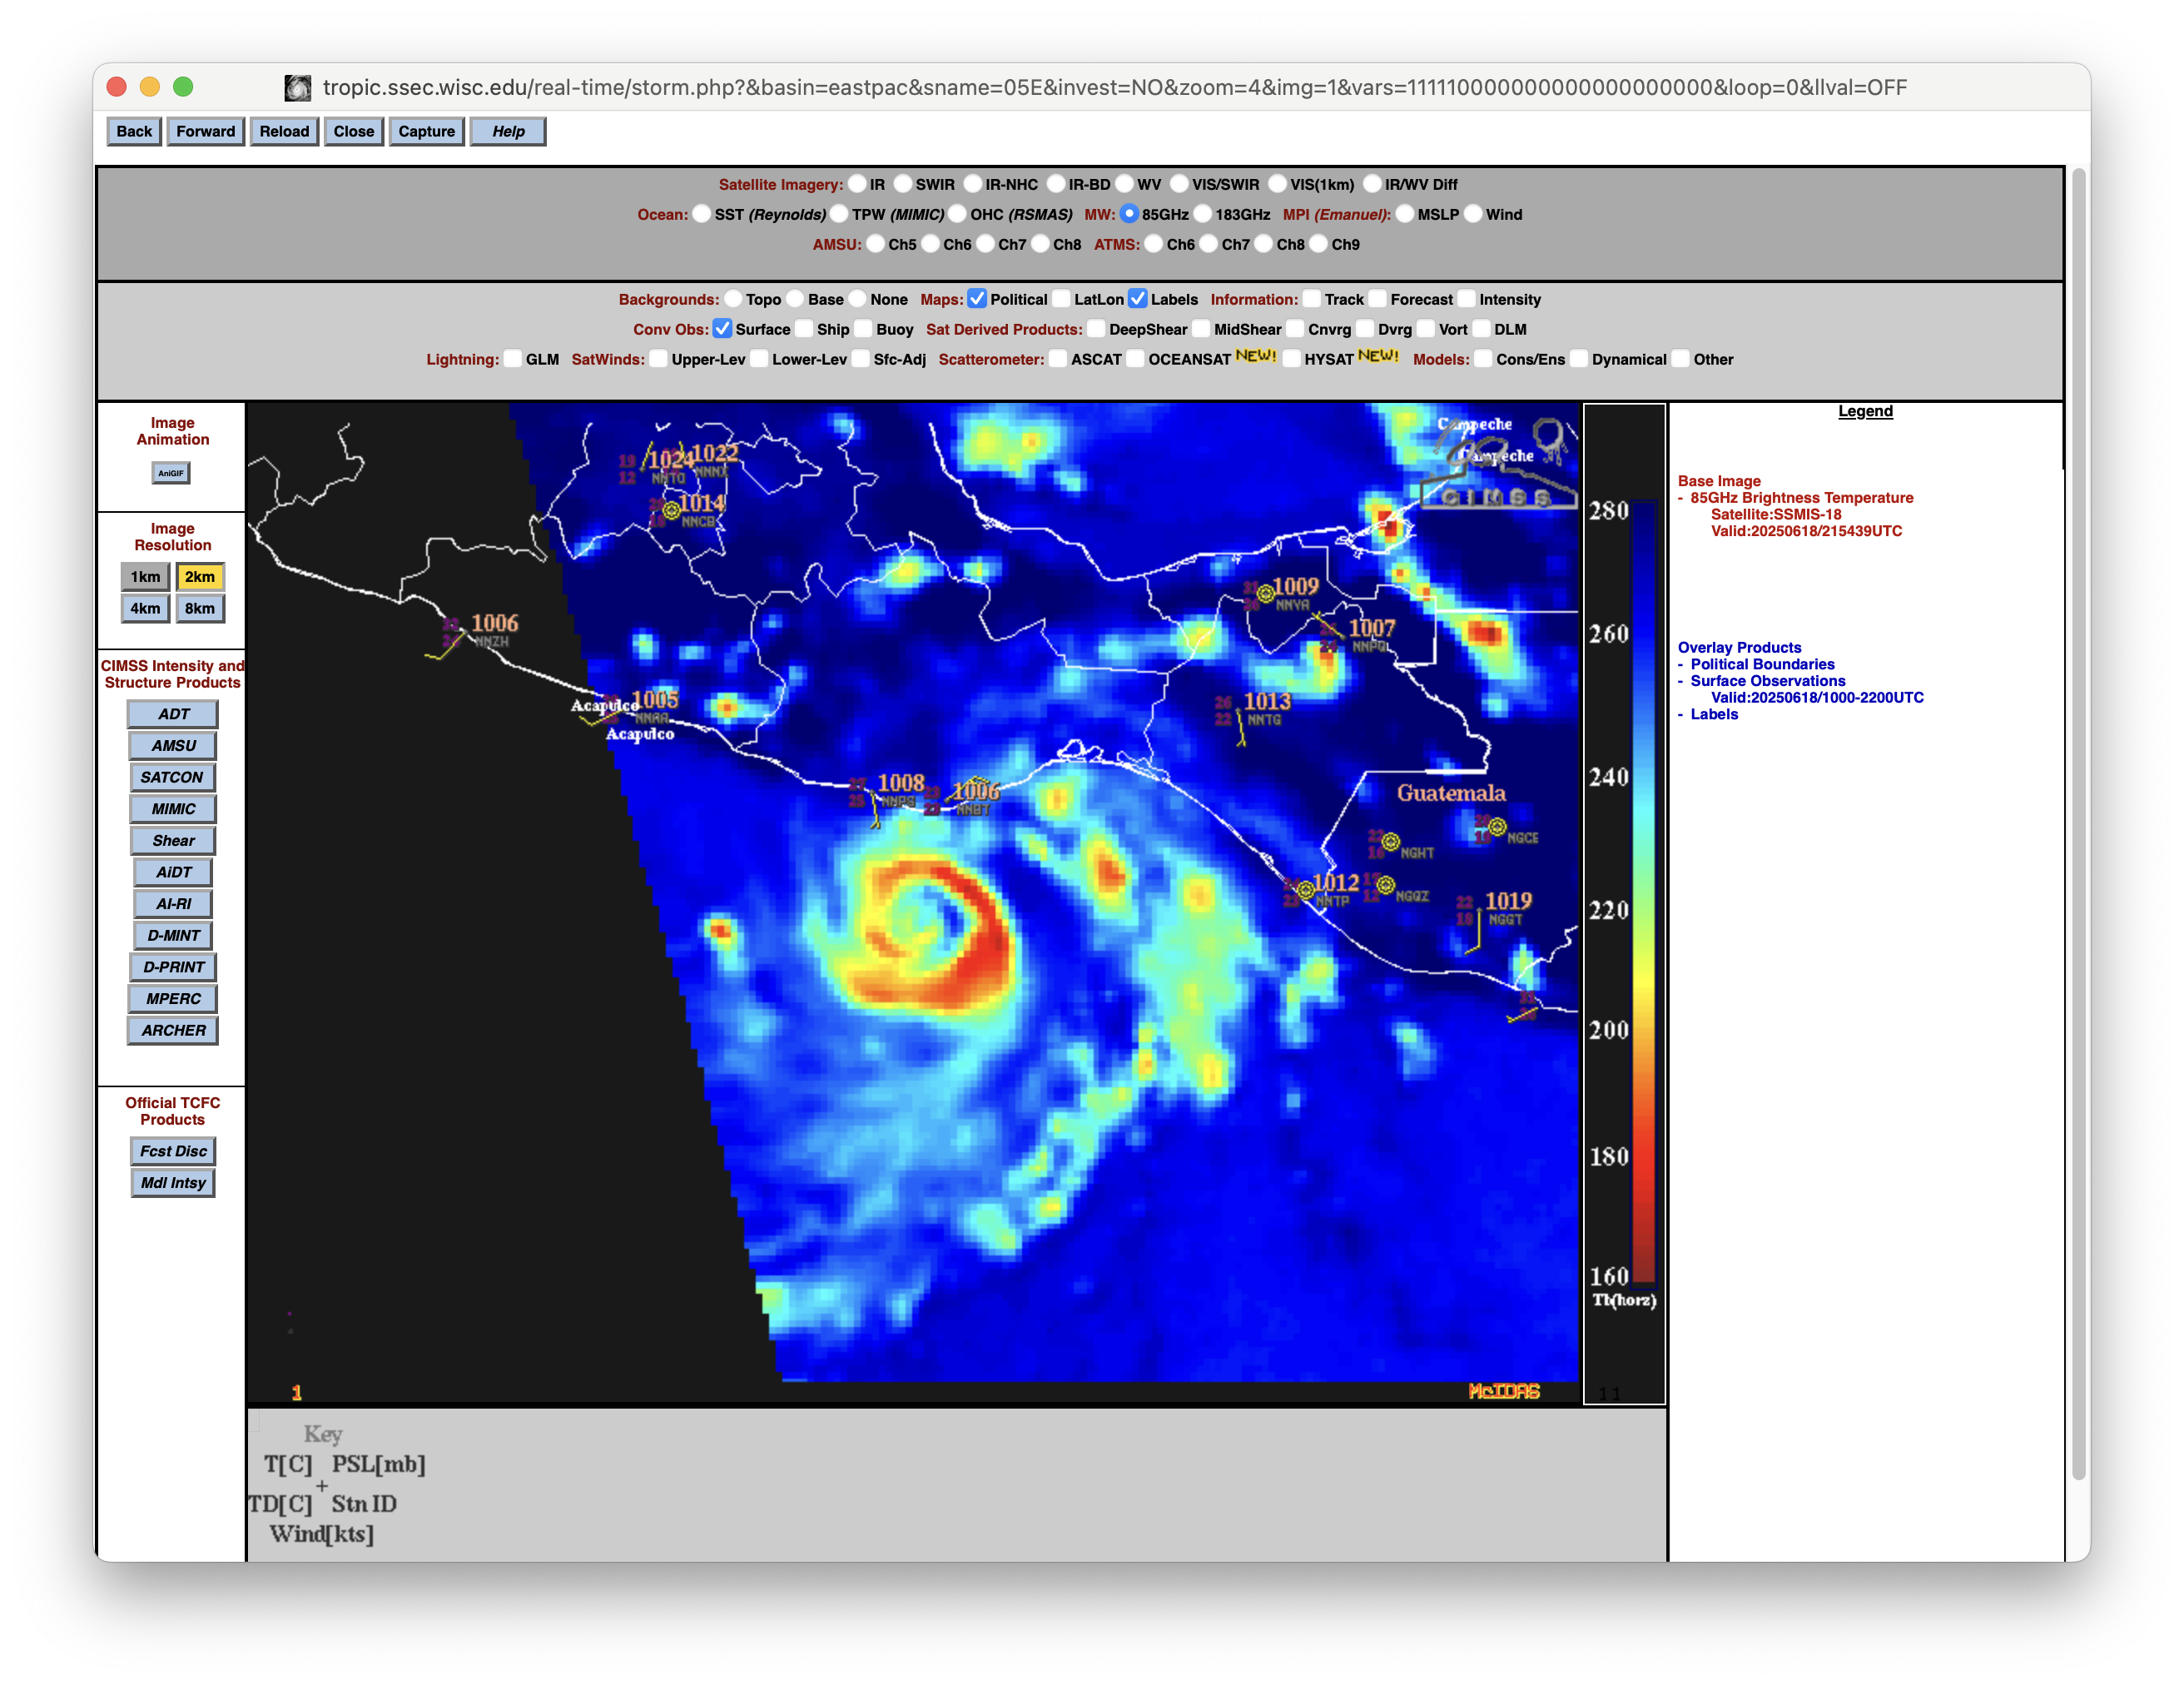
A DMSP-18 Microwave image at 2154 UTC on 18 June (below) displayed a large outer eyewall (and hints of a partial inner eyewall), suggesting that an eyewall replacement cycle might soon occur.
DMSP-18 SSMI/S Microwave (85 GHz) image at 2154 UTC on 18 June [click to enlarge]
1-minute GOES-19 Infrared images (below) showed the period where Erick continued its rapid intensification, becoming a Category 4 storm just before 0600 UTC on 19 June. The hurricane weakened somewhat to Category 3 intensity shortly before making landfall in far western Oaxaca, Mexico around 1200 UTC on 19 June (and the eye became ill-defined closer to the time of landfall). Convective bursts west of the eyewall occasionally reached -90ºC (yellow pixels embedded within darker purple areas).
1-minute GOES-19 Infrared (10.3 µm) images, from 2100 UTC on 18 June to 1301 UTC on 19 June [click to play animated GIF]
Deep-layer wind shear remained very low in the vicinity of Erick (below), maintaining a favorable environment for intensification — and the hurricane also traversed very warm Sea Surface Temperatures during its period of rapid intensification.
GOES-19 Infrared images, with an overlay of deep-layer wind shear at 0900 UTC on 19 June
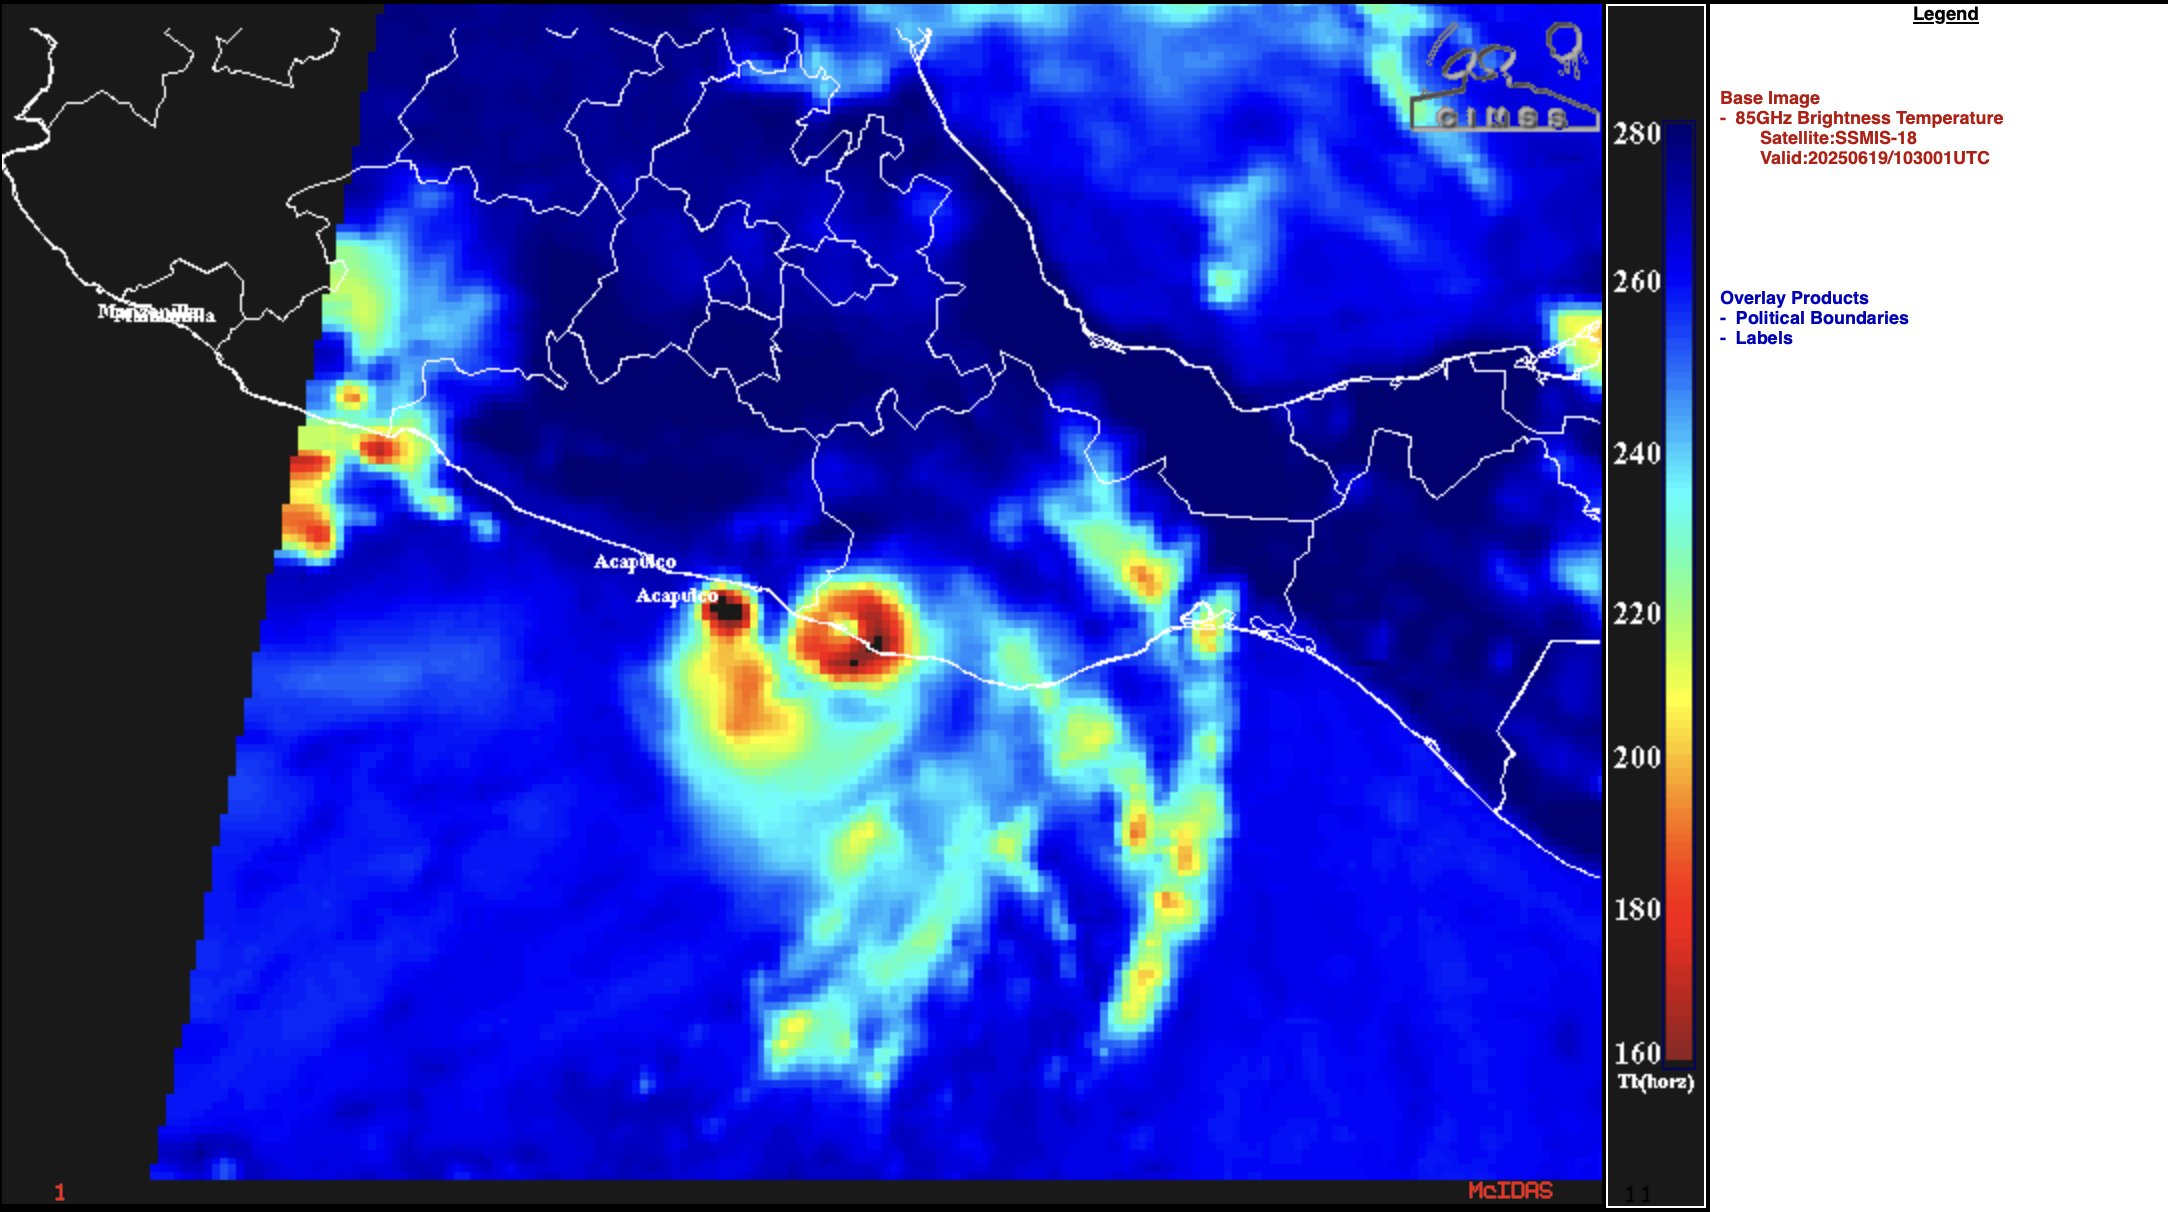
A DMSP-18 Microwave image at 1030 UTC on 19 June (below) suggested that landfall might have occurred a bit earlier than 1200 UTC.
DMSP-18 SSMI/S Microwave (85 GHz) image at 1030 UTC on 19 June [click to enlarge]
Deep-later wind shear, DMSP and Sea Surface Temperature images were sourced from the CIMSS Tropical Cyclones site.
The mp4 animation below (created using geo2grid from CSPP Geo) shows a broader-scale view of Erick during its intensification prior to landfall. Very cold cloud tops initially surround the strengthening center. Subsequently, an extensive region of even colder cloud tops develops well southwest of the storm center.
GOES-East Mesoscale Sector Two imagery, 0000 – 1400 UTC on 19 June 2025


