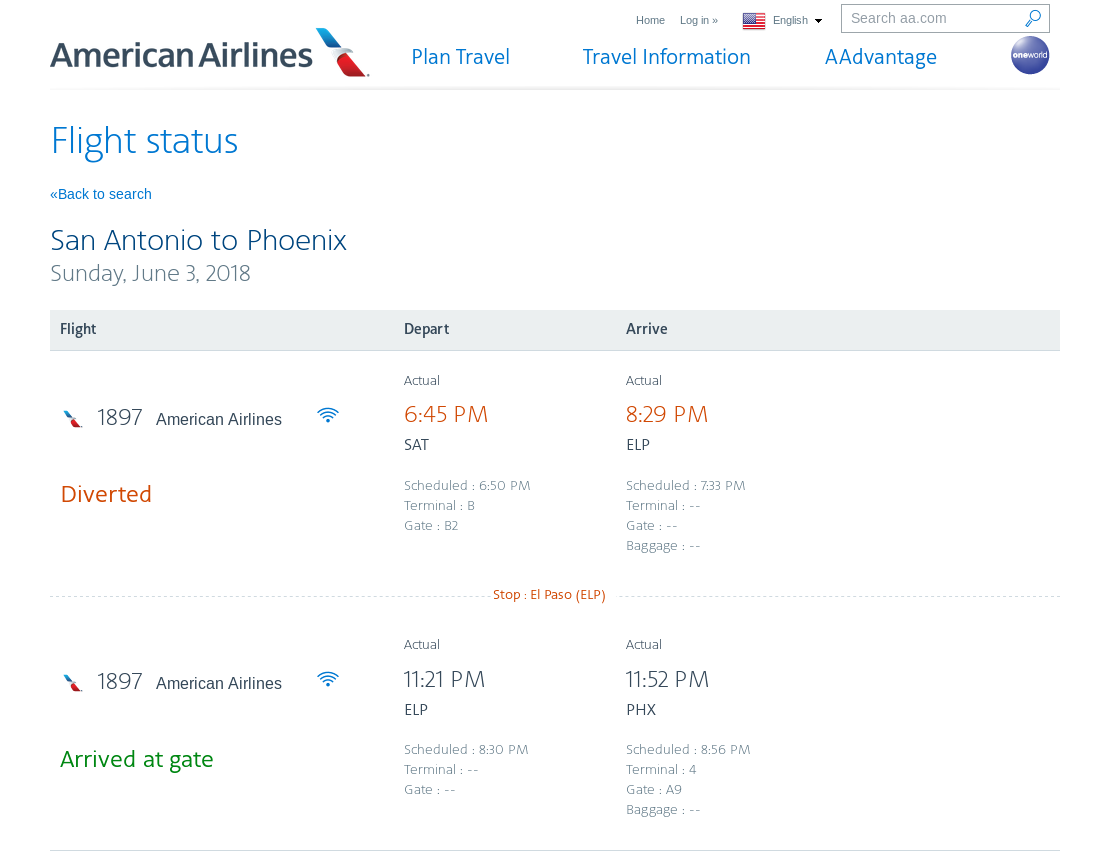
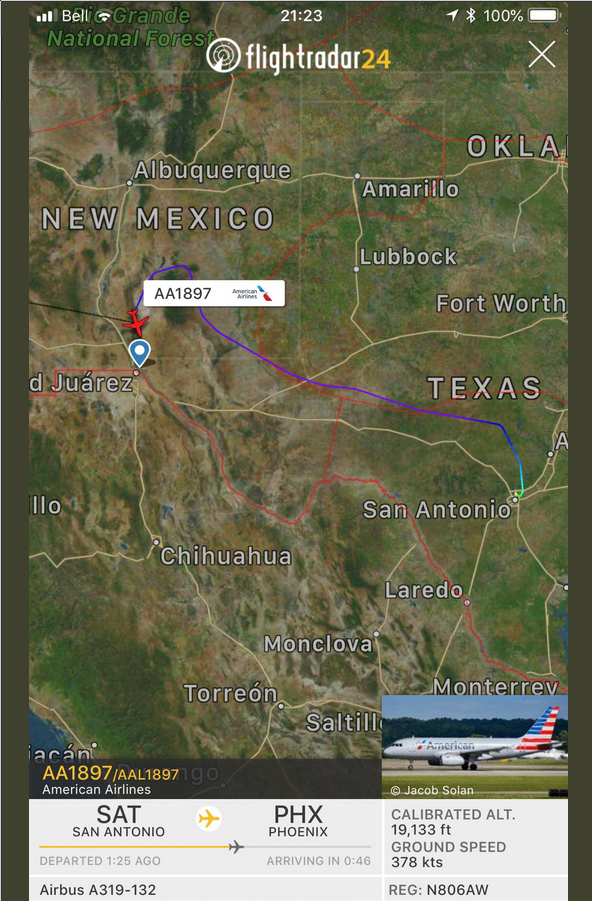
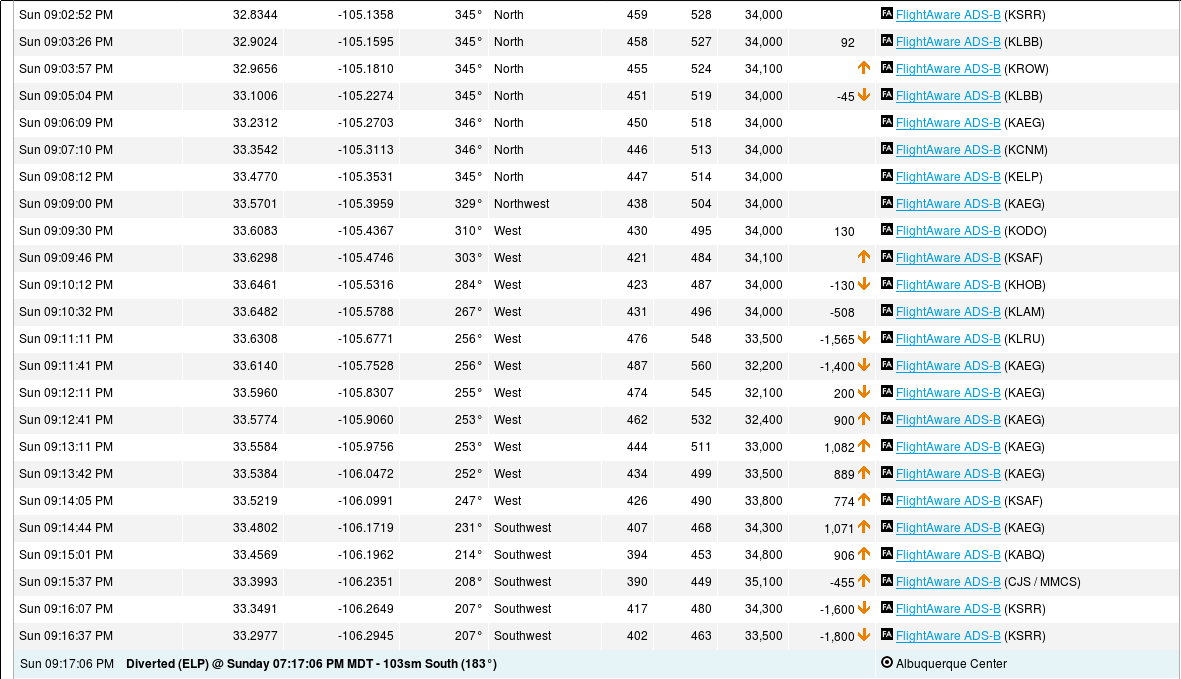
American Airlines Flight 1897 pushed back from the gate San Antonio (SAT) Texas at 6:45 PM CDT (and lifted off at 6:58 PM CDT) (2358 UTC) on 3 June, bound for Phoenix. An encounter with convection over southeastern New Mexico cause windshield and nosecone damage, and the flight landed safely at 8:03 PM (0203 UTC) MDT in El Paso, TX. Click here and here (from Twitter user Tom Podolec) for flight paths. The Flight Tracking Log from FlightAware suggests the damage... Read More
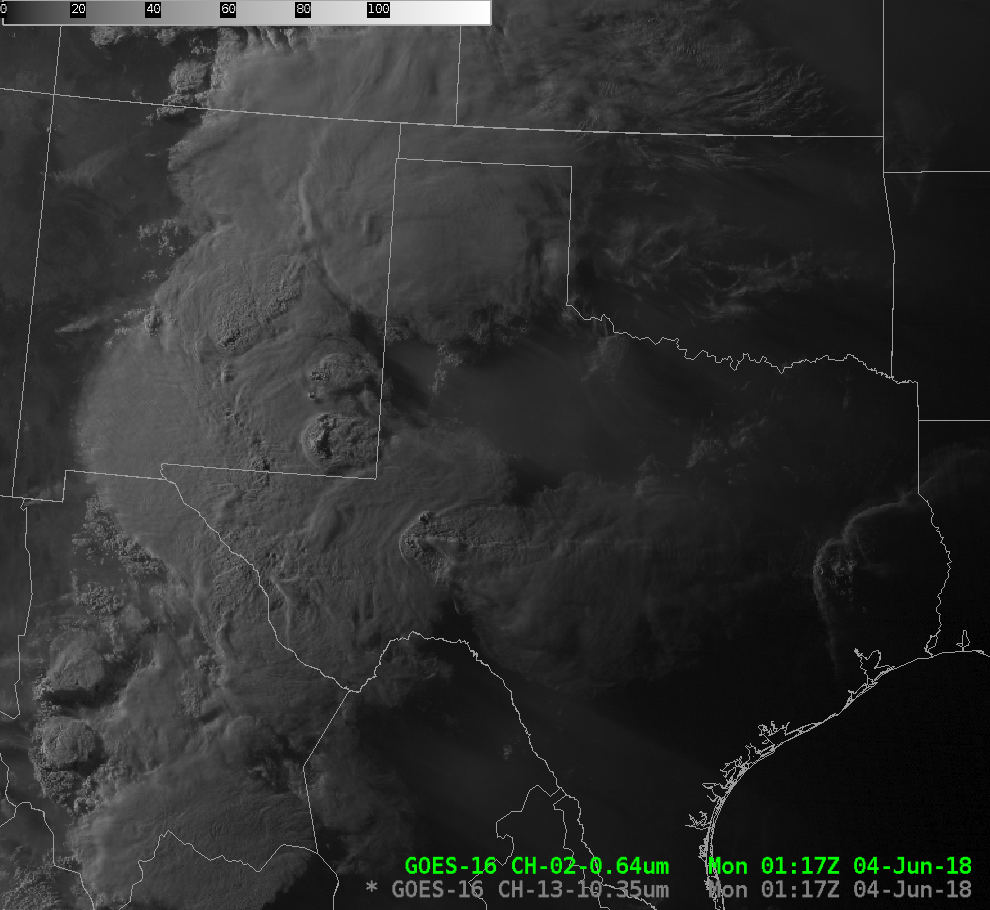
GOES-16 ABI Band 2 Imagery (0.64 µm), 0002-0202 UTC on 4 June 2018 (Click to animate)
American Airlines Flight 1897 pushed back from the gate San Antonio (SAT) Texas at 6:45 PM CDT (and lifted off at 6:58 PM CDT) (2358 UTC) on 3 June, bound for Phoenix. An encounter with convection over southeastern New Mexico cause windshield and nosecone damage, and the flight landed safely at 8:03 PM (0203 UTC) MDT in El Paso, TX. Click here and here (from Twitter user Tom Podolec) for flight paths. The Flight Tracking Log from FlightAware suggests the damage occurred at sometime between 0109 and 0116 UTC.
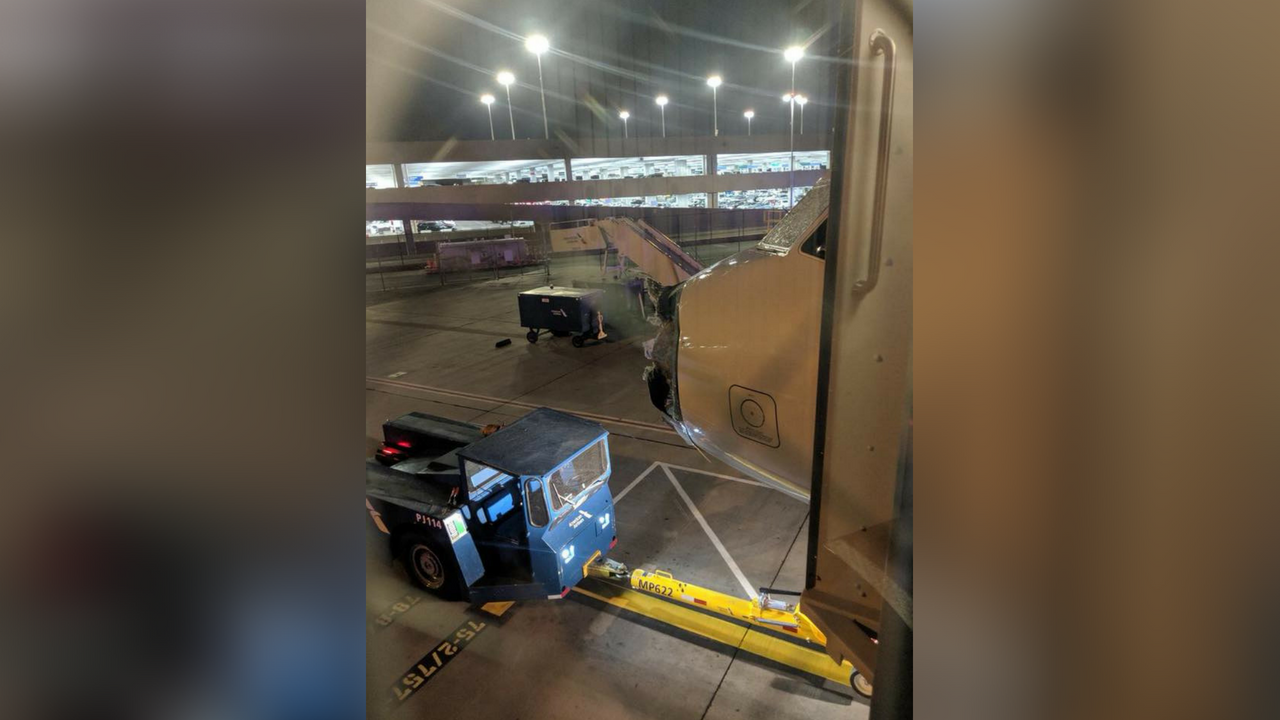
Visible Imagery, above, near sunset revealed strong convection developing over the southern Plains of Texas and New Mexico. In particular a strong convective tower with overshooting tops is apparent over southeast New Mexico. This could be the hail-producing cell that damaged the aircraft. (Note also the fires that continue to burn in western New Mexico!) The photograph below, from Scott Cruse/KTVK (Source), shows the substantial aircraft damage. (Original Photo from KTVK wesbite). This link shows an Incident Report from avherald.com.
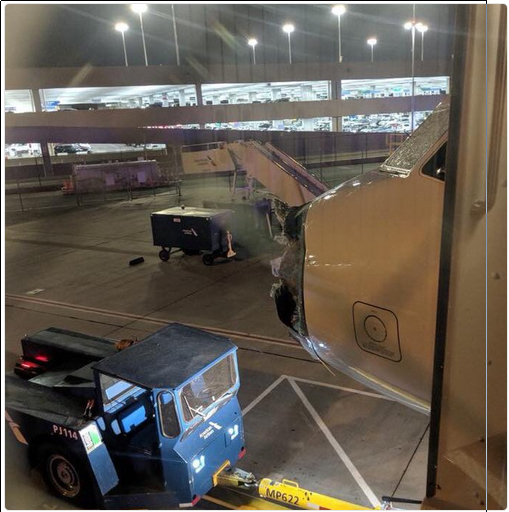
Nosecone and Windshield Damage on AA1897. (Source: Scott Cruse/KTVK)
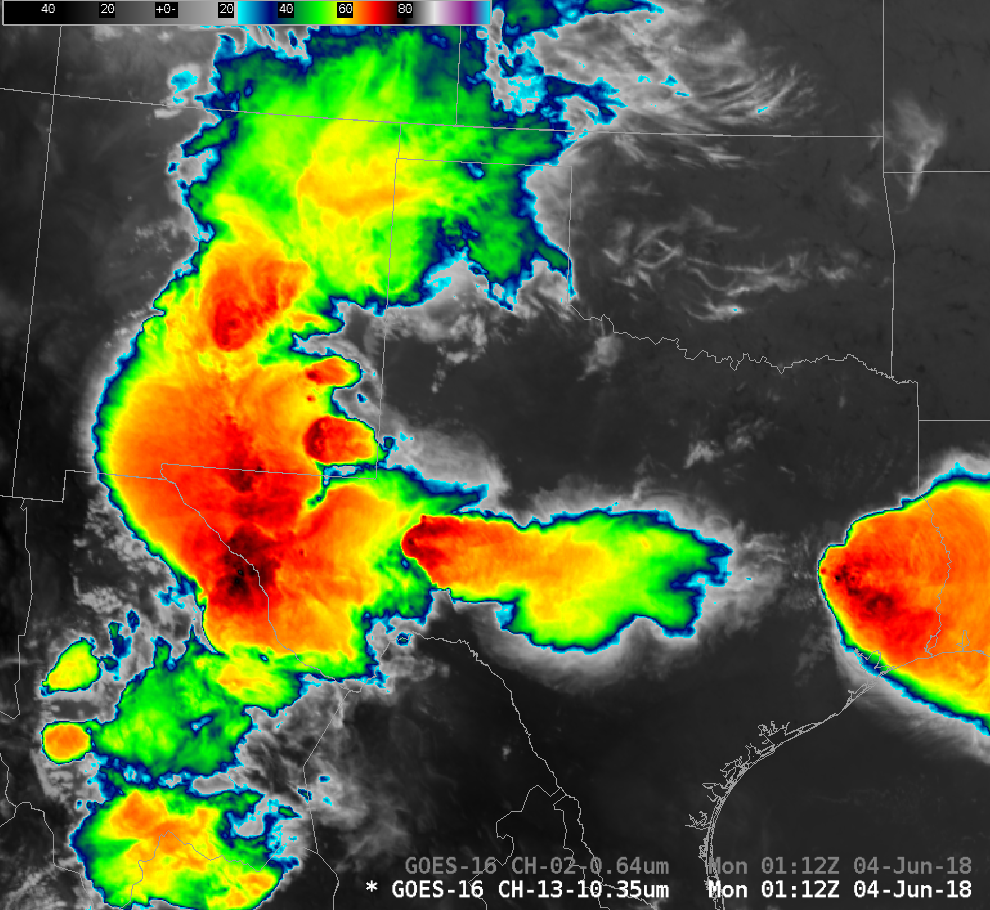
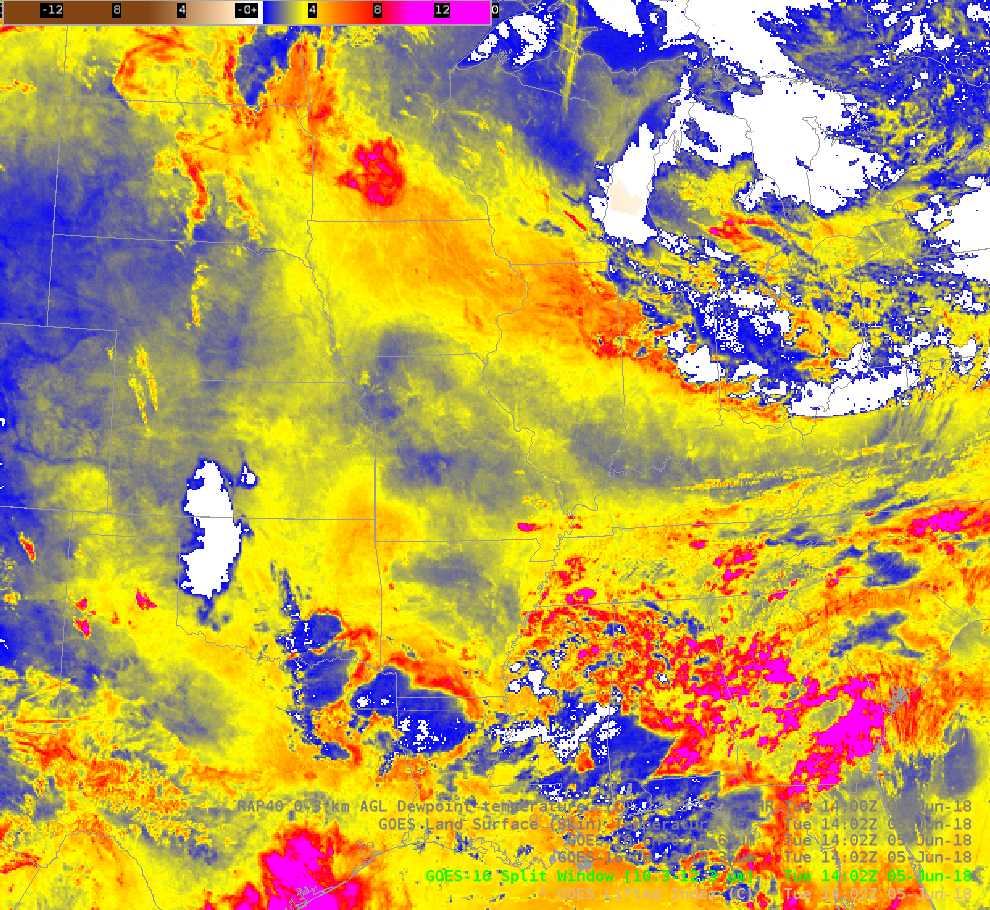
GOES-16 Clean Window Infrared (10.3 µm) imagery, below, also suggests strong convection, with very cold cloud tops over southeastern New Mexico. A complete animation spanning the flight is here: Note how two general areas of convection from the west and from the east appear to converge on southeastern New Mexico; the animation below focuses on the 0032 – 0157 UTC time frame when ongoing strong convection over southeastern New Mexico is spawning multiple overshooting tops. Near the end of this animation the flight diverts to El Paso.
GOES-16 ABI Band 13 Clean Window (10.3 µm) Infrared Imagery, 0032 – 0157 UTC on 4 June 2018 (Click to animate)
A GOES-16 Mesoscale Domain Sector was positioned over the region, providing 1-minute data — Infrared (11.2 µm) and Visible (0.64 µm) images, below (courtesy of Rick Kohrs, SSEC), include plots of the location of the aircraft. The storm in far southeastern New Mexico did produce hail of 2.5 inches in diameter, but there were no SPC storm reports farther northwest near the aircraft encounter with damaging hail. In addition, there was a pilot report of severe turbulence around the same time and location of the Flight 1897 hail damage (albeit at a higher altitude).
![GOES-16 Infrared (11.2 µm, left) and Visible (0.64 µm, right) images, with plots of the aircraft location [click to play animation]](https://cimss.ssec.wisc.edu/satellite-blog/wp-content/uploads/sites/5/2018/06/AA1897_ir_vis_aircraft.jpeg)
GOES-16 Infrared (11.2 µm, left) and Visible (0.64 µm, right) images, with plots of the aircraft location [click to play animation]
A GOES-16 Visible/Infrared Sandwich product is shown below (courtesy of Joleen Feltz, CIMSS)
![GOES-16 Visible/Infrared Sandwich product [click to play MP4 animation]](https://cimss.ssec.wisc.edu/satellite-blog/wp-content/uploads/sites/5/2018/06/180604_sandwich.jpeg)
GOES-16 Visible/Infrared Sandwich product [click to play MP4 animation]
Kudos to the crew for landing this hail-damaged aircraft.
View only this post
Read Less

![Terra MODIS Infrared Window (11.0 µm) image, with SPC storm reports [click to enlarge]](https://cimss.ssec.wisc.edu/satellite-blog/wp-content/uploads/sites/5/2018/06/180606_0445utc_terra_modis_infrared_spc_storm_reports_anim.gif)


![GOES-16 Infrared (11.2 µm, left) and Visible (0.64 µm, right) images, with plots of the aircraft location [click to play animation]](http://www.ssec.wisc.edu/~rickk/aa1897-case.gif)
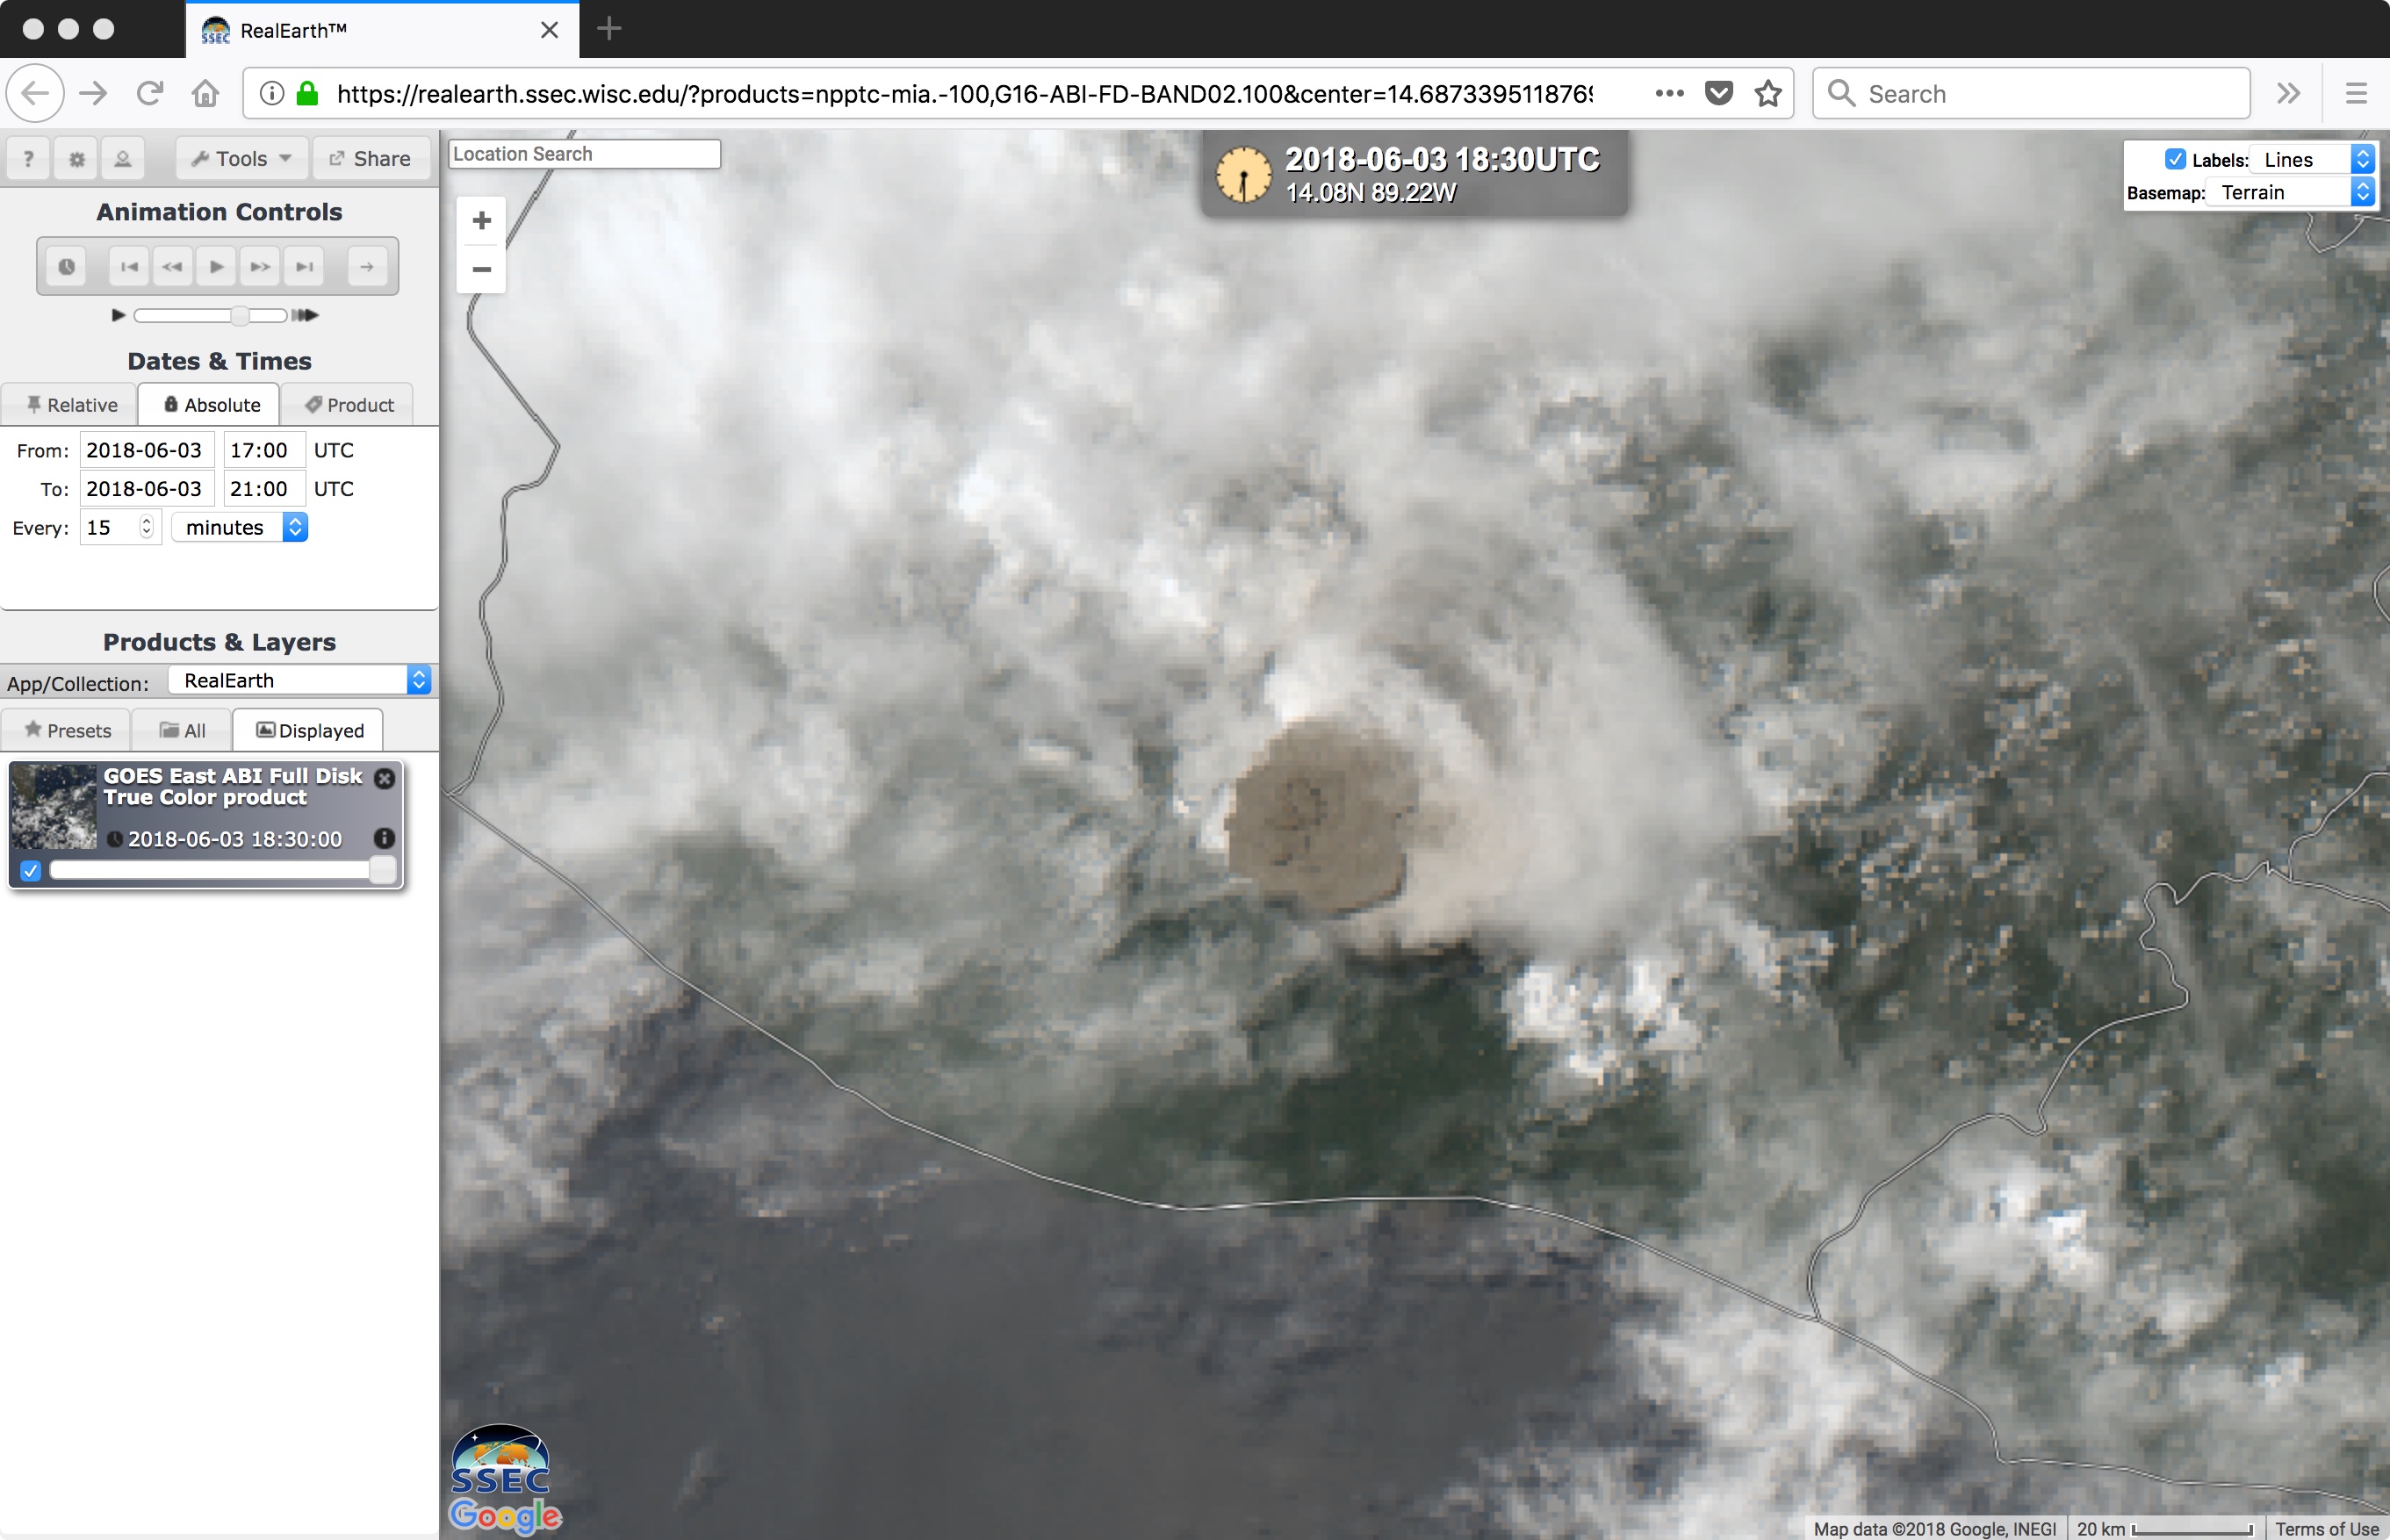
![GOES-16 Visible (0.64 µm, left) and Infrared (10.3 µm, right) images, with hourly plots of surface reports {click to play animation]](https://cimss.ssec.wisc.edu/satellite-blog/wp-content/uploads/sites/5/2018/06/G16_VIS_IR_FUEGO_03JUN2018_958x638_B213_2018154_183048_0002PANELS_00011.GIF)
![GOES-16 true-color RGB images [click to play animation]](https://cimss.ssec.wisc.edu/satellite-blog/wp-content/uploads/sites/5/2018/06/180603_goes16_truecolor_rgb_Fuego_anim.gif)
![GOES-16 Shortwave Infrared (3.9 µm) images [click to play MP4 animation]](https://cimss.ssec.wisc.edu/satellite-blog/wp-content/uploads/sites/5/2018/06/Fuego_swir.jpeg)
![16-panel composite of all ABI bands [click to play MP4 animation]](https://cimss.ssec.wisc.edu/satellite-blog/wp-content/uploads/sites/5/2018/06/Fuego_16panel.jpeg)
