This website works best with a newer web browser such as Chrome, Firefox, Safari or Microsoft
Edge. Internet Explorer is not supported by this website.
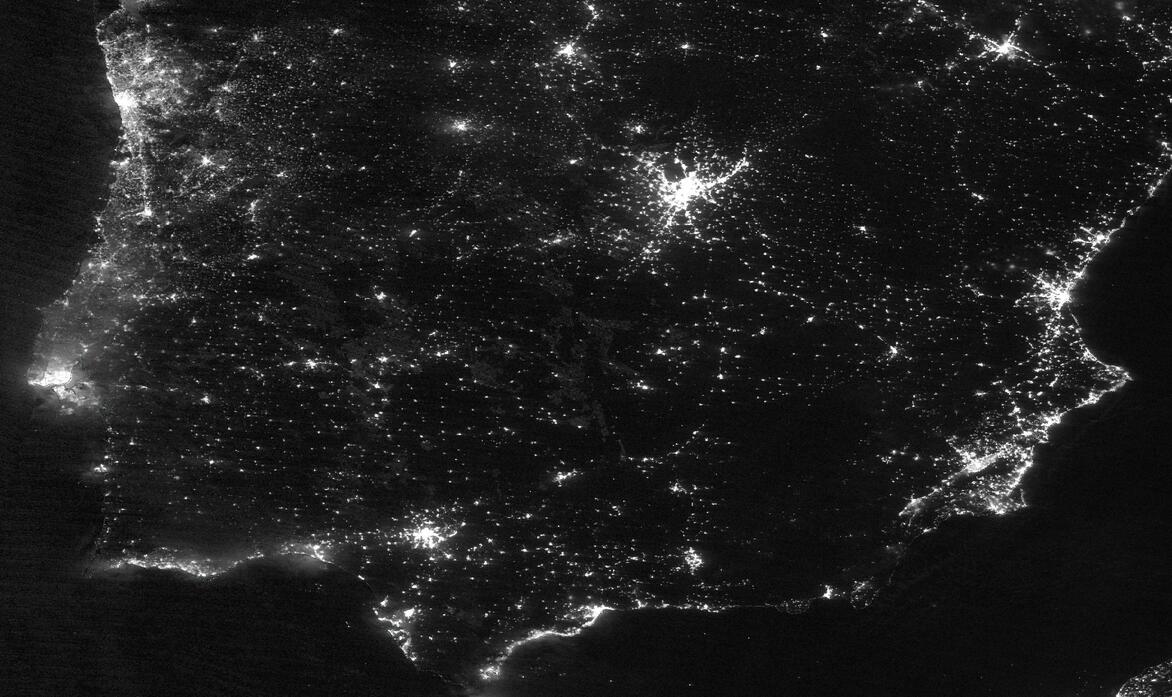
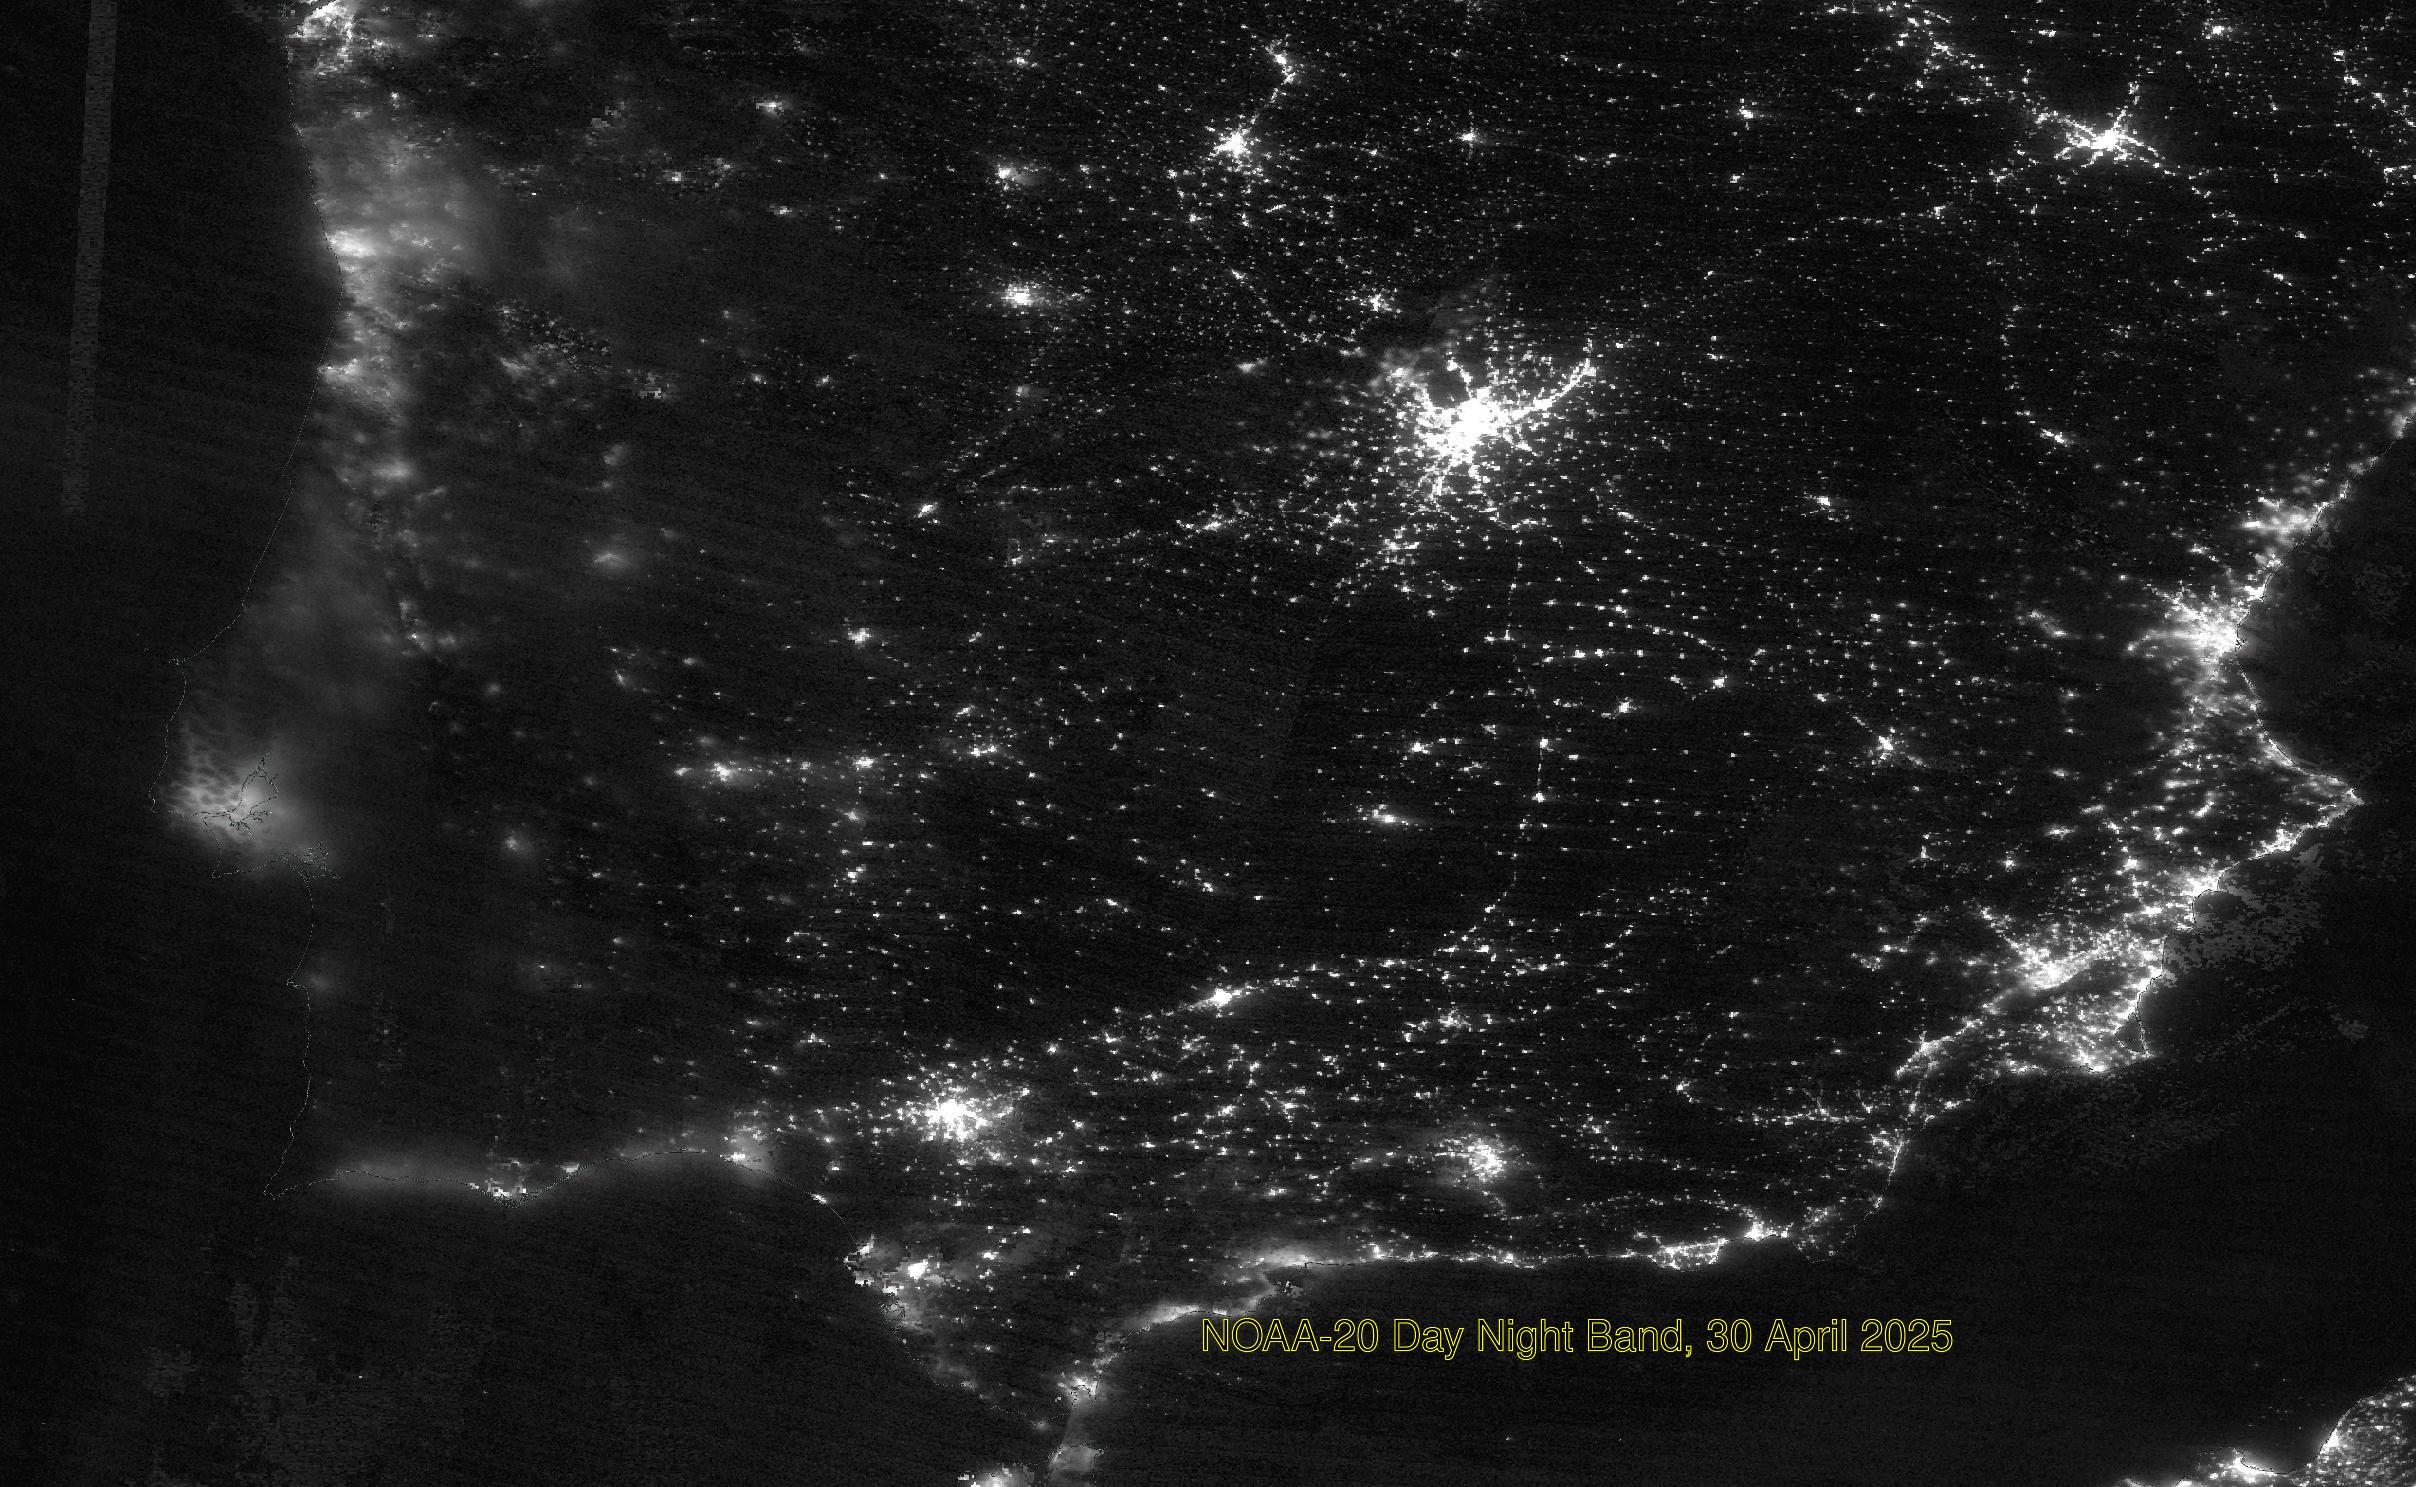
Power outages over the Iberian Peninsula on 28-29 April 2025 have caused wide-spread travel (and life) disruptions (Reuters link). Day Night Band imagery from the NASA Worldview Site (link), shown below, show a reduction in city lights especially over southern Spain on the 29th. The NOAA-20 overpass on 29 April was... Read More
Power outages over the Iberian Peninsula on 28-29 April 2025 have caused wide-spread travel (and life) disruptions (Reuters link). Day Night Band imagery from the NASA Worldview Site (link), shown below, show a reduction in city lights especially over southern Spain on the 29th. The NOAA-20 overpass on 29 April was shortly after 0140 UTC. Skies at that time were mostly clear over southern Spain
The 3-day animation below includes imagery from 27 April as well.
NOAA-20 Day Night Band visible (0.7 µm) imagery, 27-29 April 2025 (Click to enlarge)
5-minute CONUS Sector GOES-19 (GOES-East) daytime True Color RGB images created using Geo2Grid (above) provided a distinct view of widespread blowing dust (shades of tan to light brown) — that had its primary source regions in northern Mexico and southern New Mexico — on 27 April 2025. Peak wind gusts were as... Read More
5-minute GOES-19 daytime True Color RGB + nighttime Dust RGB images, from 1901 UTC on 27 April to 0601 UTC on 28 April [click to play animated GIF | MP4]
5-minute CONUS Sector GOES-19 (GOES-East) daytime True Color RGB images created using Geo2Grid(above) provided a distinct view of widespread blowing dust (shades of tan to light brown) — that had its primary source regions in northern Mexico and southern New Mexico — on 27 April 2025. Peak wind gusts were as high as 50 knots at Deming NM (at 2246 UTC) and 46 knots at El Paso TX (at 2020 UTC). The visibility was restricted to 1/4-1/2 mile at El Paso TX from 2200-0145 UTC — prompting the issuance of numerous Blowing Dust Warnings in the area. After sunset, Dust RGB images highlighted the airborne dust (shades of magenta) as it was transported northeastward as far as southeast Colorado and southwest Kansas by 0601 UTC on 28 April. In addition, a few wildfires across northern Mexico and central New Mexico were producing notable smoke plumes (brighter shades of white, in contrast to the blowing dust) prior to sunset.
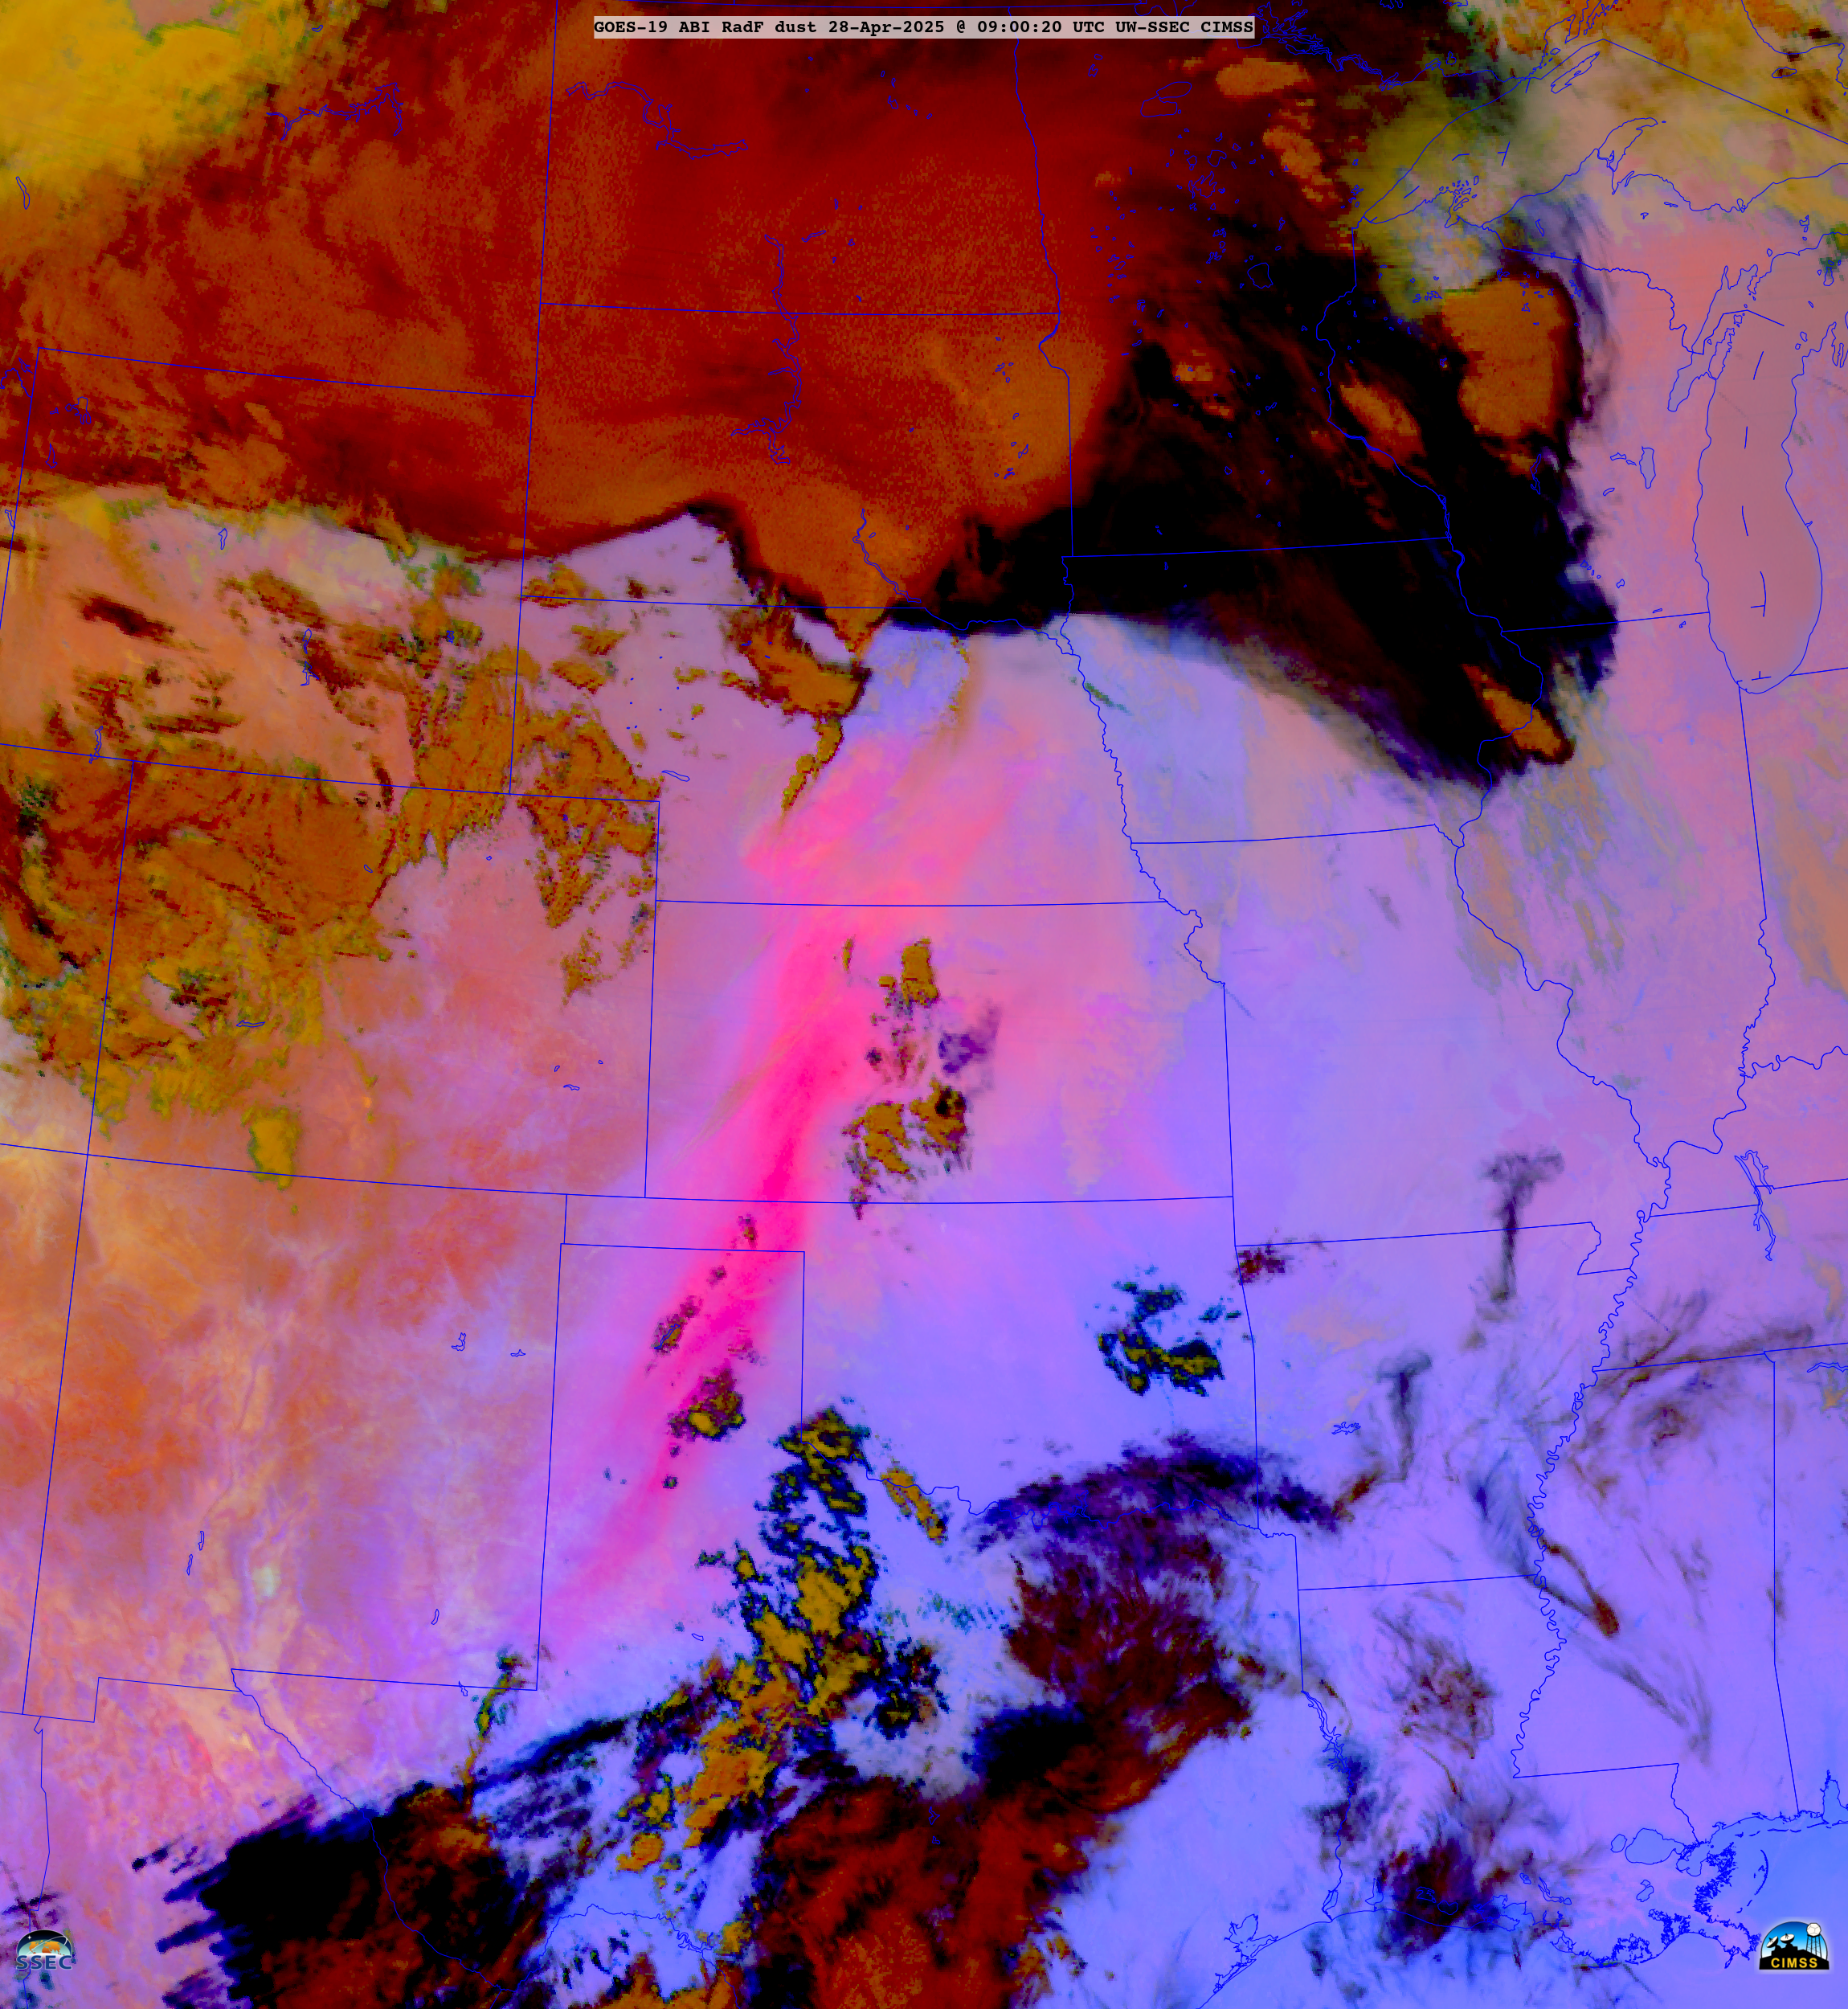
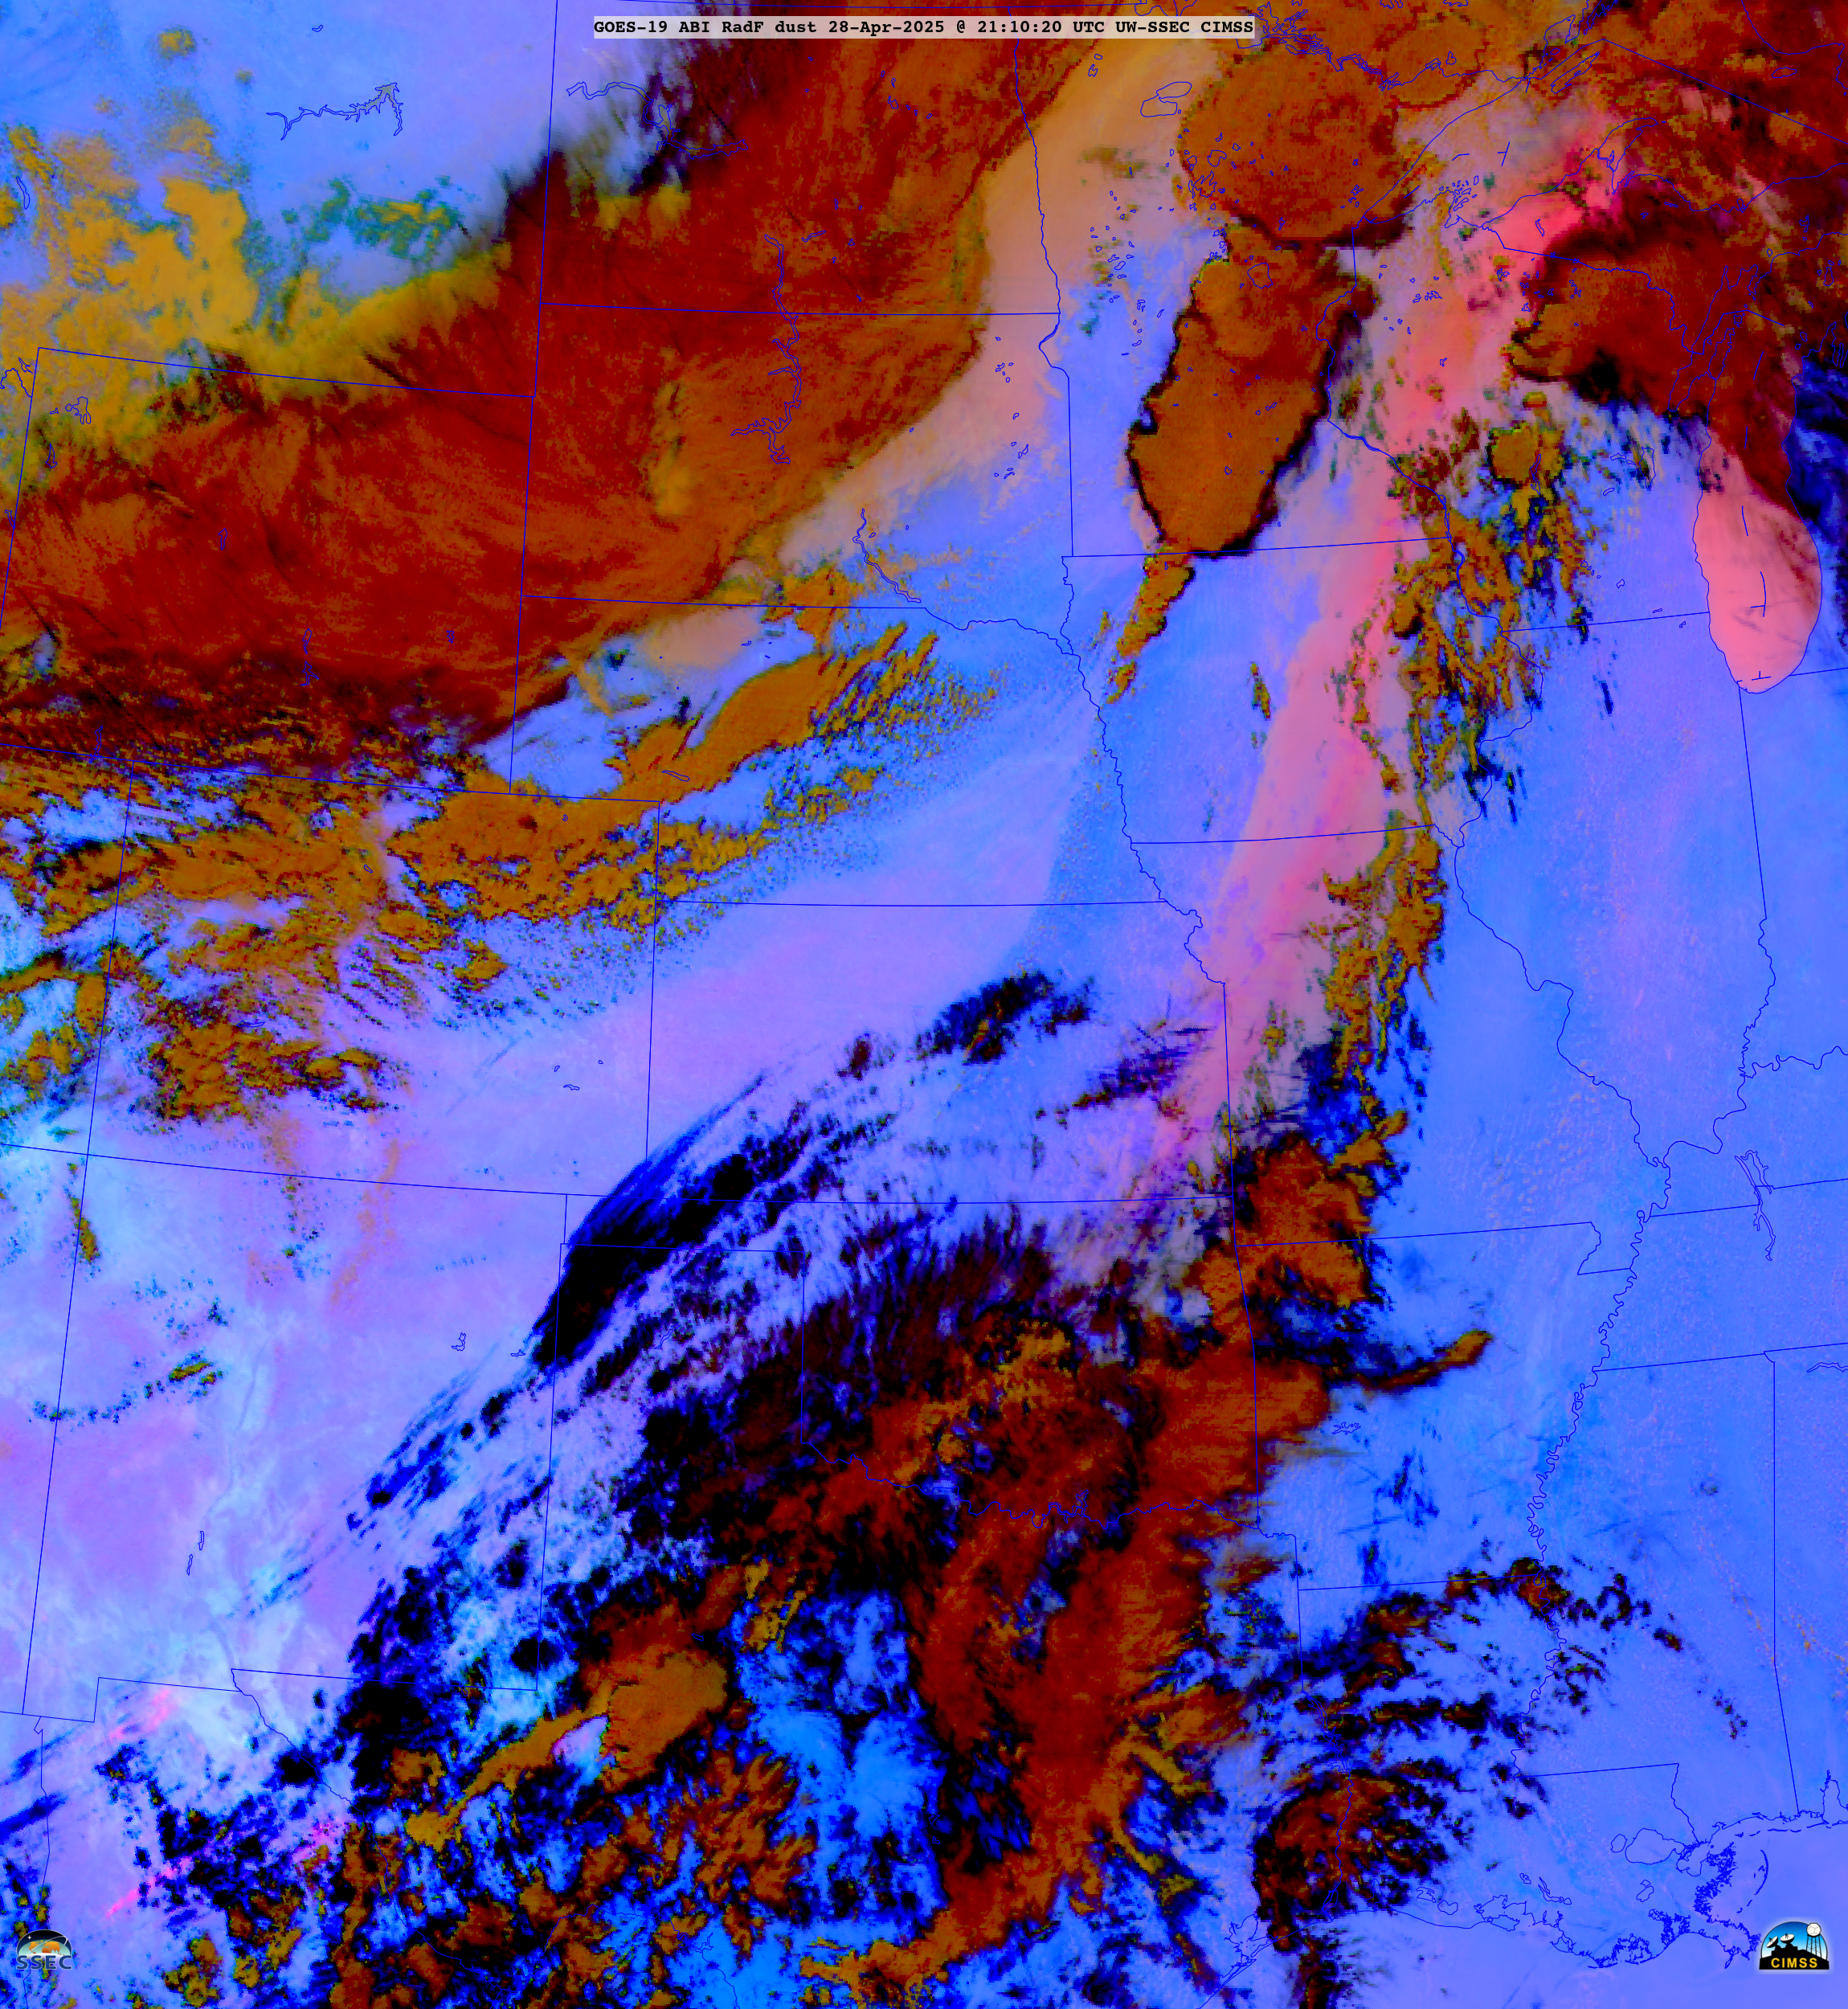
A longer animation of 10-minute Full Disk scan GOES-19 Dust RGB images (below) showed that the leading edge of airborne dust had advanced as far northeastward as Nebraska by 0900 UTC on 28 April, and northwestern Wisconsin and the western Upper Peninsula of Michigan by 2110 UTC on 28 April.
10-minute GOES-19 Dust RGB images, from 1800 UTC on 27 April to 0600 UTC on 29 April [click to play animated GIF | MP4]
HYSPLIT Model forward trajectories initialized near the dust source regions in far northern Mexico (below) indicated that the dust-laden air parcels likely ascended to altitudes of 4.0 to 6.5 km by the time they passed over Wisconsin and Michigan by 0000 UTC on 29 April — which was in good agreement with what was observed in the longer animation of GOES-19 Dust RGB images.
HYSPLIT Model forward trajectories, from 2000 UTC on 27 April to 0500 UTC on 29 April
Continuing this blog’s recent theme of discussing recent events in West Texas, a tornadic supercell has formed near Muleshoe, Texas, in the panhandle region near the Texas / New Mexico border. Both CONUS and mesoscale sector scans from GOES-19 well-captured the initiation and further development of this storm.The late morning surface analysis (1500 UTC,... Read More
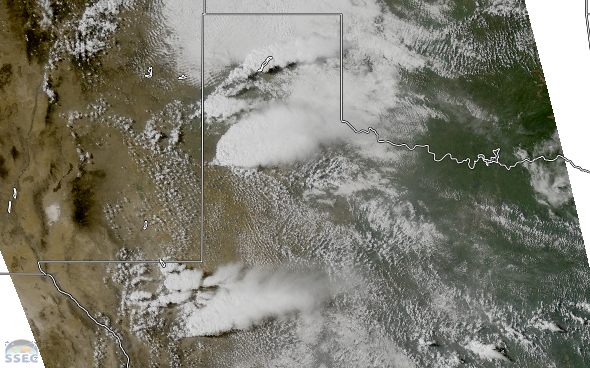
Continuing this blog’s recent theme of discussing recent events in West Texas, a tornadic supercell has formed near Muleshoe, Texas, in the panhandle region near the Texas / New Mexico border. Both CONUS and mesoscale sector scans from GOES-19 well-captured the initiation and further development of this storm.
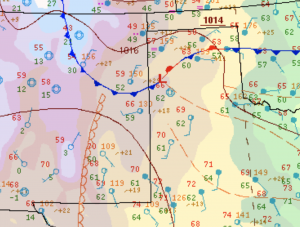
The late morning surface analysis (1500 UTC, from NOAA WPC) shows the potential for this event. Multiple boundaries are present in the high plains of Texas and New Mexico: a southward-sagging cold front and a series of westward propagating outflow boundaries from existing central plains weather systems. These outflow boundaries are shown as dashed brown lines in the surface map.
Any of these boundaries is capable of initiating convection as they propagate along their direction of travel as both cold fronts and outflow boundaries represent the leading edge of cool, dense air that can undercut and lift warmer air. It is worth noting that the panhandle air is also somewhat moister than is often seen, with dew point temperatures in the low 60s. A very strong moisture gradient can also be seen along the dryline: witness those southern New Mexico dew points in the single digits or even below zero!
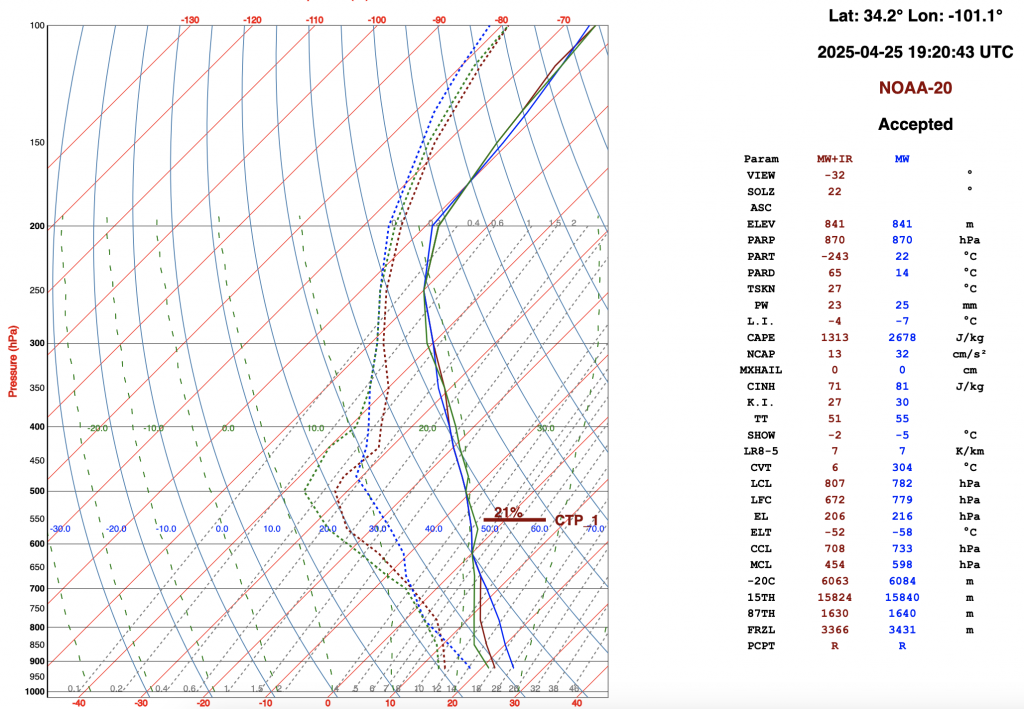
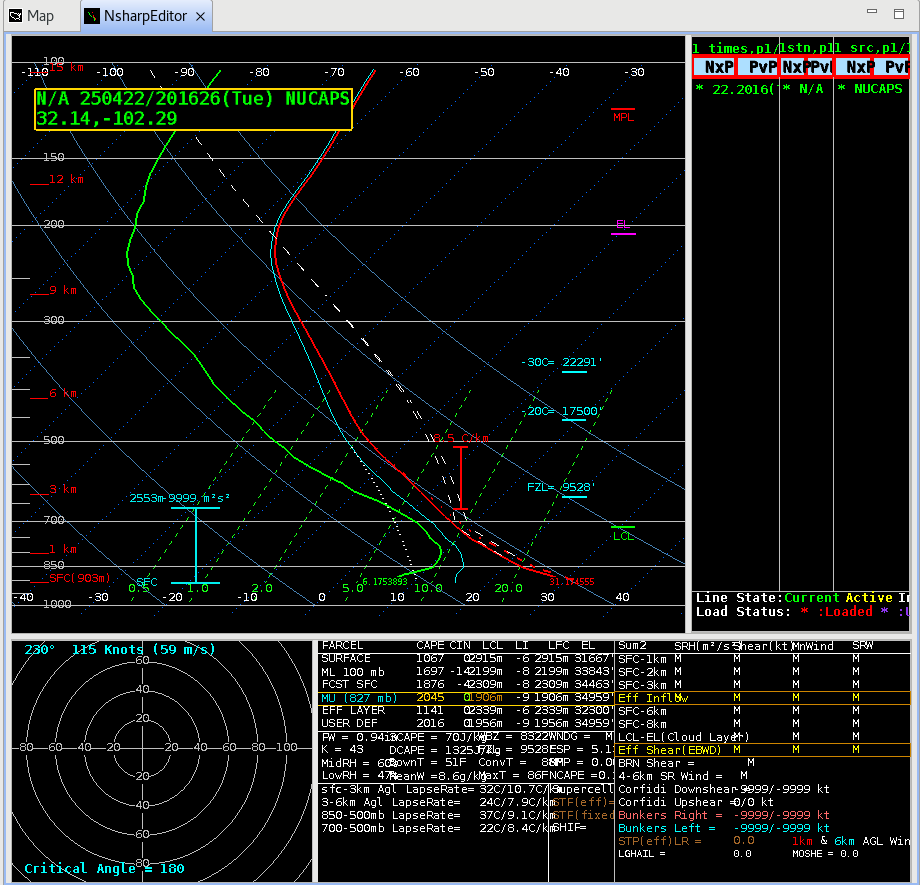
The atmosphere was primed for convection, as can be seen in a NUCAPS sounding from the early afternoon for the Texas panhandle. The best-estimate CAPE from the combined microwave and infrared sounder retrieval was 1313 J/kg at that time, which compares well with the 1900 UTC special radiosonde launched from Amarillo, which measured a mixed-layer cape of 1476 J/kg.
One might expect that the convection would be focused along the dryline when it is that strong. However, the GOES-19 CONUS true color satellite imagery shows that convection is focused along the cold front and outflow boundaries.
This is a somewhat unusual occurrence, as convection in this part of the continental United States is frequently induced from boundaries propagating eastward. Note that the most significant cell forms where a north-south outflow boundary intersects the east-west cold front. The constructive interference induced from these colliding boundaries can often induces stronger lifting, which is clearly evident here.
NWS and NOAA personnel coordinated to ensure that a mesoscale sector was available for this region, providing minute-by-minute snapshots of the region. The CIMSS ProbSevere product was also able to identify regions of concern for public safety and property. At 2102 UTC, a large multi-vortex tornado was reported from this cell (source: NOAA Storm Prediction Center)
By late afternoon, numerous other cells had initiated. Many of them carried the classic indicators of strong convection such as overshooting tops and enhanced V structures that can be seen on the Band 13 imagery. The largest cell in the center of the animation below was the original cell. Given the somewhat unusual direction that the initiating boundaries were propagating, it might not be too surprising that this cell is moving to the south rather than a more typical east-northeast direction as is shown in the 1 minute mesoscale imagery.
A closer look at the evolution of this cell also reveals something interesting (and somewhat unusual). With one of the factors forcing convective initiation today being the eastward movement of pre-existing boundary layers, a strong updraft formed beneath the anvil of the initial cell along one of those boundaries, forming its own overshooting top that penetrated through the anvil. It then moved westward and merged into and strengthened the existing updraft.
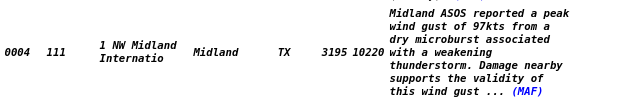
SPC Storm reports for 1200 UTC 22 April – 1200 UTC 23 April 2025 (here) included an observation of very strong winds at the Midland Airport as shown below. (See also this link).What did the satellite imagery for this storm show? GOES-16 CONUS visible imagery, below, shows the evolution of the thunderstorm responsible... Read More
SPC Storm reports for 1200 UTC 22 April – 1200 UTC 23 April 2025 (here) included an observation of very strong winds at the Midland Airport as shown below. (See also this link).
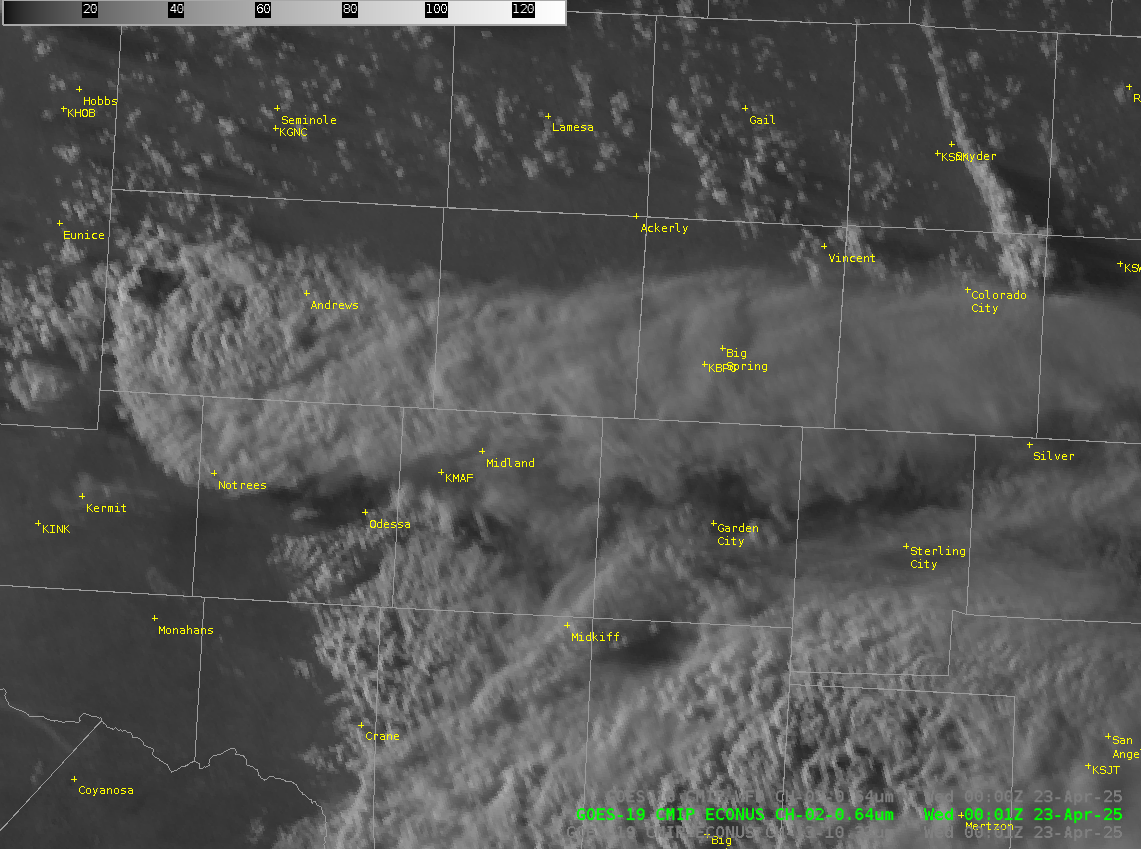
What did the satellite imagery for this storm show? GOES-16 CONUS visible imagery, below, shows the evolution of the thunderstorm responsible for the downburst. As noted in the storm reports, it’s weakening.
GOES-19 Band 2 Visible (0.64 µm) imagery, 2301 UTC 22 April 2025 – 0056 23 April 2025 (Click to enlarge)
Careful inspection of the visible imagery at the end of the animation suggests the arc of an outflow boundary to the west of Odessa. Perhaps more than one strong downdraft was occurring in this environment.
GOES-19 Band 2 Visible (0.64 µm) imagery, 0051 UTC 23 April 2025 with arrows highlighting a possible outflow boundary (Click to enlarge)
GOES-19 Infrared imagery (Band 13, 10.3 µm) also shows the weakening convection.
GOES-19 Band 13 infrared (10.3 µm) imagery, 2301 UTC 22 April 2025 – 0056 23 April 2025 (Click to enlarge)
GOES-West (GOES-18) also viewed the convection. However, west Texas is outside the GOES-West CONUS/PACUS sector with its routine 5-minute scanning, and only Full Disk imagery (every 10 minutes) is routinely available.
GOES-18 Band 2 visible (0.64 µm) imagery, 2300 UTC 22 April 2025 – 0050 23 April 2025 (Click to enlarge)
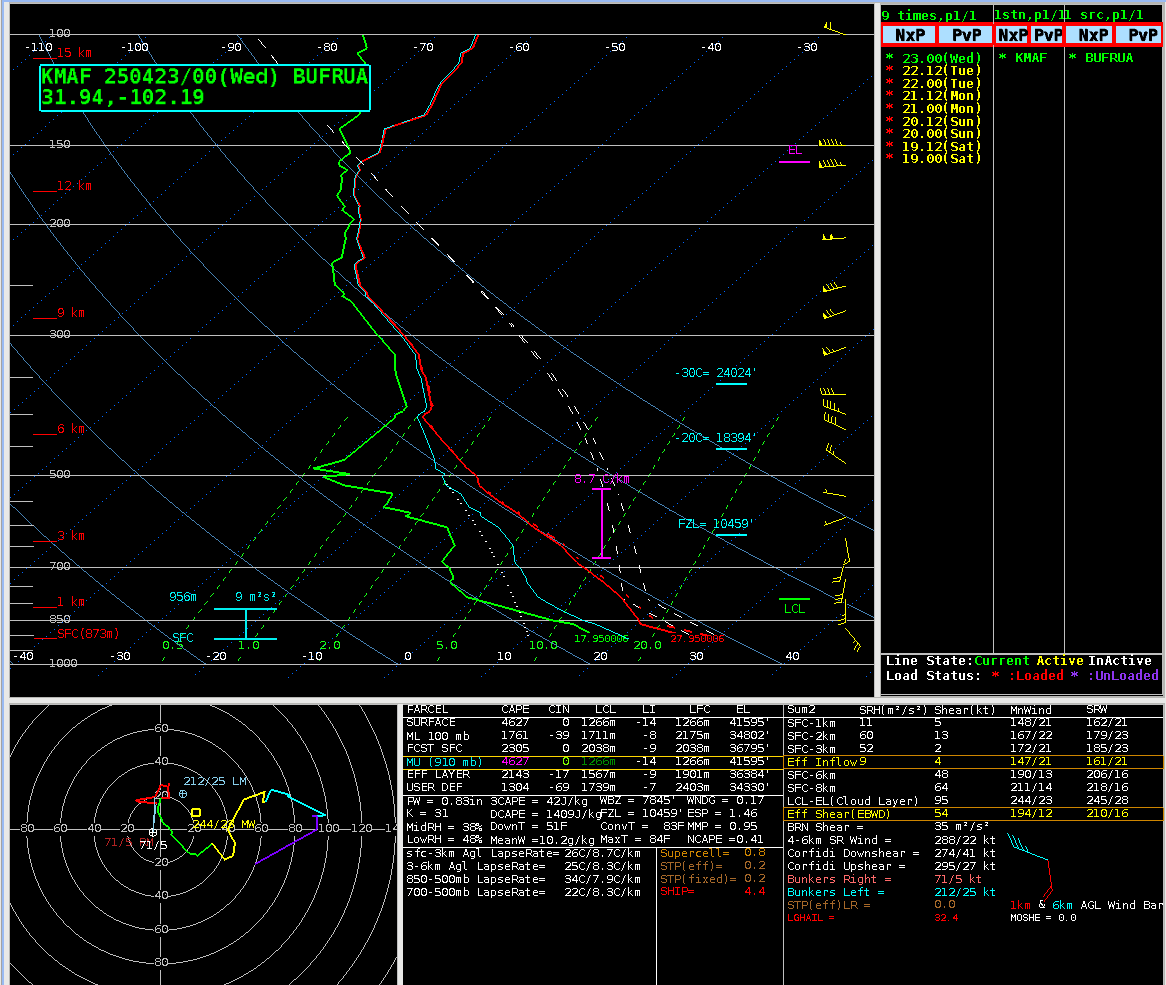
What was the thermodynamic structure over west Texas at this time? Midland did launch a radiosonde, and the 0000 UTC 23 April 2025 sounding is shown below, and also available here, from the handy Wyoming Sounding website. Of note is the very steep lapse rate from 500-mb down to the surface!
Upper Air sounding at KMAF valid 0000 UTC 23 April 2025 (Click to enlarge)
Both NOAA-21 (at 1925 UTC) and NOAA-20 (at 2014 UTC) overflew west Texas late in the afternoon on 22 April 2025, and NUCAPS profiles were produced over this unstable environment. The slider below compares the lapse rate (oC) between 800 and 600 mb (imagery was created with polar2grid as described in this blog post); the atmosphere shows very strong lapse rates over west Texas, in agreement with the one radisonde above!
NUCAPS Sounding Availability fields from AWIPS on 22 April 2025 (below) show the following points available. Over west Texas, valid profiles (in green: that is, the retrieval converged to a solution) are indicated.
NUCAPS Sounding Availability plots, 1925 and 2014 UTC on 22 April 2025 (Click to enlarge)
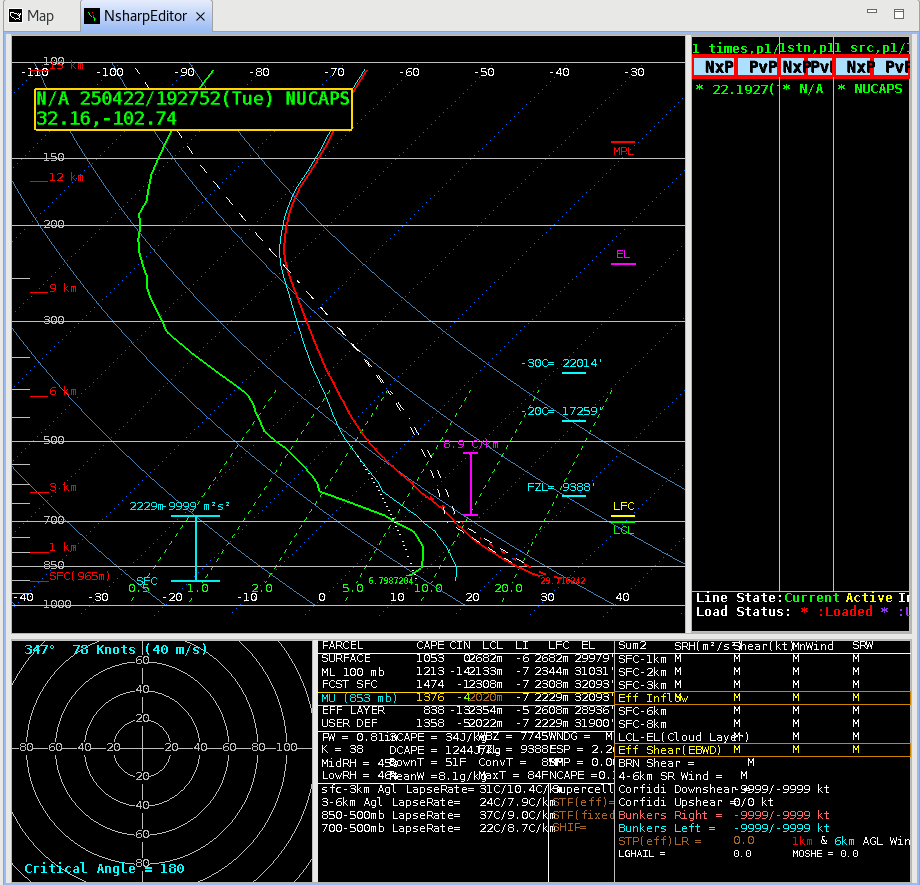
NUCAPS profiles at the closest point northwest of Midland are shown below at 1927 UTC (NOAA-21) and 2016 UTC (NOAA-20). As in the KMAF radiosonde above, a neutral atmosphere up to 500 mb is apparent at both times.
NUCAPS profile at 1927 UTC, lat/lon as indicated; the point is to the northwest of Midland TX (Click to enlarge)NUCAPS profile at 2016 UTC, lat/lon as indicated; the point is to the northwest of Midland TX (Click to enlarge)
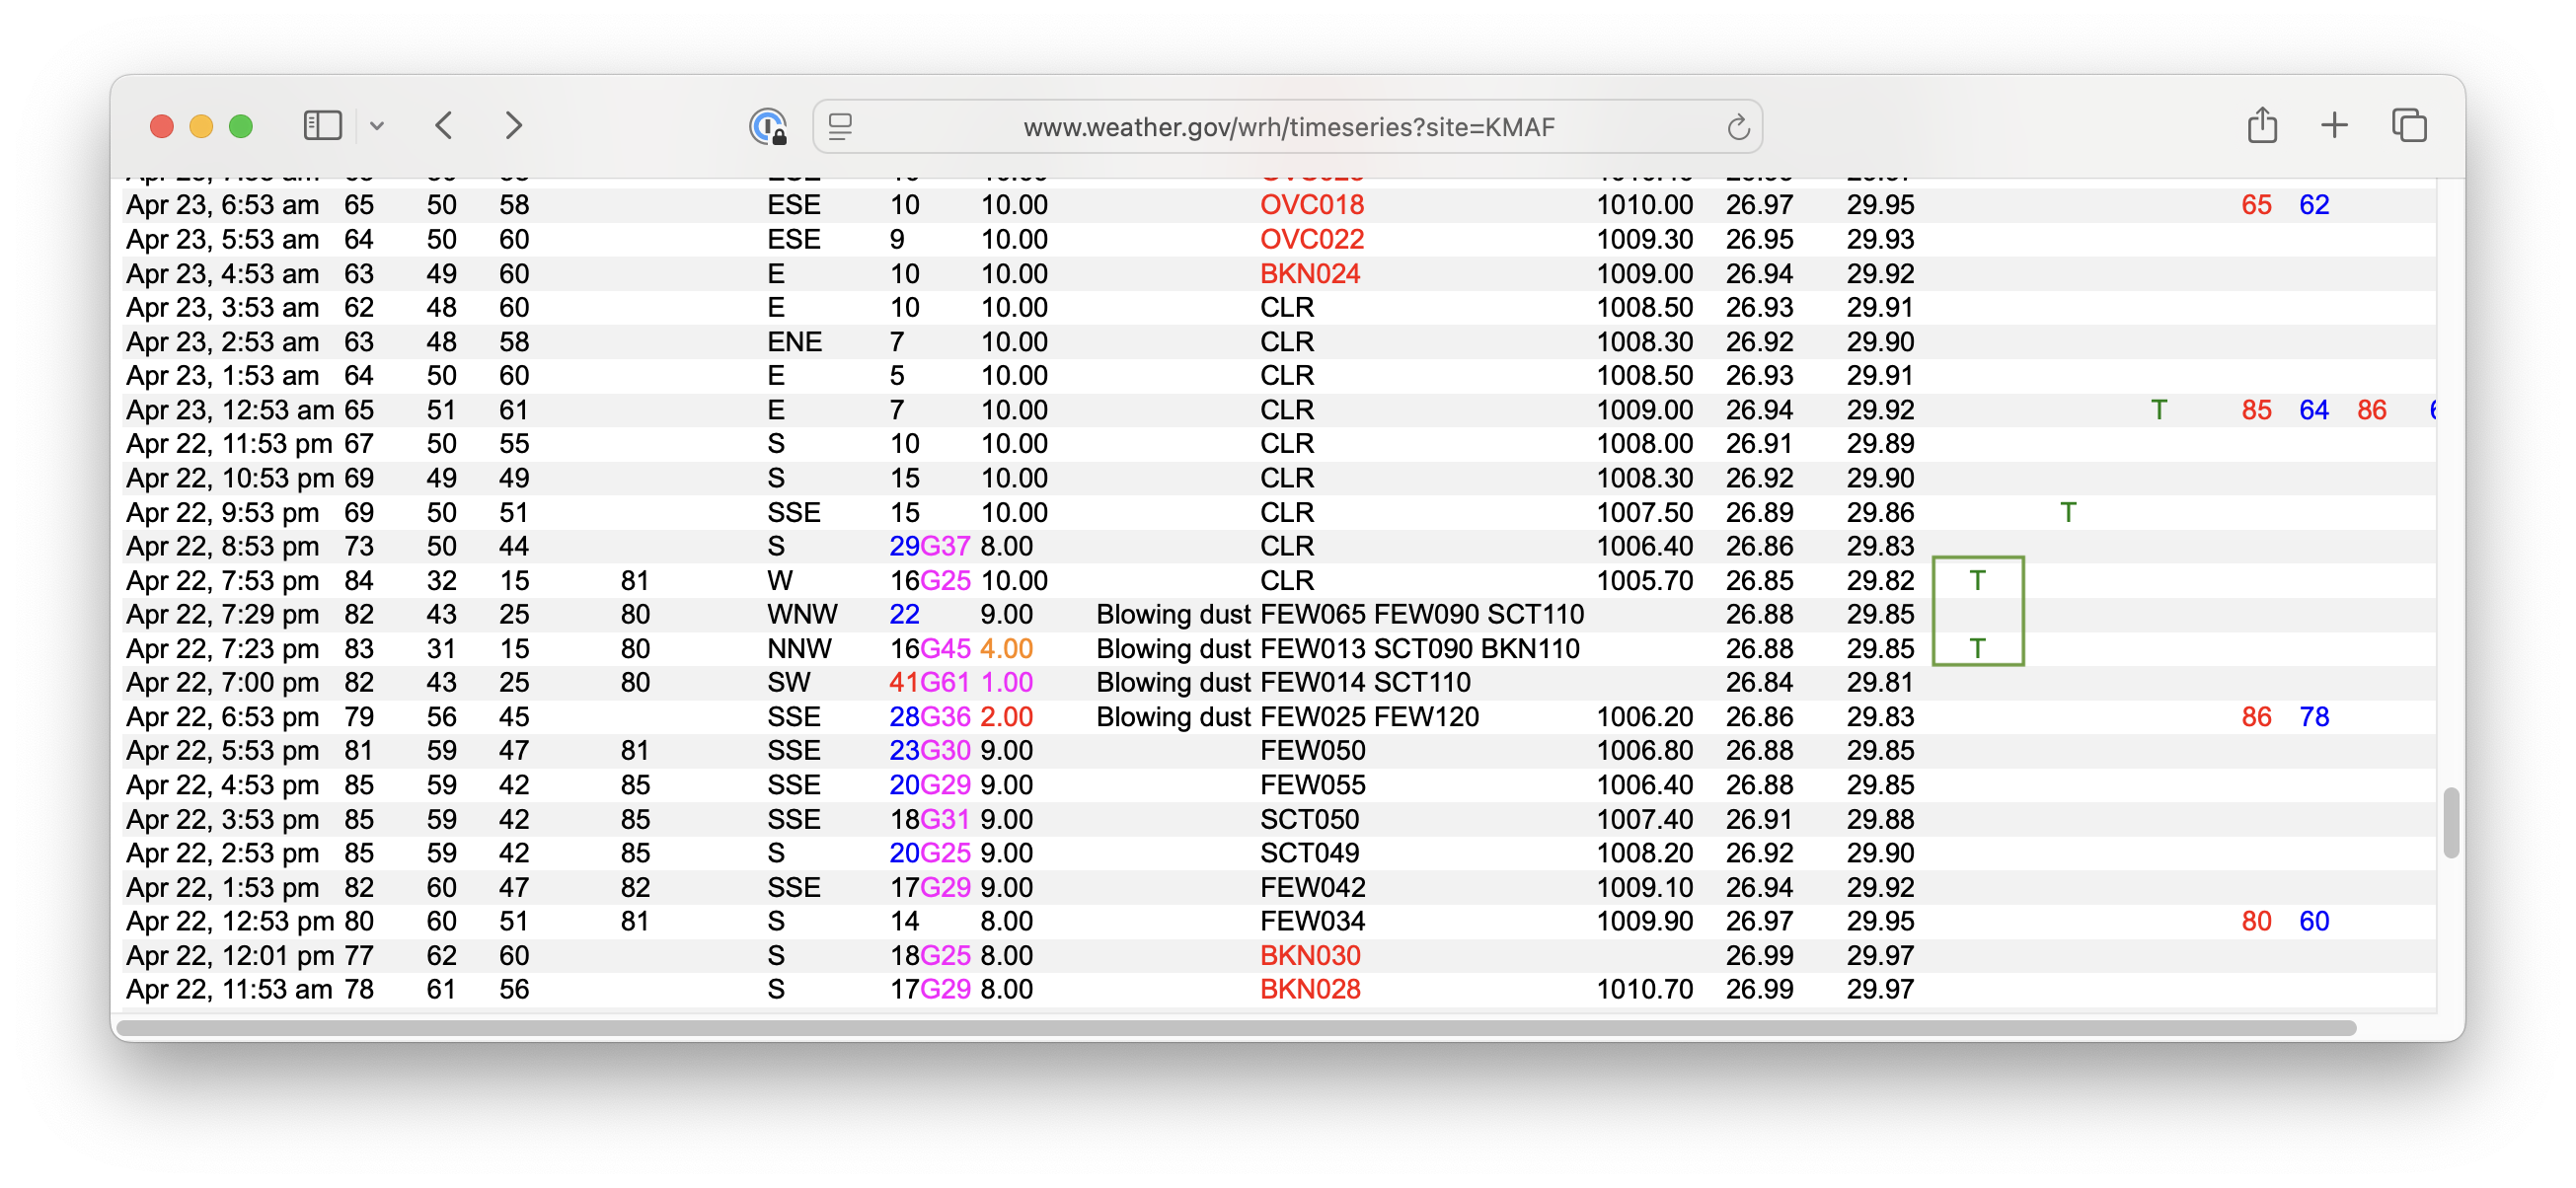
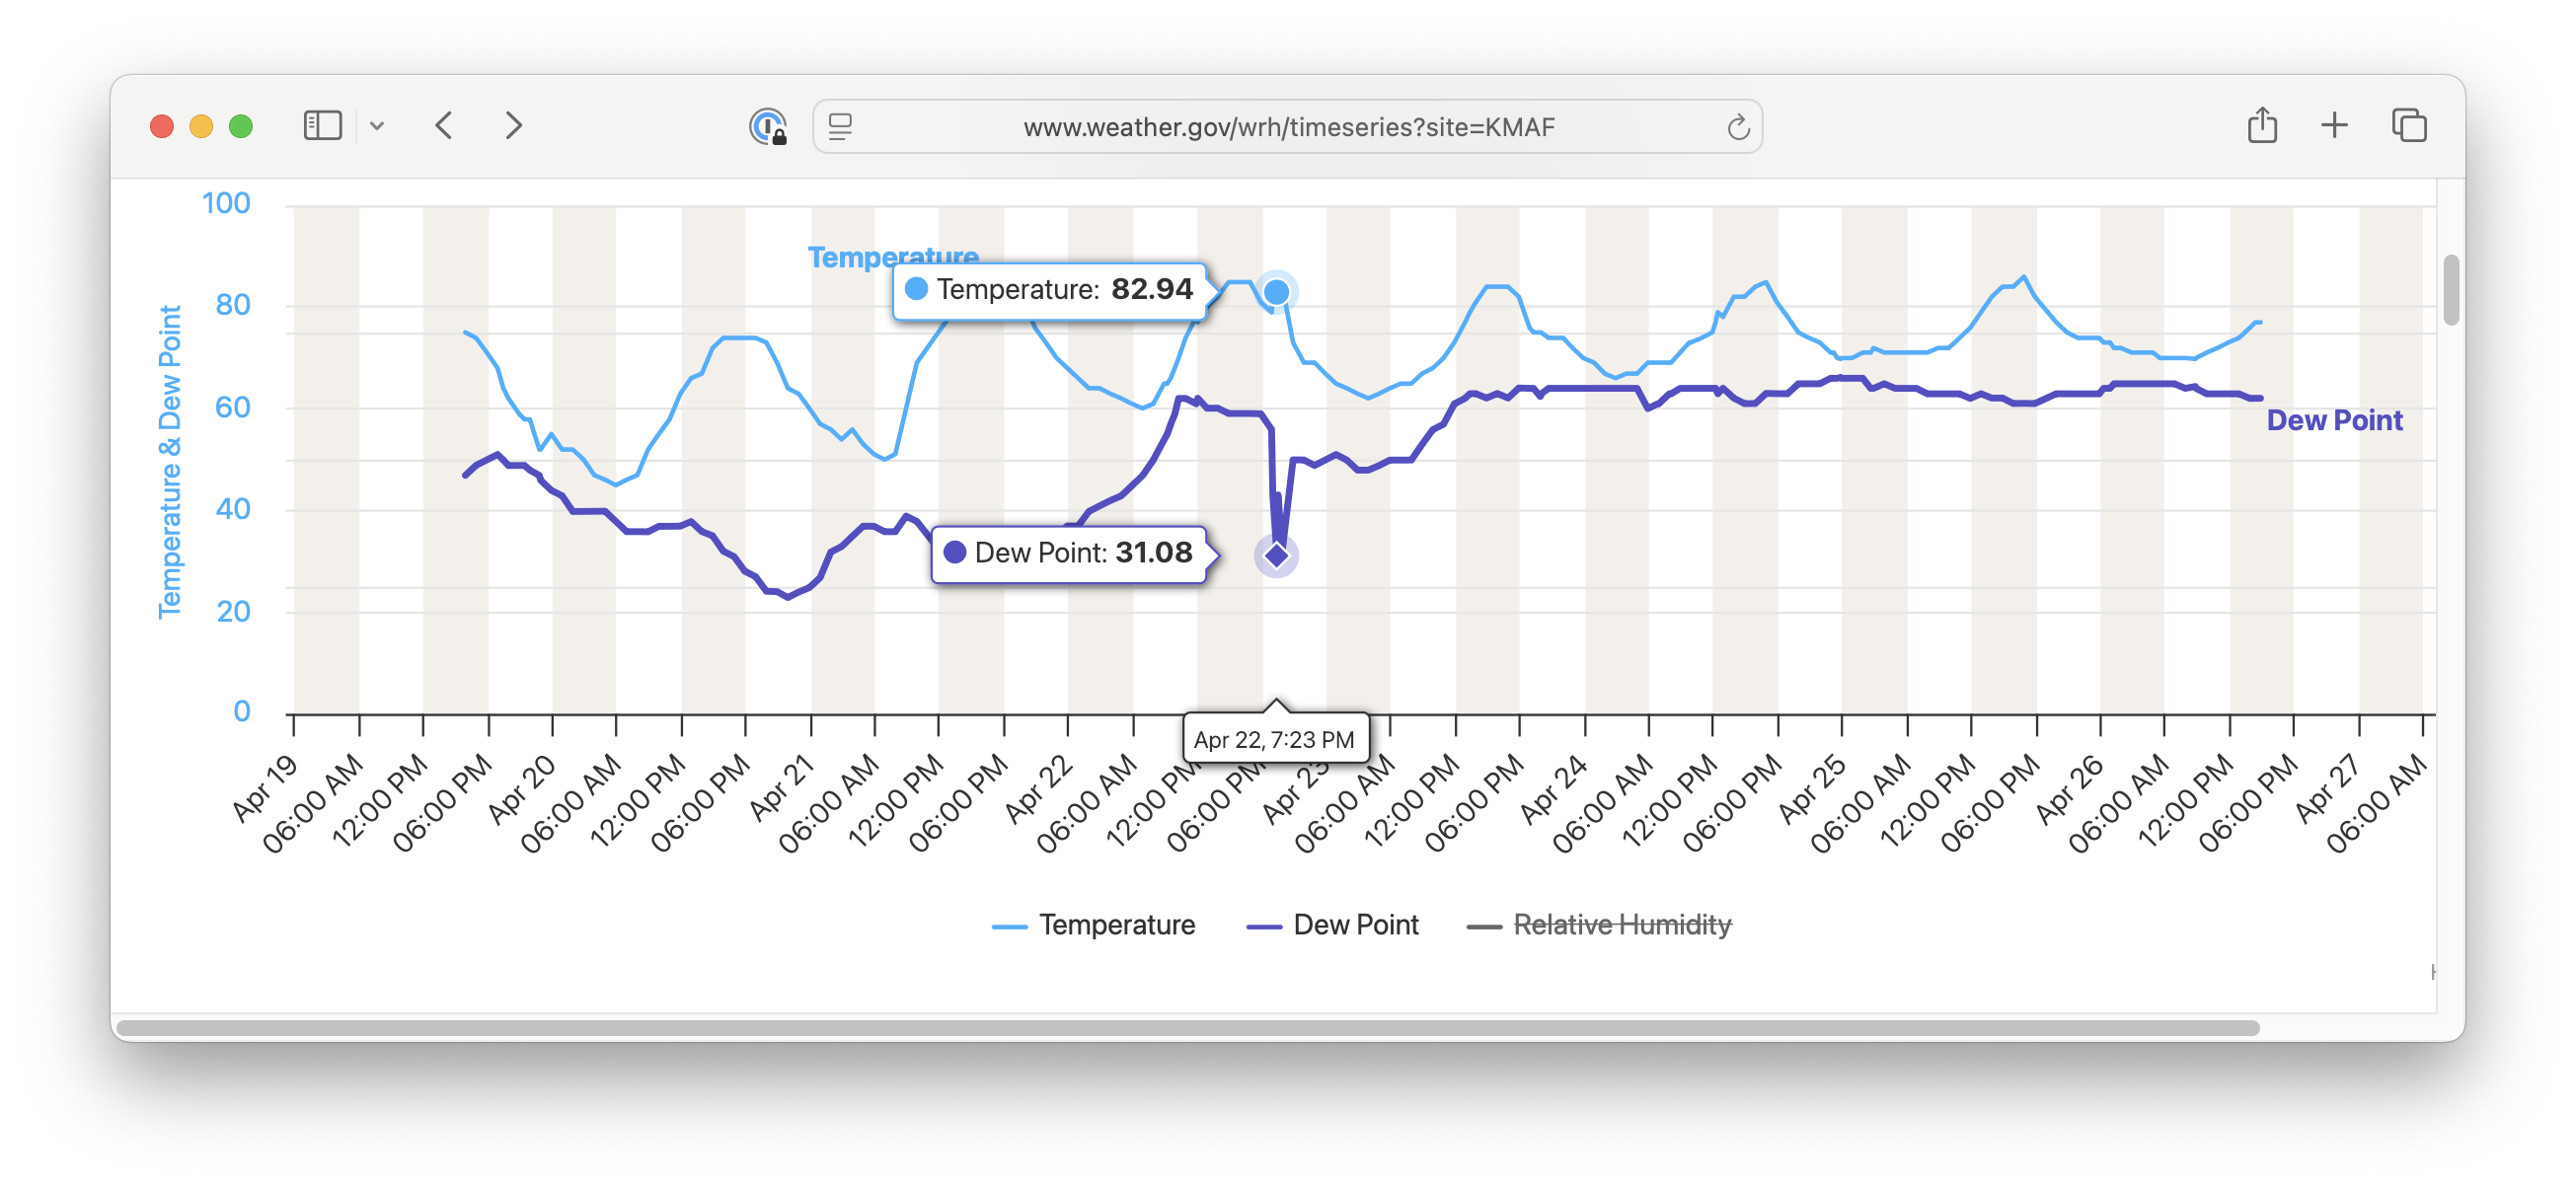
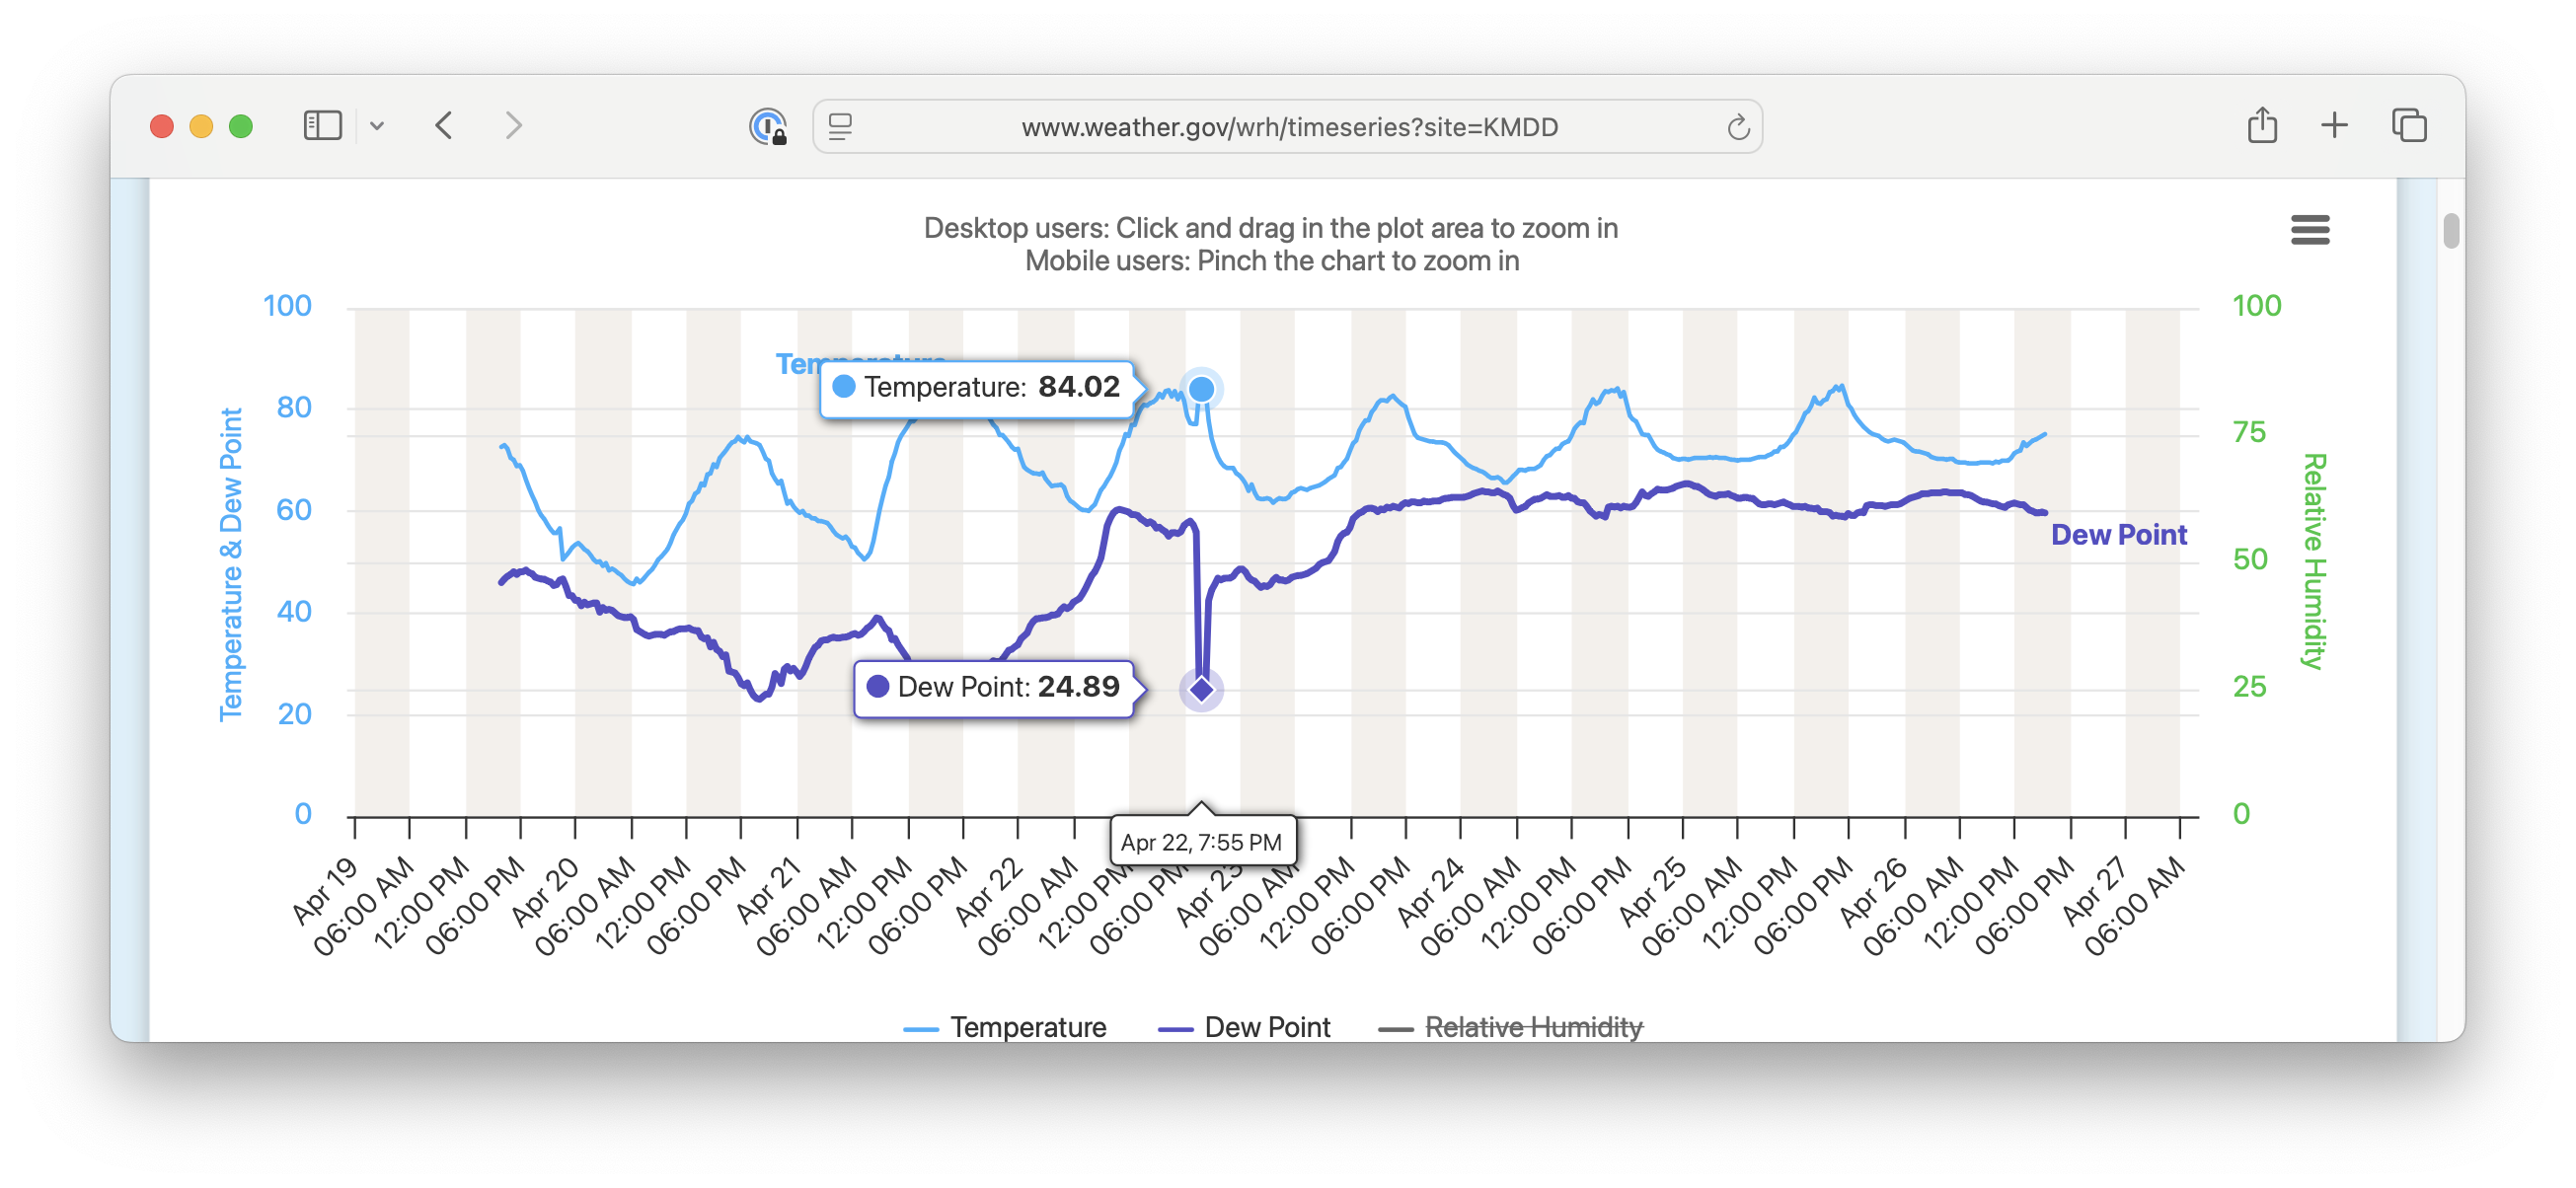
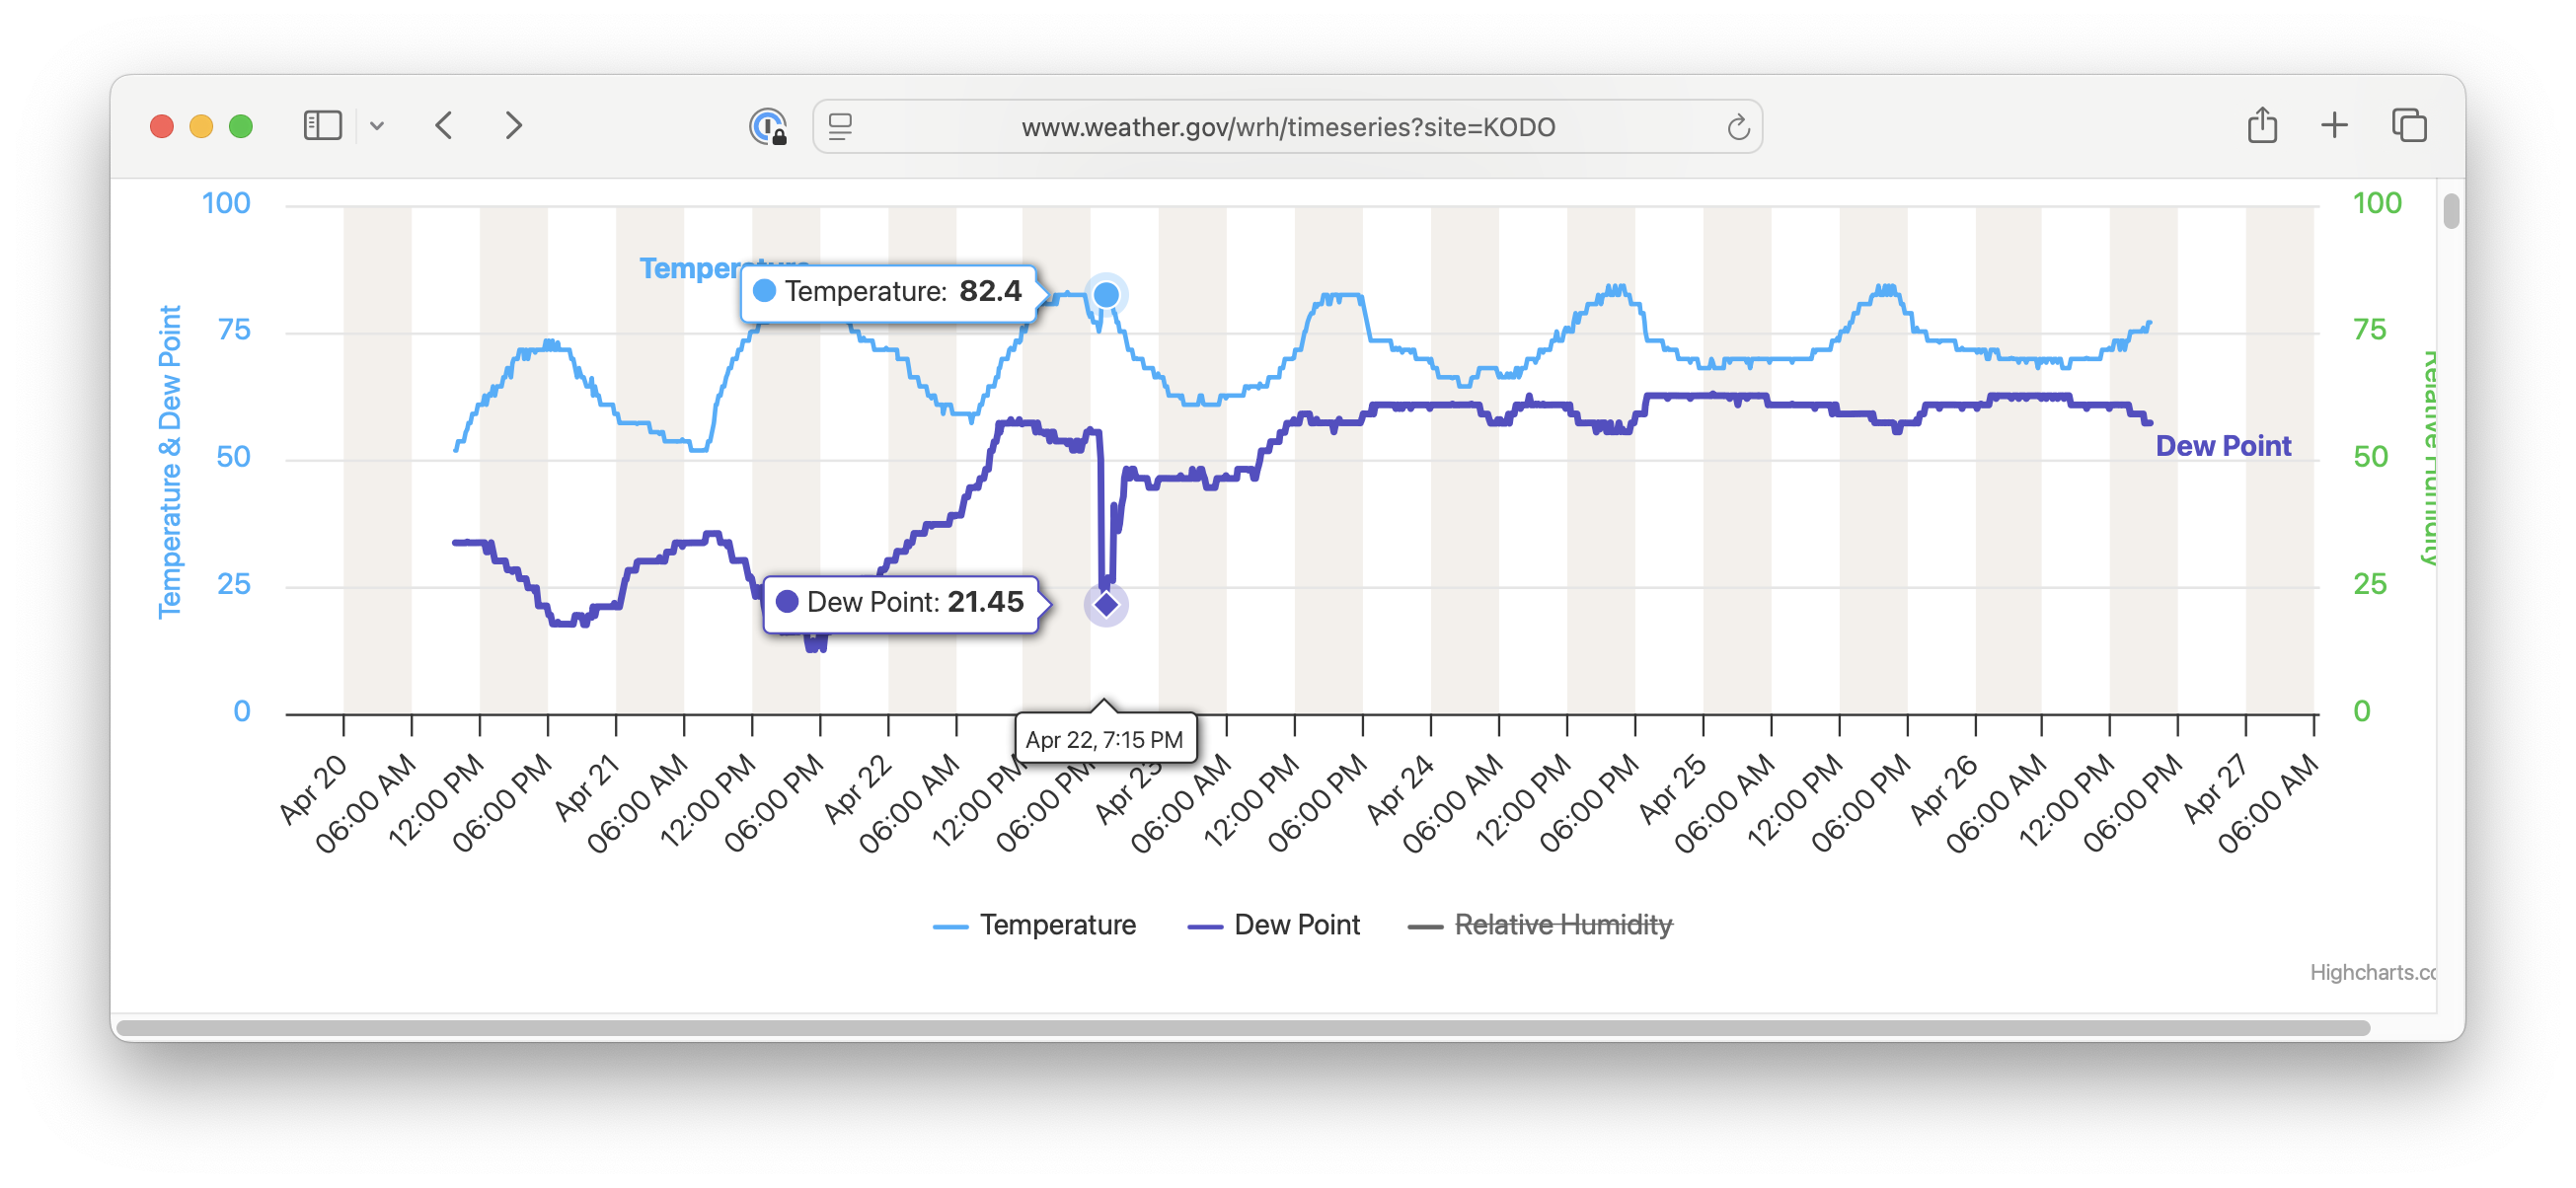
Scott Bachmeier, CIMSS, notes that the 1-minute GOES-19 Mesoscale Sector True Color RGB imagery did a great job of capturing the small outflow boundary highlighted above (the animation below is from the CSPP Geosphere site). In addition, surface observation data from Midland International Airport KMAF indicated that strong winds gusting to 53 kts at 2359 UTC (5 minutes before the 97 kts/111 mph microburst gust at 0004 UTC) were creating blowing dust that restricted visibility to 1 mile — and also showed that virga within the descending microburst created a brief period of rain (from 0006-0016 UTC) that left a trace of precipitation. Dry air associated with the microburst created notable brief drops in dew point (along with a slight rise in air temperature) at the Midland International KMAF, Midland KMDD and Odessa KODO METAR sites.
GOES-19 True Color/Night Microphysics blend, 2300 UTC 22 April 2025 – 0100 UTC 23 April 2025
Thanks to Lee Cronce, CIMSS, for his help in getting the (now historical) NUCAPS profiles to plot.


