Exceptionally strong isolated downburst over west Texas
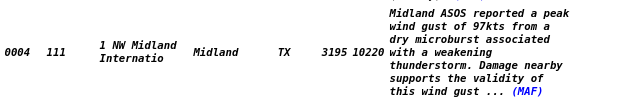
SPC Storm reports for 1200 UTC 22 April – 1200 UTC 23 April 2025 (here) included an observation of very strong winds at the Midland Airport as shown below. (See also this link).
What did the satellite imagery for this storm show? GOES-16 CONUS visible imagery, below, shows the evolution of the thunderstorm responsible for the downburst. As noted in the storm reports, it’s weakening.
Careful inspection of the visible imagery at the end of the animation suggests the arc of an outflow boundary to the west of Odessa. Perhaps more than one strong downdraft was occurring in this environment.
GOES-19 Infrared imagery (Band 13, 10.3 µm) also shows the weakening convection.
GOES-West (GOES-18) also viewed the convection. However, west Texas is outside the GOES-West CONUS/PACUS sector with its routine 5-minute scanning, and only Full Disk imagery (every 10 minutes) is routinely available.
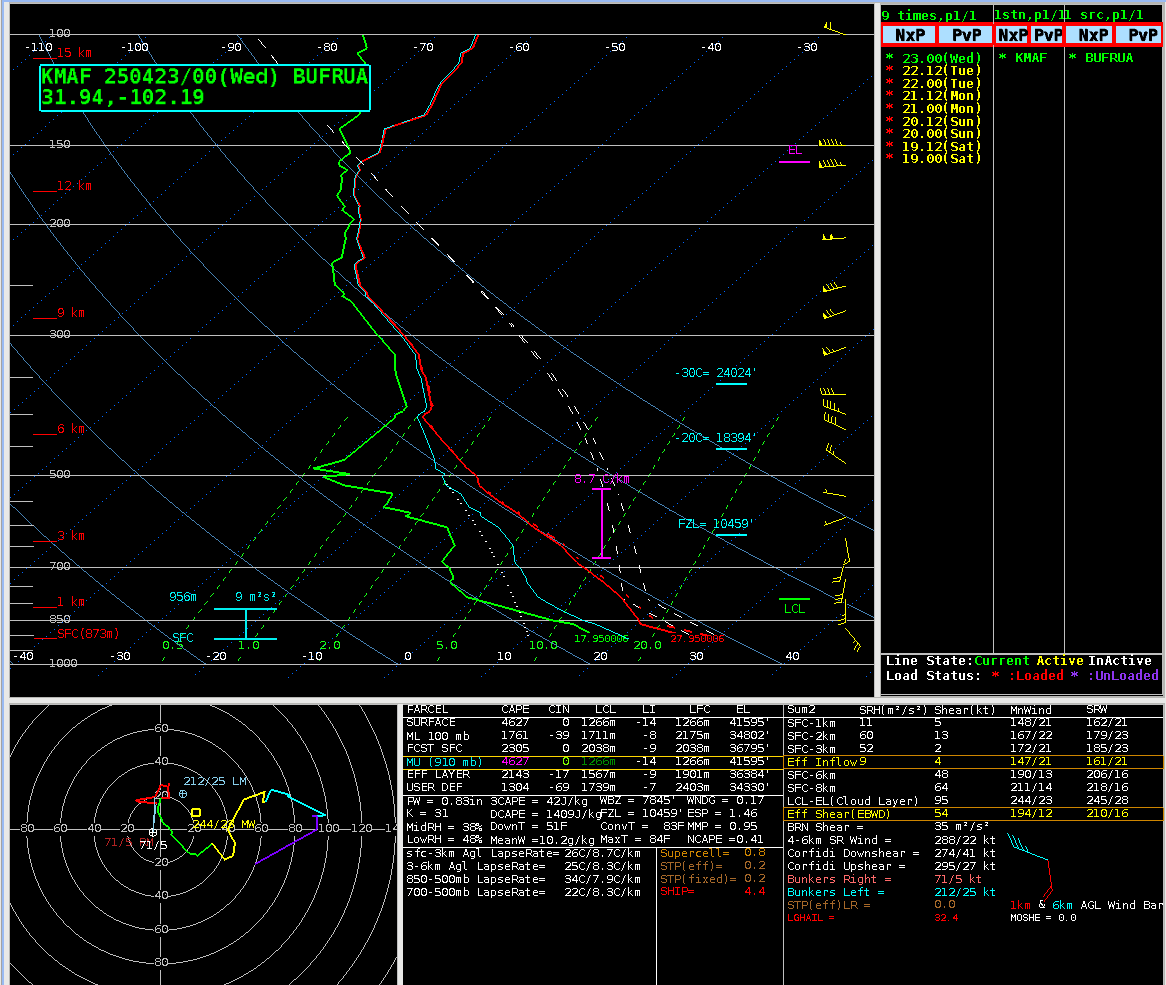
What was the thermodynamic structure over west Texas at this time? Midland did launch a radiosonde, and the 0000 UTC 23 April 2025 sounding is shown below, and also available here, from the handy Wyoming Sounding website. Of note is the very steep lapse rate from 500-mb down to the surface!
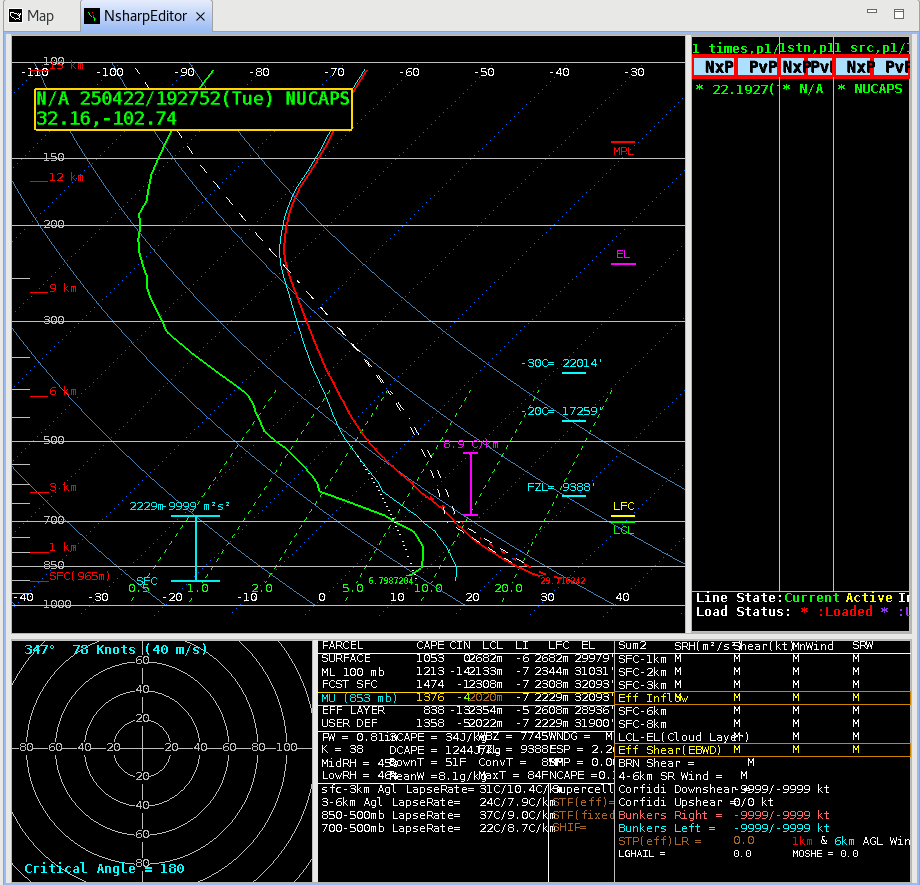
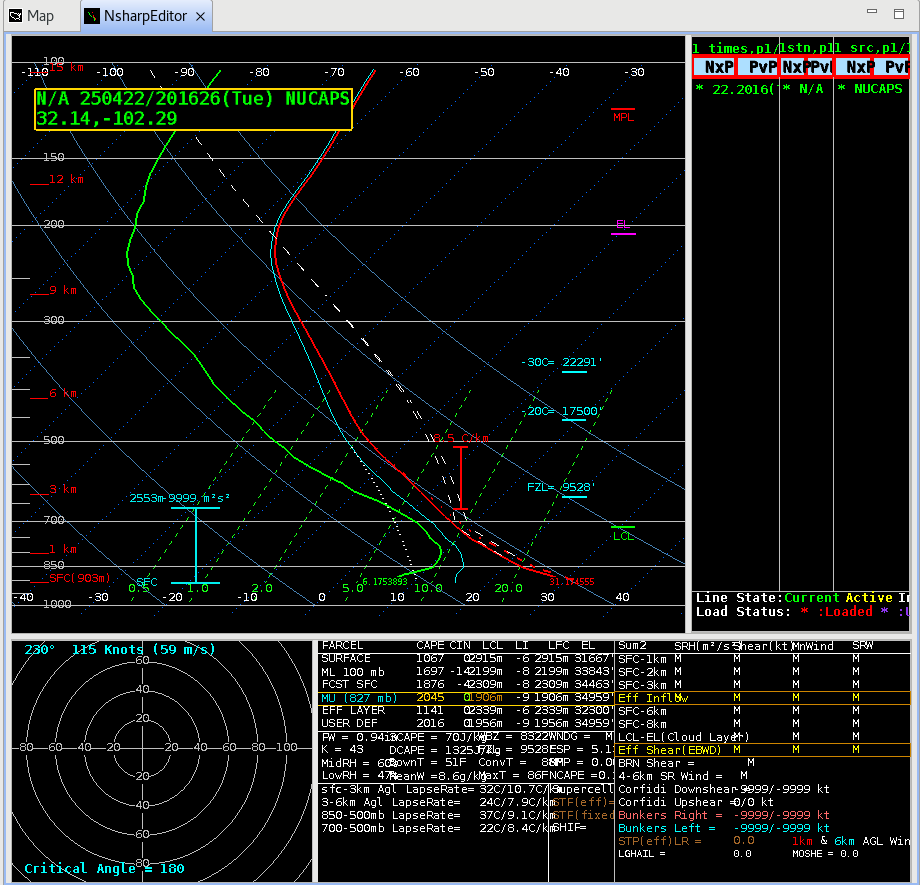
Both NOAA-21 (at 1925 UTC) and NOAA-20 (at 2014 UTC) overflew west Texas late in the afternoon on 22 April 2025, and NUCAPS profiles were produced over this unstable environment. The slider below compares the lapse rate (oC) between 800 and 600 mb (imagery was created with polar2grid as described in this blog post); the atmosphere shows very strong lapse rates over west Texas, in agreement with the one radisonde above!
NUCAPS Sounding Availability fields from AWIPS on 22 April 2025 (below) show the following points available. Over west Texas, valid profiles (in green: that is, the retrieval converged to a solution) are indicated.
NUCAPS profiles at the closest point northwest of Midland are shown below at 1927 UTC (NOAA-21) and 2016 UTC (NOAA-20). As in the KMAF radiosonde above, a neutral atmosphere up to 500 mb is apparent at both times.
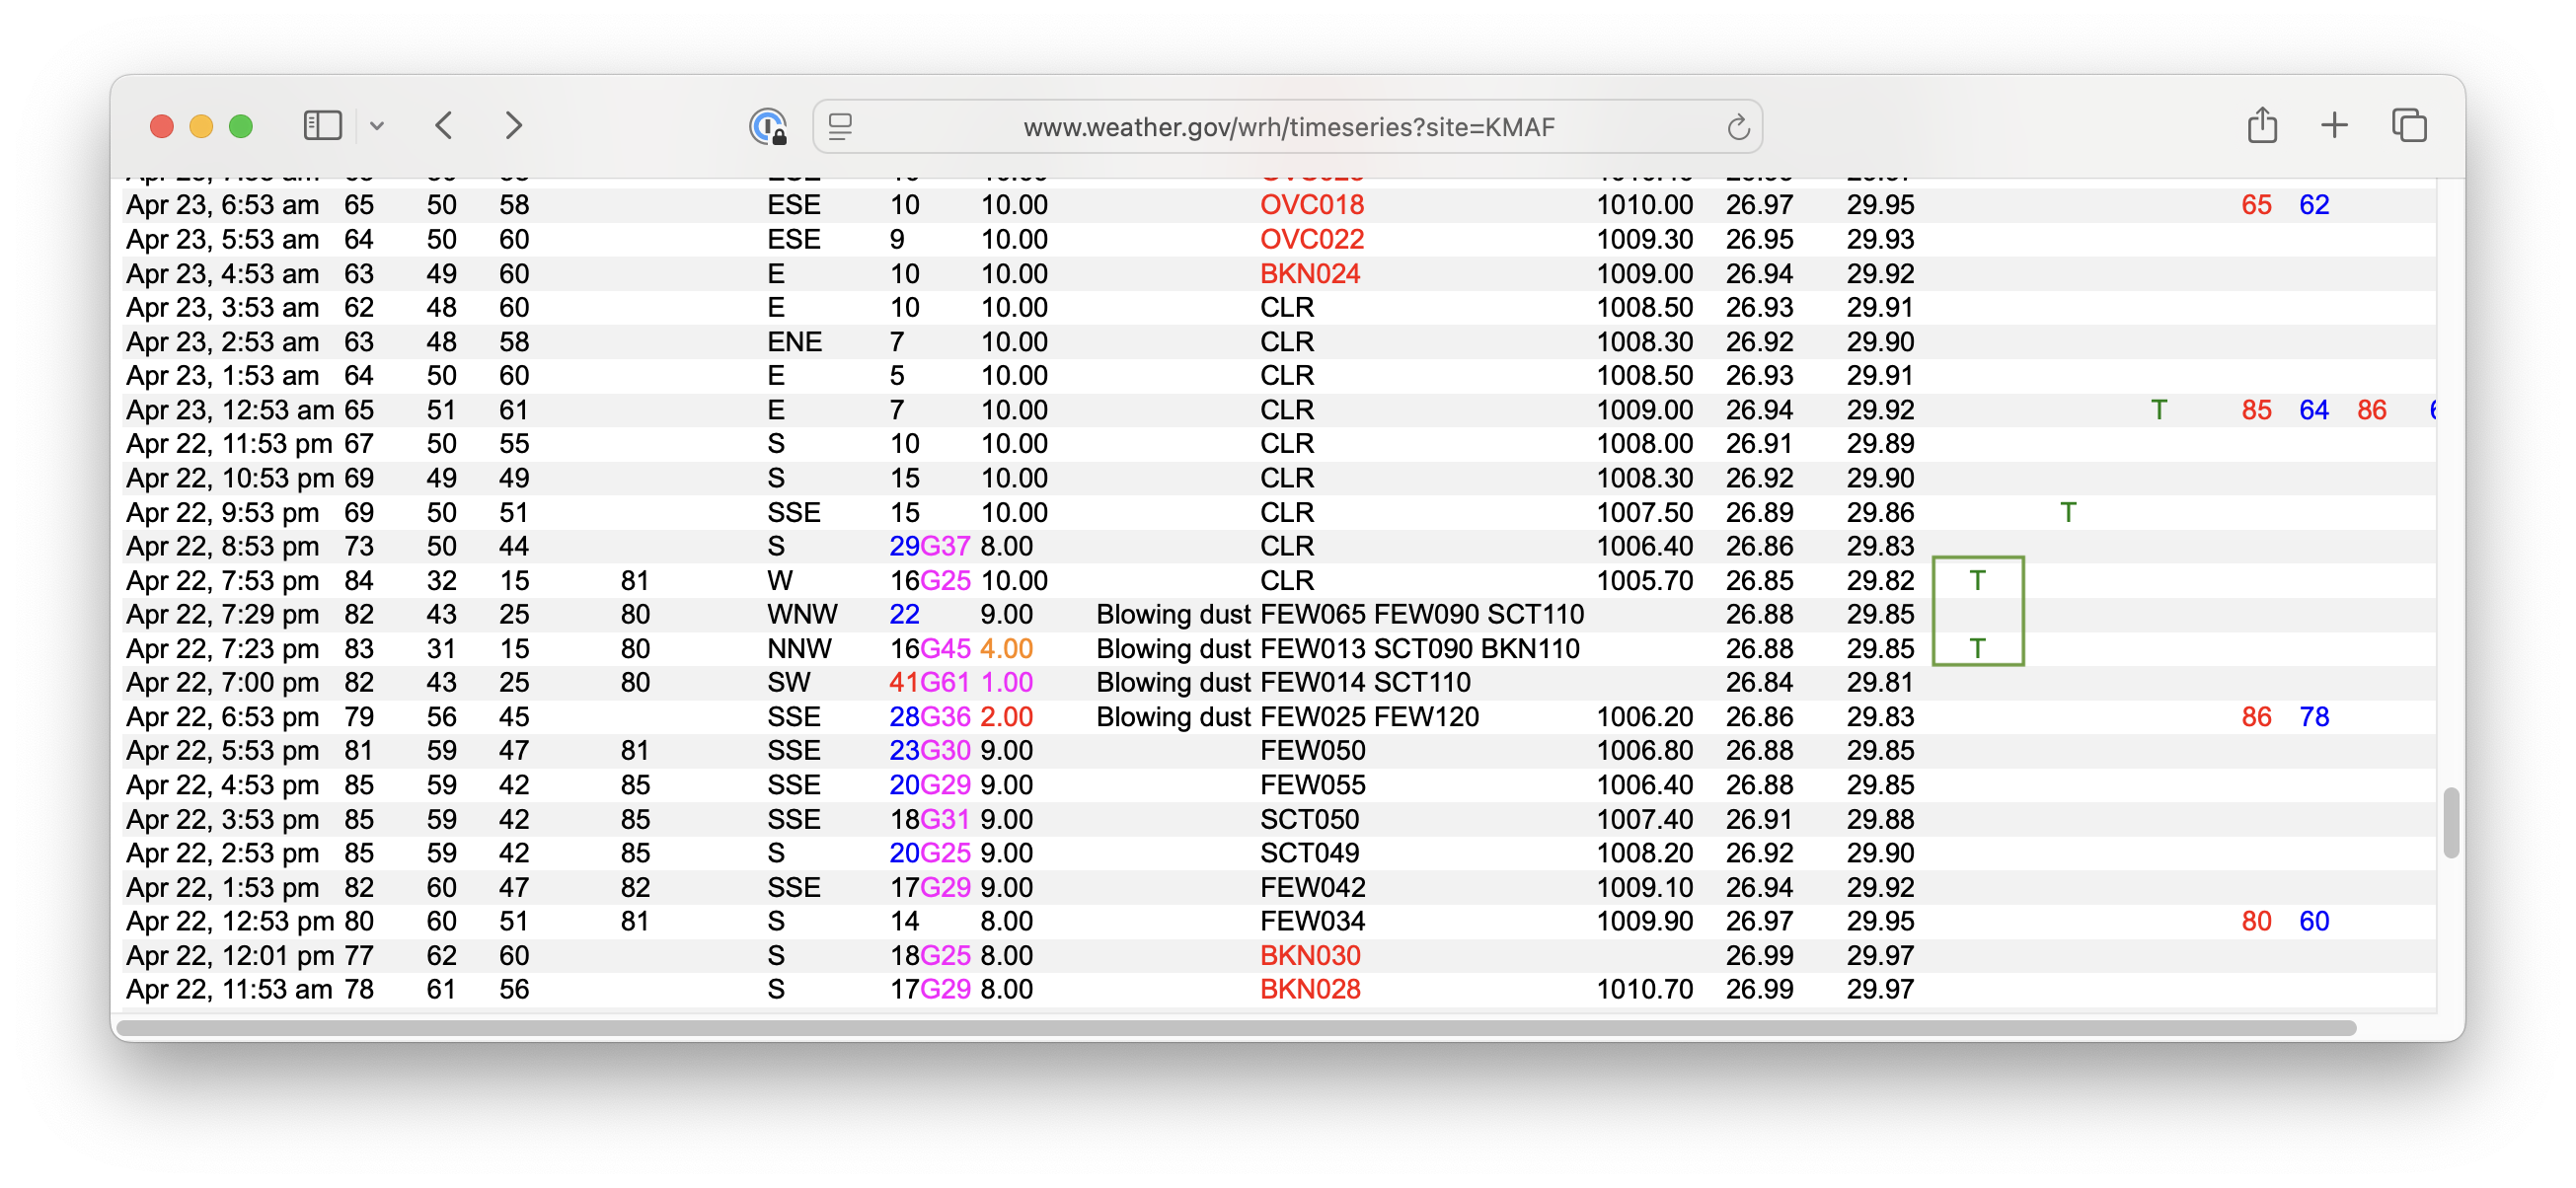
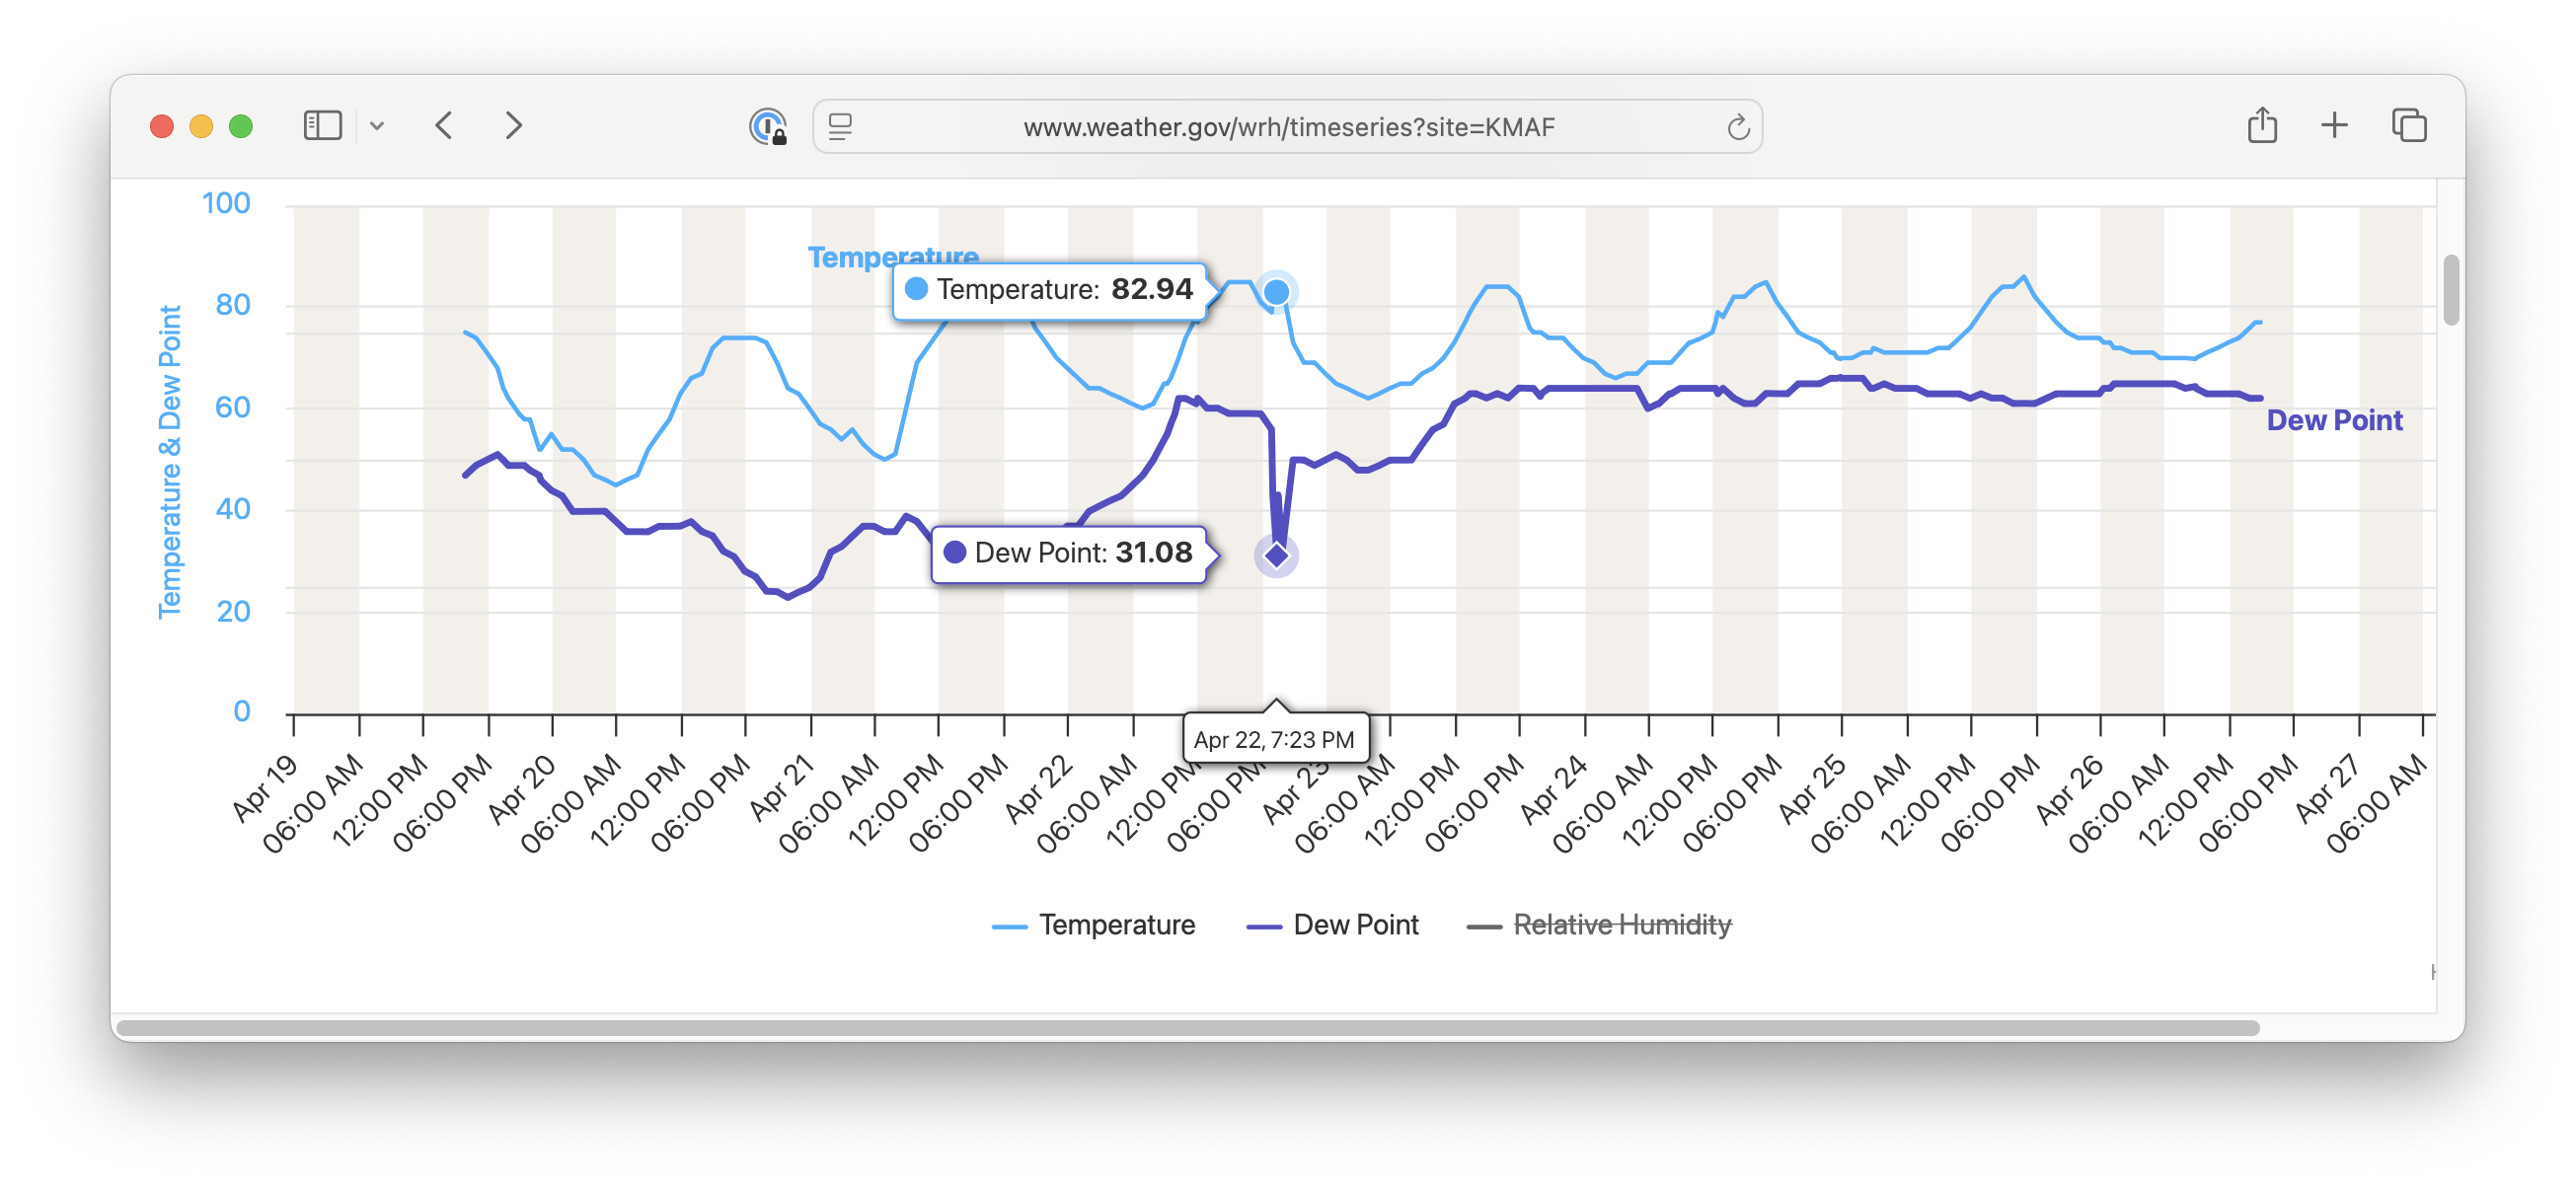
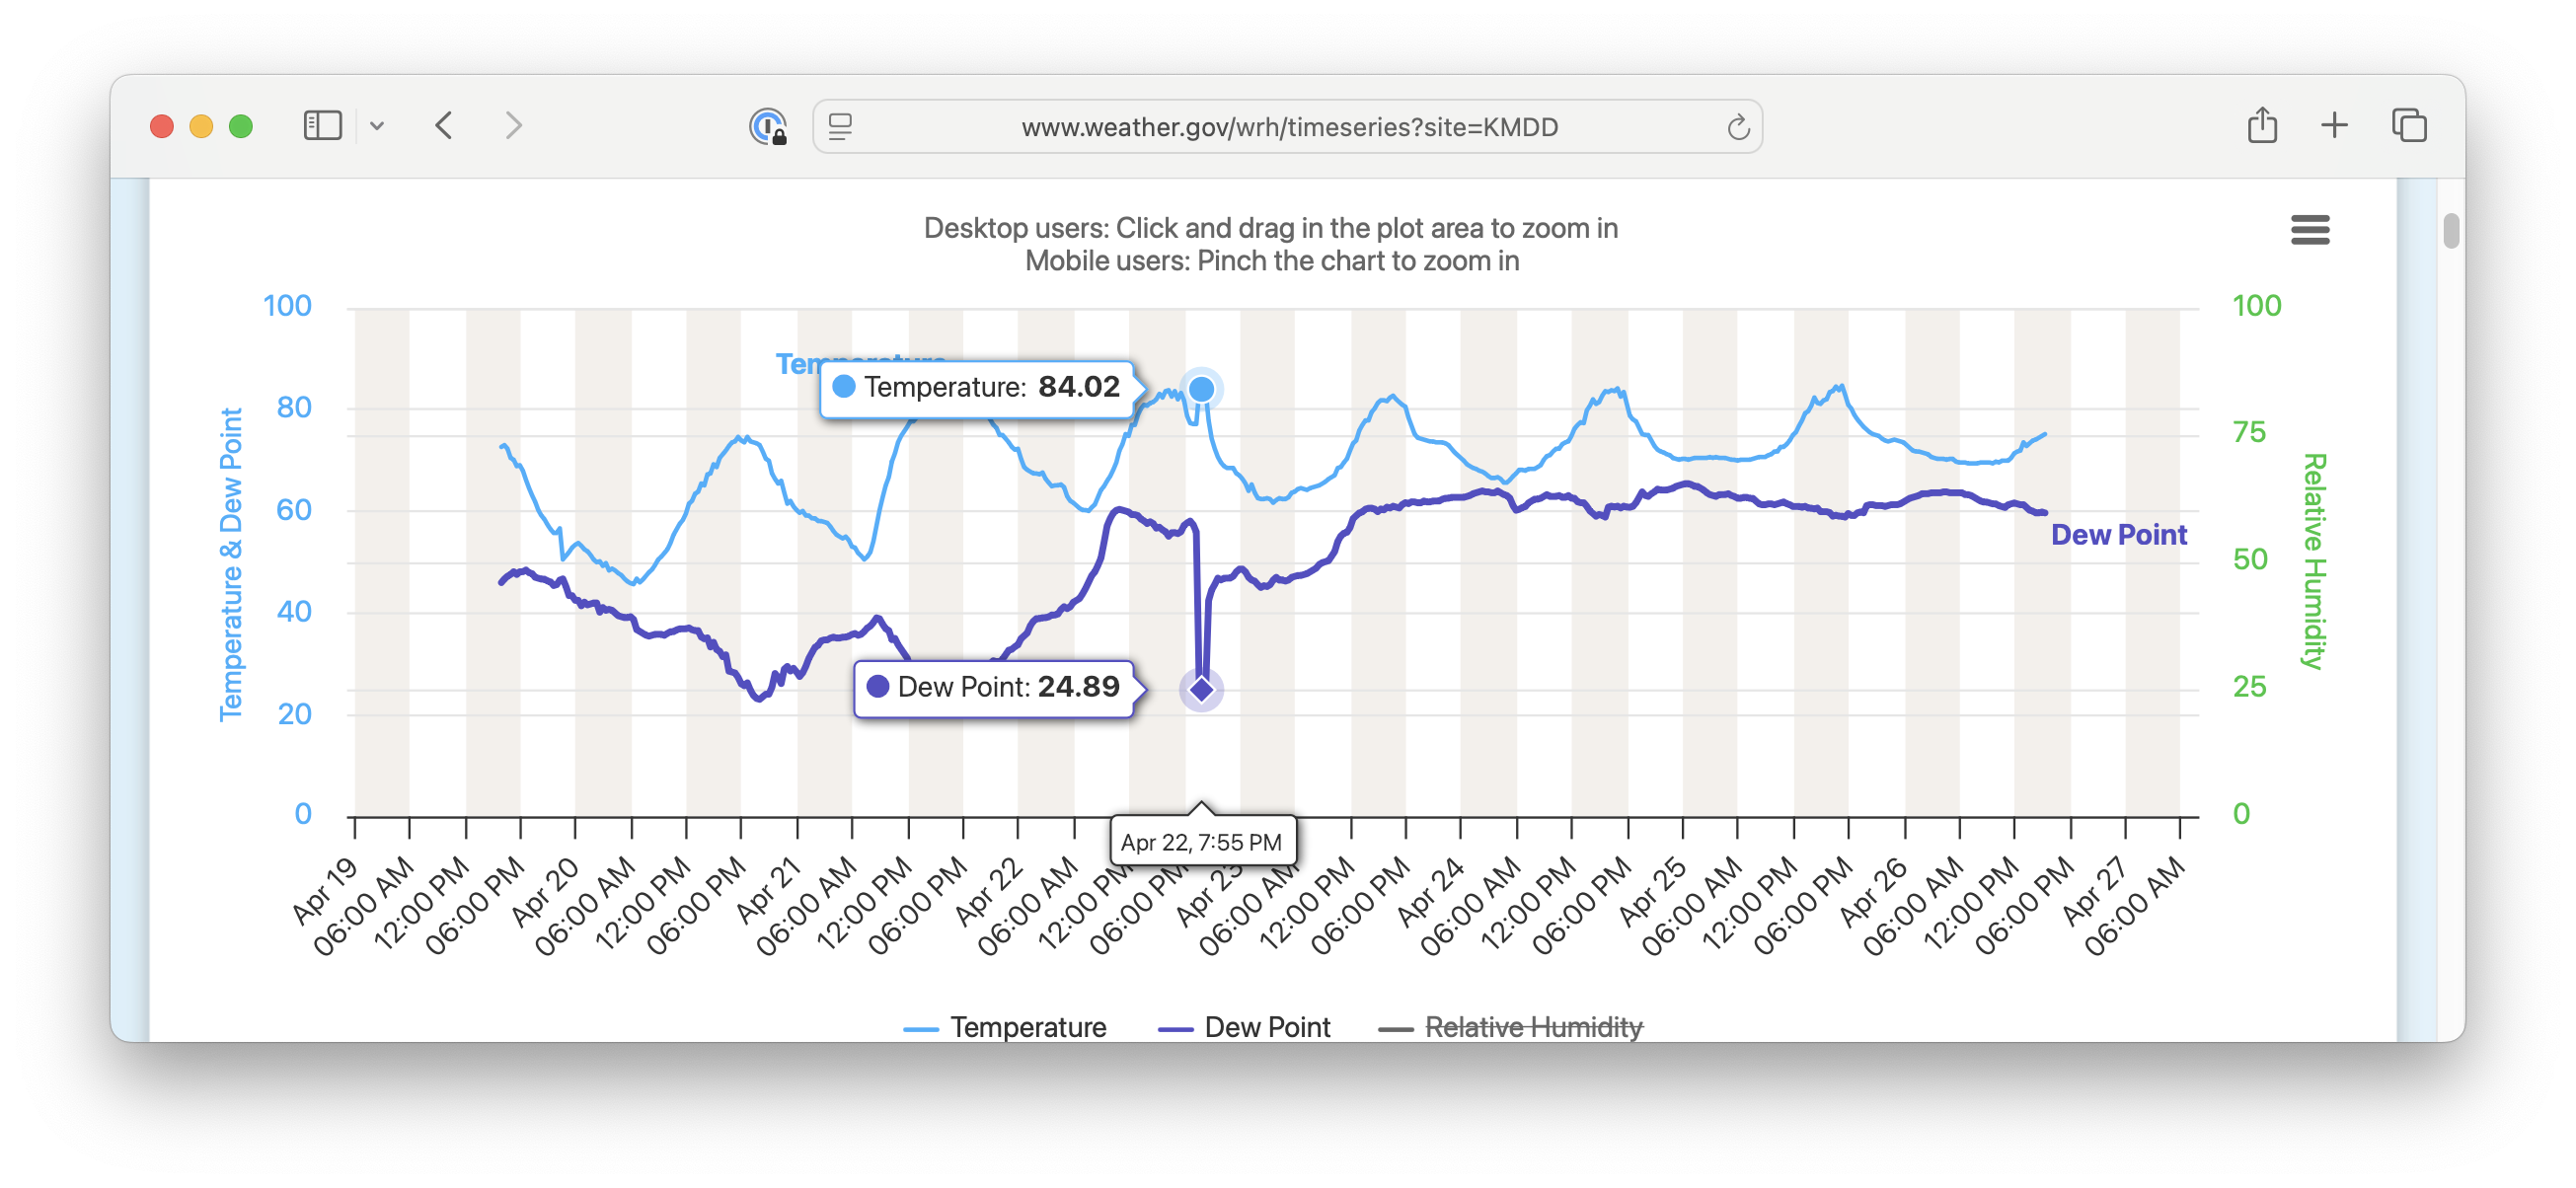
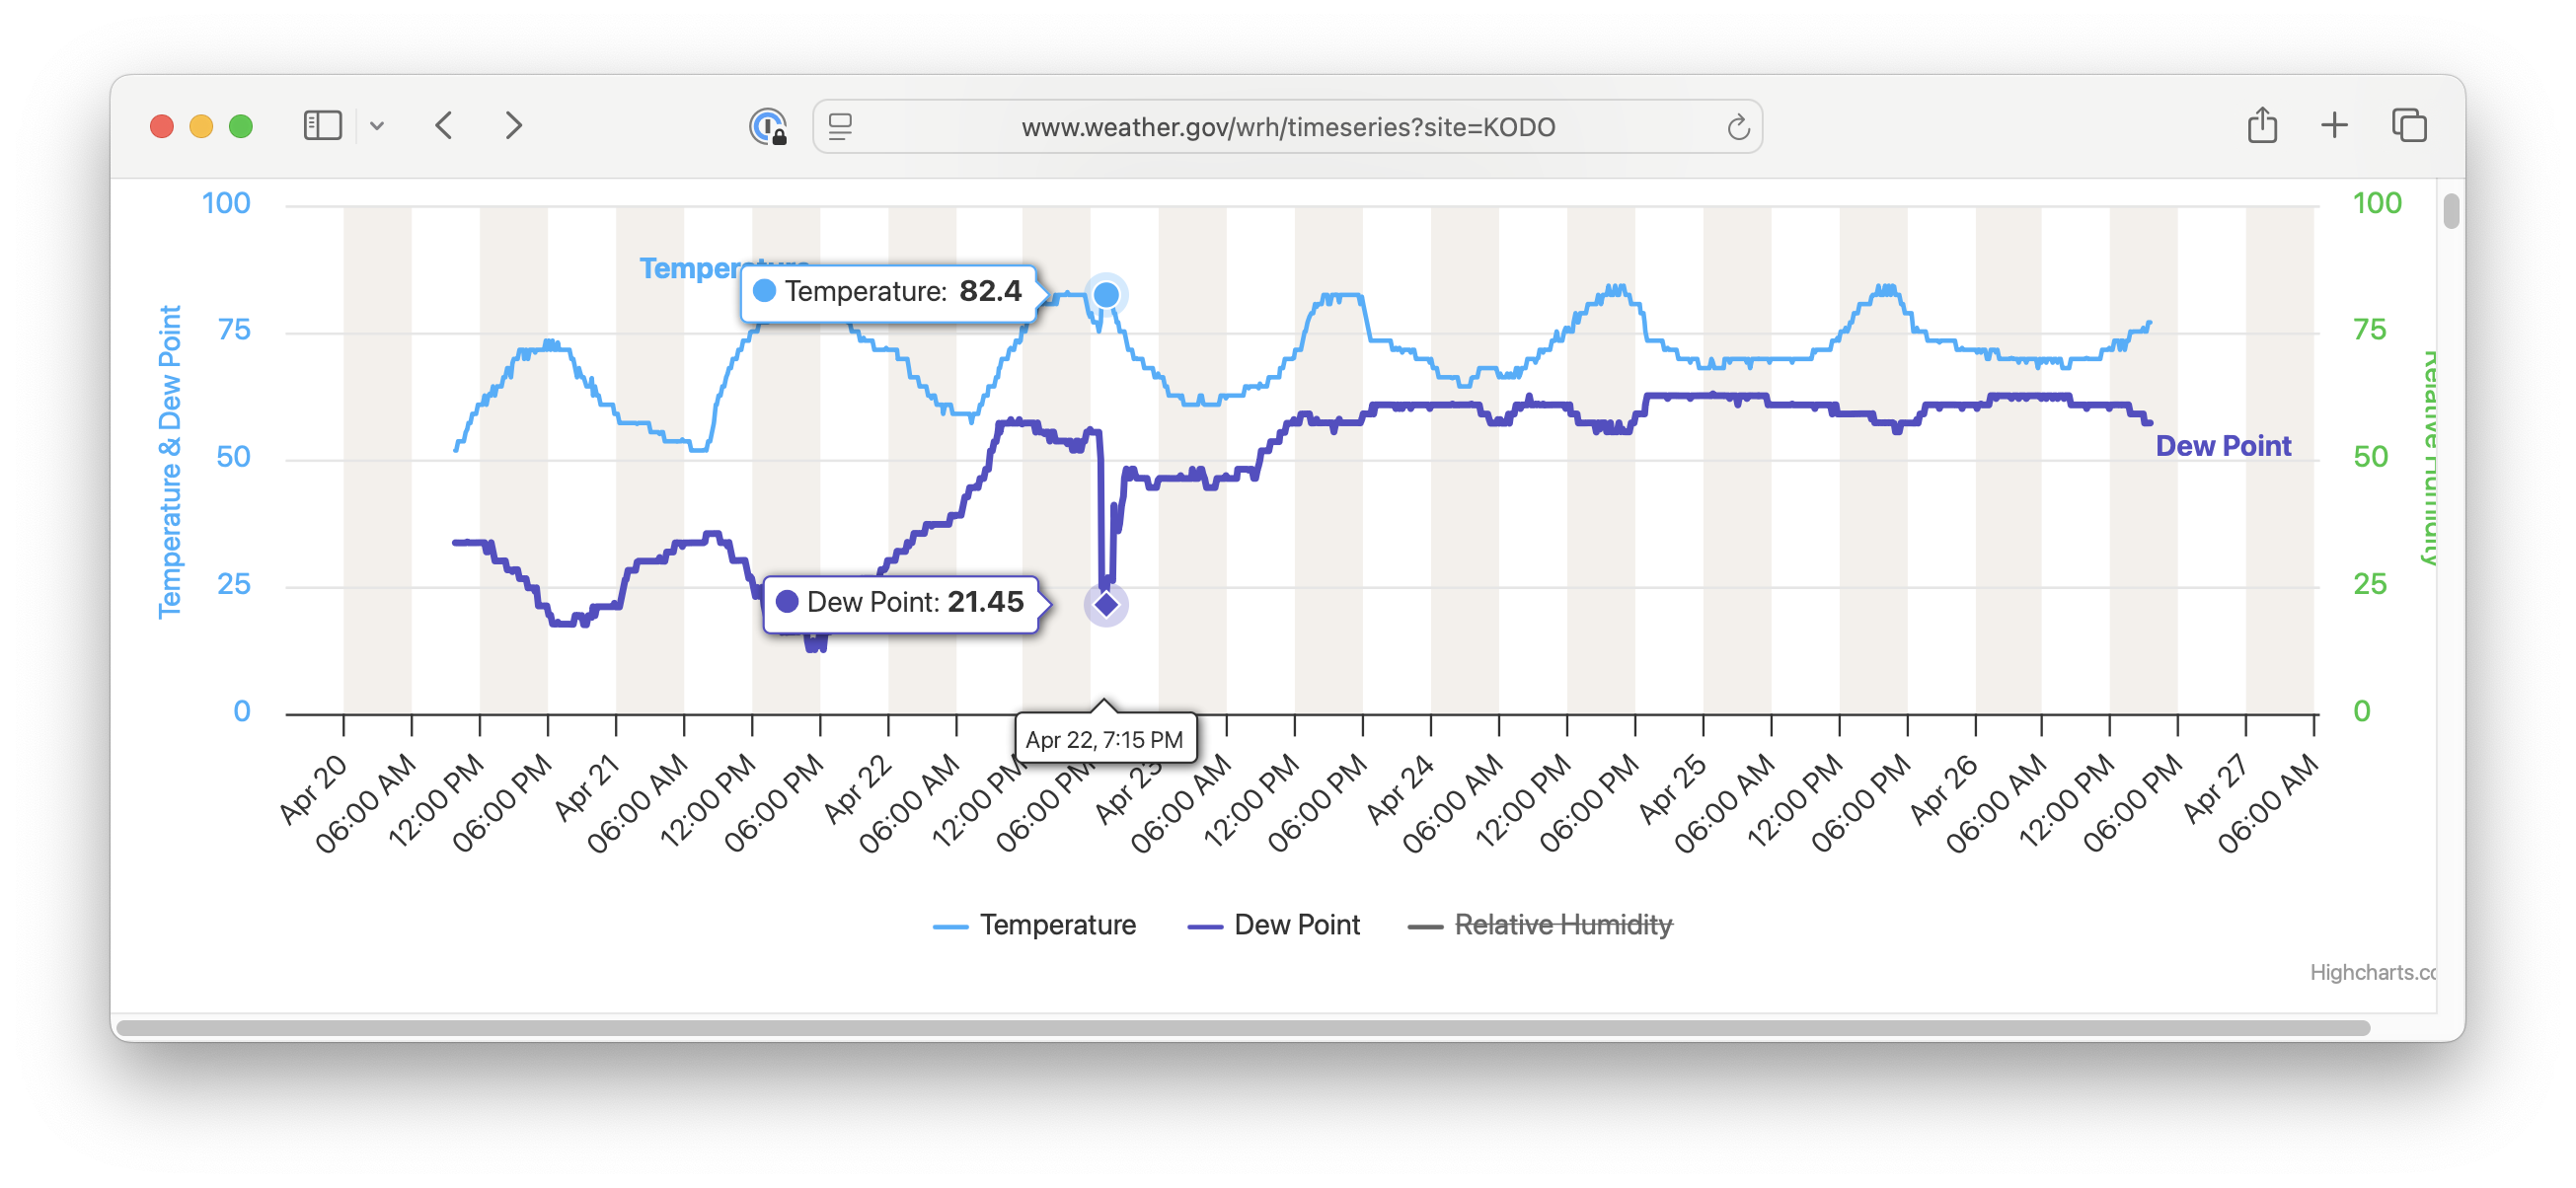
Scott Bachmeier, CIMSS, notes that the 1-minute GOES-19 Mesoscale Sector True Color RGB imagery did a great job of capturing the small outflow boundary highlighted above (the animation below is from the CSPP Geosphere site). In addition, surface observation data from Midland International Airport KMAF indicated that strong winds gusting to 53 kts at 2359 UTC (5 minutes before the 97 kts/111 mph microburst gust at 0004 UTC) were creating blowing dust that restricted visibility to 1 mile — and also showed that virga within the descending microburst created a brief period of rain (from 0006-0016 UTC) that left a trace of precipitation. Dry air associated with the microburst created notable brief drops in dew point (along with a slight rise in air temperature) at the Midland International KMAF, Midland KMDD and Odessa KODO METAR sites.
Thanks to Lee Cronce, CIMSS, for his help in getting the (now historical) NUCAPS profiles to plot.