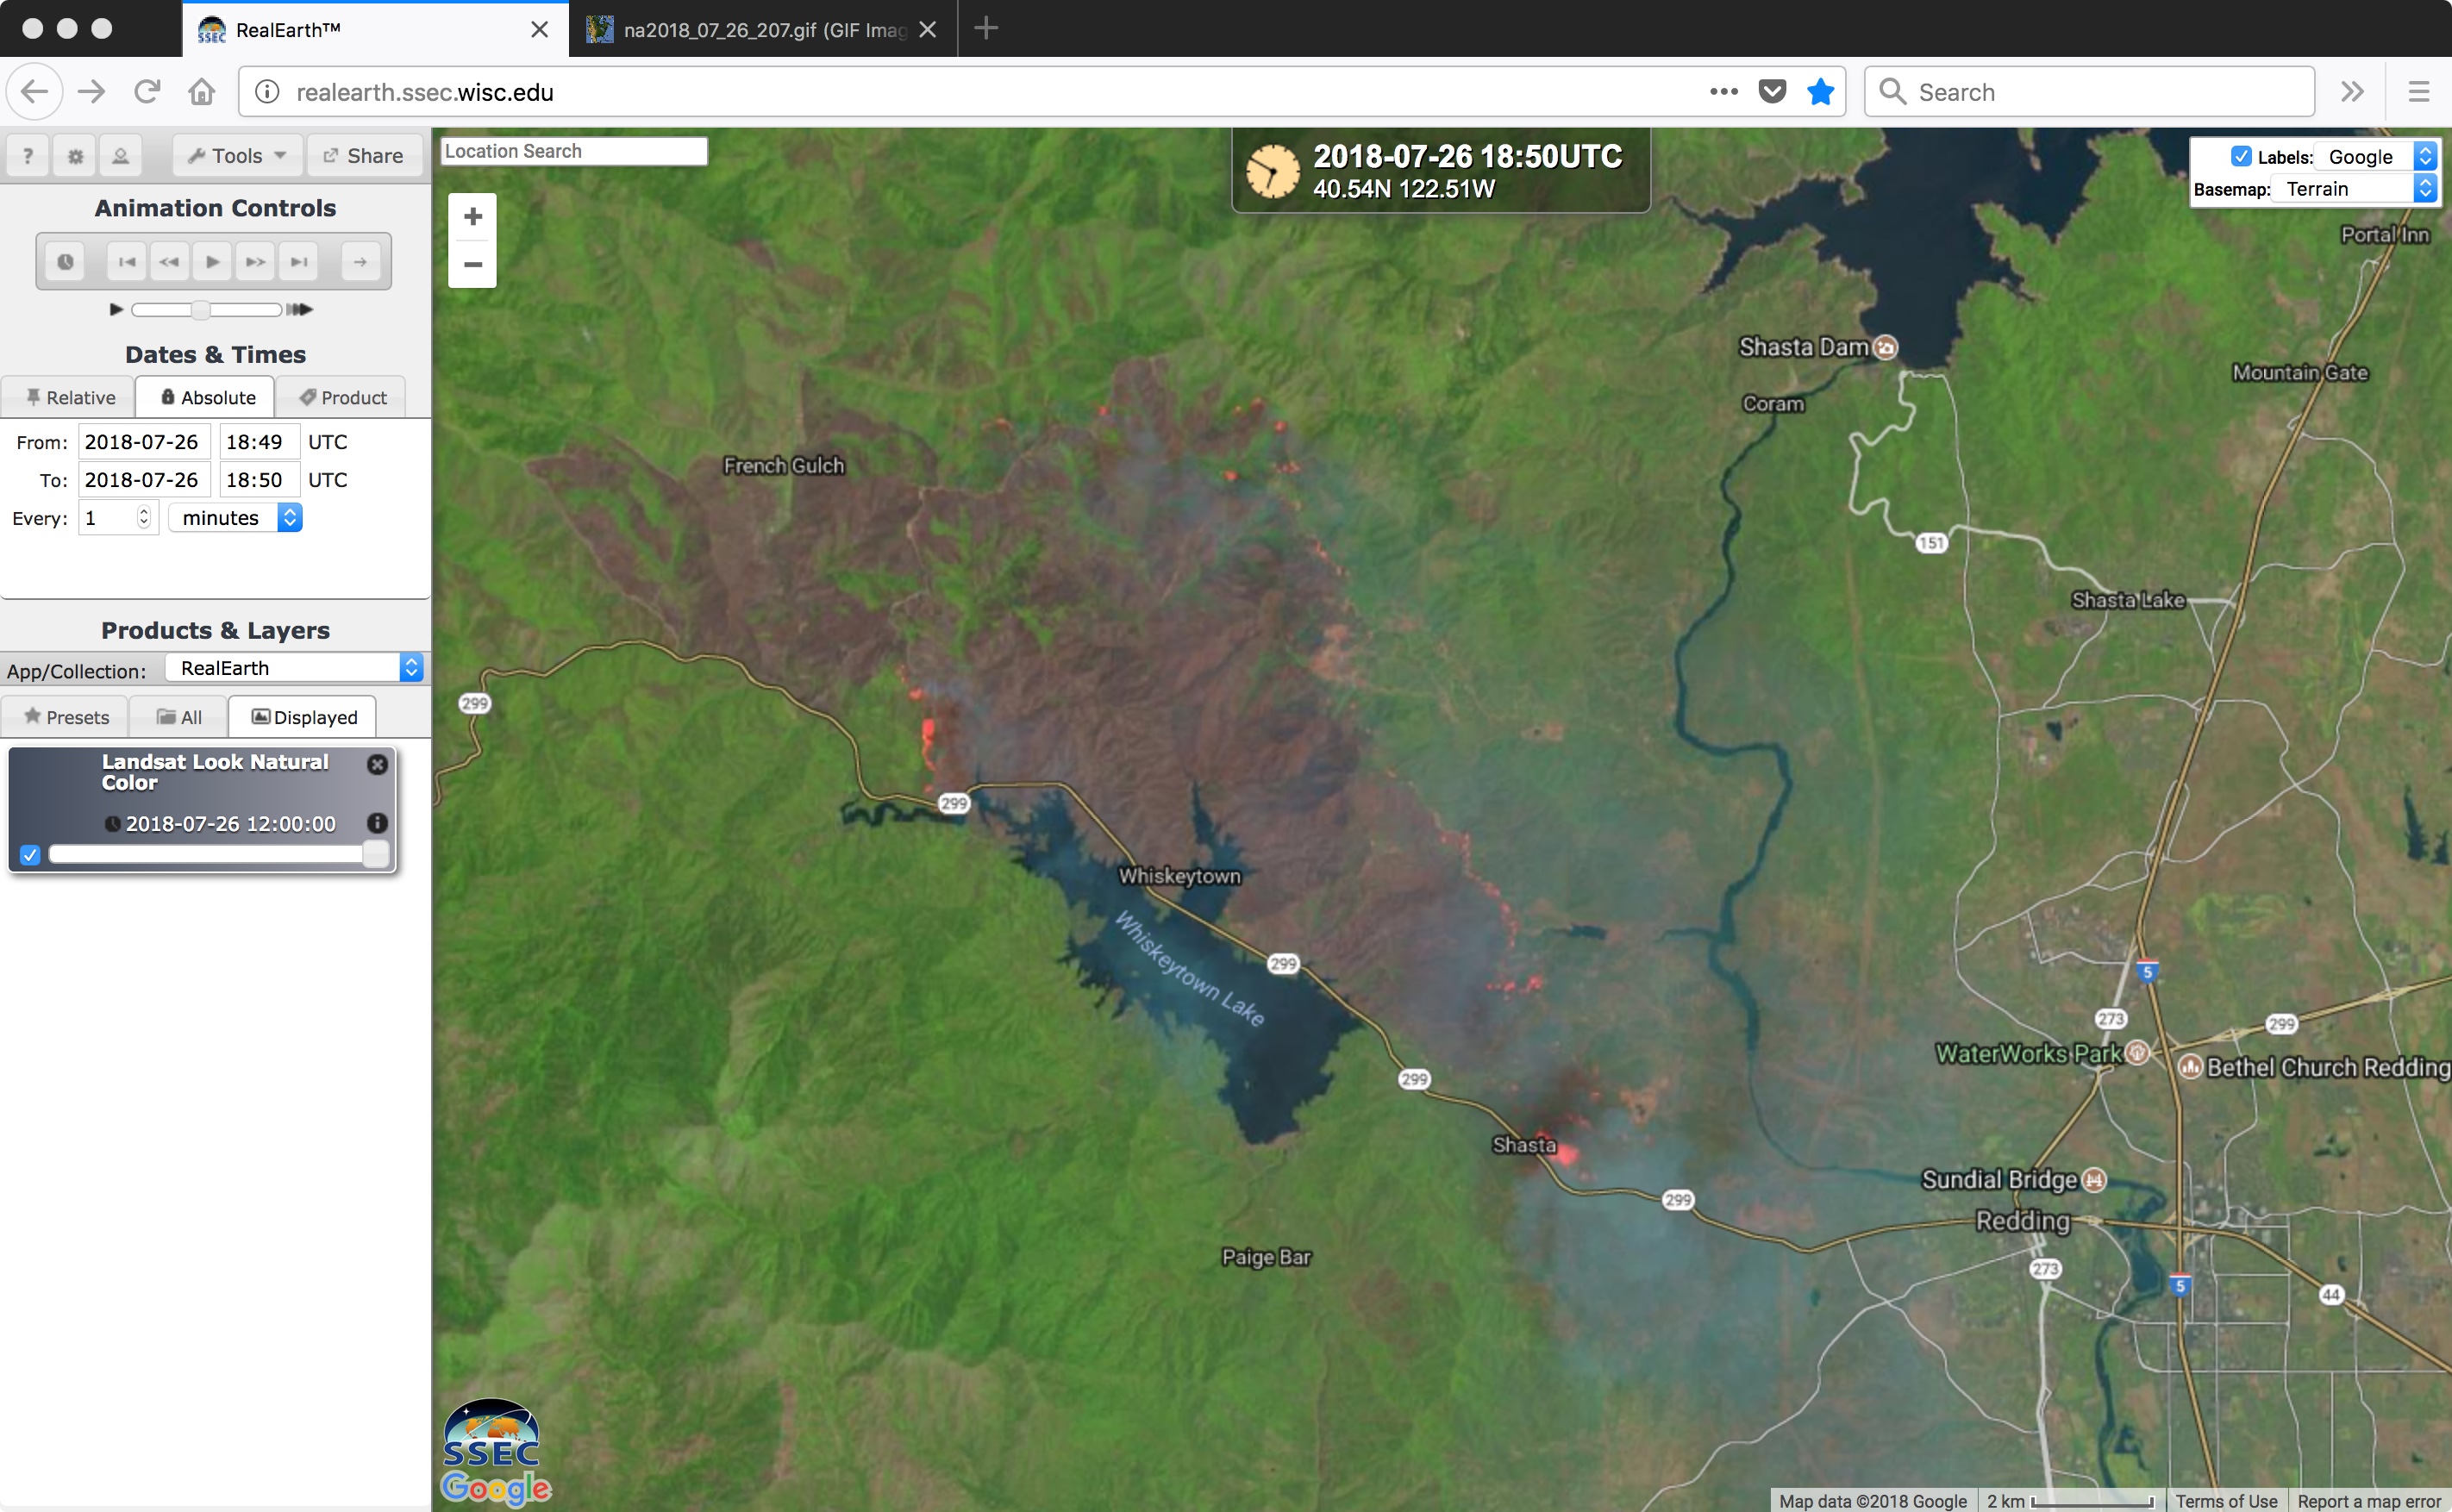
1-minute Mesoscale Domain Sector GOES-16 (GOES-East) “Red” Visible (0.64 µm) and Shortwave Infrared (3.9 µm) images (above) showed the large thermal anomaly or “hot spot” (cluster of red pixels) associated with the Carr Fire in northern California as it produced a pyrocumulonimbus (pyroCb) cloud during the afternoon hours on 27 July 2018. A 30-meter resolution Landsat-8 False Color image from... Read More
GOES-16 “Red” Visible (0.64 µm, left) and Shortwave Infrared (3.9 µm, right) images [click to play MP4 animation]
1-minute
Mesoscale Domain Sector GOES-16
(GOES-East) “Red” Visible (
0.64 µm) and Shortwave Infrared (
3.9 µm) images
(above) showed the large thermal anomaly or “hot spot”
(cluster of red pixels) associated with the
Carr Fire in northern California as it produced a pyrocumulonimbus (pyroCb) cloud during the afternoon hours on
27 July 2018. A 30-meter resolution
Landsat-8 False Color image from the previous day showed the large size of the burn scar; extreme fire behavior on 27 July caused the Carr Fire to quickly increase in size and move closer to Redding CA, and also produce the pyroCb.
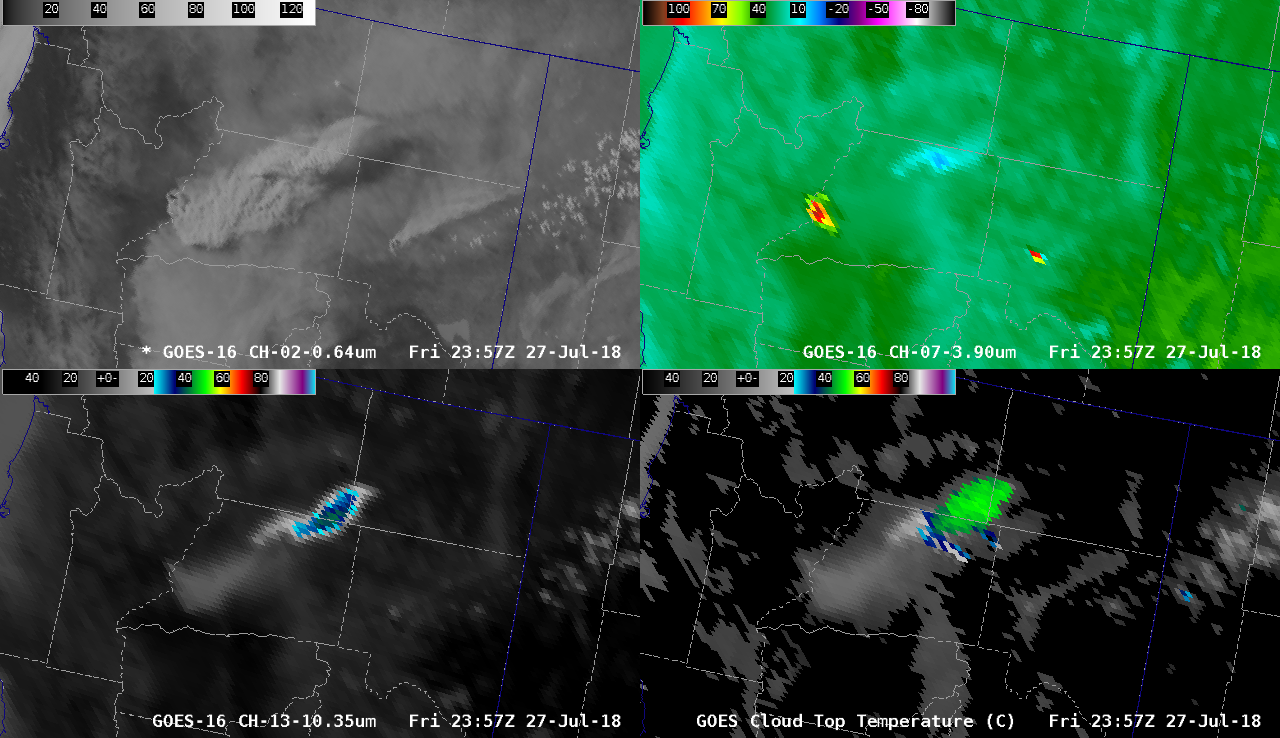
Another view using GOES-16 “Red” Visible, Shortwave Infrared, “Clean” Infrared Window (10.3 µm) and the Cloud Top Temperature product (below) showed the pyroCb cloud as it drifted rapidly northeast over Nevada and Oregon, along with a second (albeit smaller) pyroCb cloud which developed around 0130 UTC. One standard parameter used for defining a pyroCb cloud is a minimum cloud-top longwave infrared brightness temperature of -40ºC (ensuring complete glaciation) — and in this case with 1-minute imagery, the multi-spectral Cloud Top Temperature (CTT) product (FAQ) indicated that the pyroCb cloud reached the -40ºC threshold 19 minutes earlier than the 10.3 µm infrared imagery. From that point forward, the CTT product was consistently at least 5-10ºC colder than the 10.3 µm brightness temperature; the CTT product eventually displayed a minimum value of -53.9ºC over northeastern California. Even as the 10.3 µm brightness temperature began to rapidly warm after about 0100 UTC, the CTT product continued to display values in the -45 to -50ºC range (shades of green) which allowed for unambiguous tracking of the pyroCb.
![GOES-16 "Red" Visible (0.64 µm, top left), Shortwave Infrared (3.9 µm, top right), "Clean" Infrared Window (10.3 µm, bottom left) and Cloud Top Temperature product (bottom right) [click to play MP4 animation]](https://cimss.ssec.wisc.edu/satellite-blog/wp-content/uploads/sites/5/2018/07/Carr_Fire_CA-20180727_235756.png)
GOES-16 “Red” Visible (0.64 µm, top left), Shortwave Infrared (3.9 µm, top right), “Clean” Infrared Window (10.3 µm, bottom left) and Cloud Top Temperature product (bottom right) [click to play MP4 animation]
In the case of the second (smaller) pyroCb cloud that formed from the Carr Fire after 0130 UTC, the 10.3 µm brightness temperature failed to reach the -40ºC threshold, while the CTT product again displayed values in the -45 to -50ºC range. The coldest CTT value of -53.9ºC (seen with the initial pyroCb) roughly corresponded to an altitude of 12.5 km or 41,000 feet according to 00 UTC
rawinsonde data from Reno, Nevada
(below). Strong upper-tropospheric winds of 80-90 knots rapidly transported the pyroCb anvil northeastward.
![Plot of 00 UTC rawinsonde data from Reno, Nevada [click to enlarge]](https://cimss.ssec.wisc.edu/satellite-blog/wp-content/uploads/sites/5/2018/07/180728_00UTC_KREV_RAOB.GIF)
Plot of 00 UTC rawinsonde data from Reno, Nevada [click to enlarge]
View only this post
Read Less
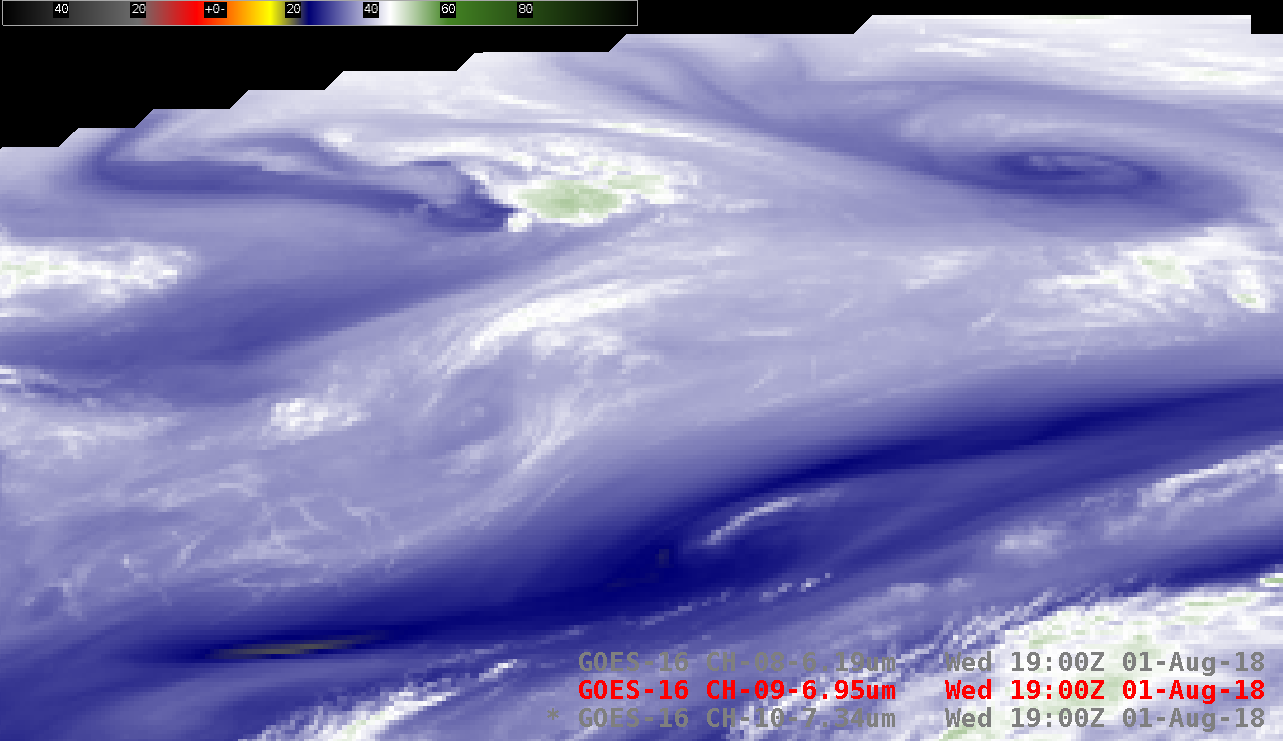
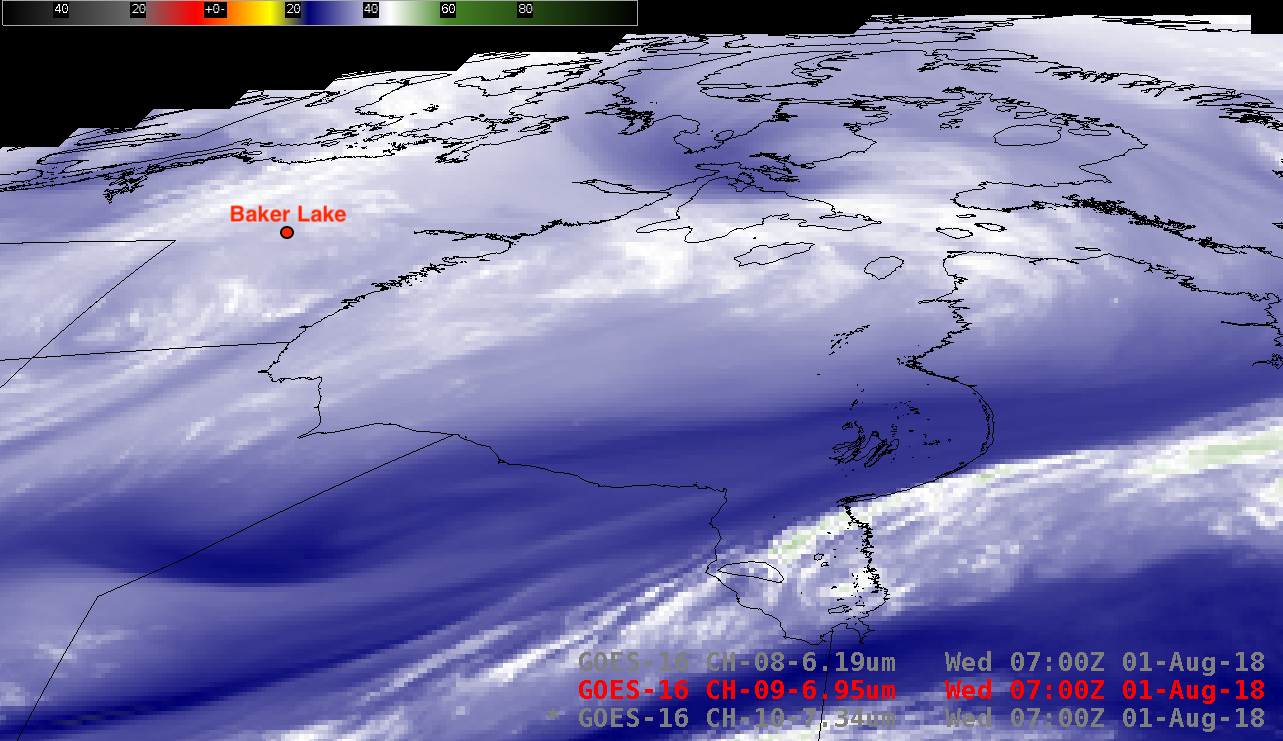
![GOES-16 Low-level (7.3 µm), Mid-level (6.9 µm) and Upper-level (6.2 µm) Water Vapor images [click to play animation | MP4]](https://cimss.ssec.wisc.edu/satellite-blog/wp-content/uploads/sites/5/2018/08/180801_goes16_water_vapor_Arctic_Canada_anim.gif)
![Magnified view of GOES-16 Mid-level (6.9 µm) Water Vapor image, showing the pixel dimension over Nunavut, Canada [click to enlarge]](https://cimss.ssec.wisc.edu/satellite-blog/wp-content/uploads/sites/5/2018/08/dist_fdwv9-20180801_230041.png)
![GOES-16 Water Vapor weighting function plots calculated using 12 UTC rawinsonde data from Baker Lake, Nunavut [click to enlarge]](https://cimss.ssec.wisc.edu/satellite-blog/wp-content/uploads/sites/5/2018/08/180801_12utc_cybk_wv_wf.jpeg)
![Visible images from GOES-15 (0.63 µm, left), GOES-17 (0.64 µm, center) and GOES-16 (0.64 µm, right) [click to play MP4 animation]](https://cimss.ssec.wisc.edu/satellite-blog/wp-content/uploads/sites/5/2018/07/G15_G17_G16_VIS_CO_SVR_29JUL2018_960x427_B122_2018210_214500_0003PANELS_00086.GIF)
![GOES-17 Infrared (11.2 µm) images [click to play animation | MP4]](https://cimss.ssec.wisc.edu/satellite-blog/wp-content/uploads/sites/5/2018/08/G17_ABI_BAND14_FL_loop_2018210_120421_2018210_235921.gif)
![All 16 bands of the GOES-17 ABI [click to play animation | MP4]](https://cimss.ssec.wisc.edu/satellite-blog/wp-content/uploads/sites/5/2018/08/g17_firstlight_ir_loop_2018210_120239_2018210_234739.gif)

![GOES-16 "Clean" Infrared Window (10.3 µm) images, with hourly plots of surface observations (yellow) along with SPC storm reports (cyan) Interstate Highways (violet) and State Highways (cyan) [click to play MP4 animation]](https://cimss.ssec.wisc.edu/satellite-blog/wp-content/uploads/sites/5/2018/07/G16_IR_WY_SVR_28JUL2018_960x1280_B13_2018209_215628_0001PANEL_00147.GIF)
![Suomi NPP VIIRS and Aqua MODIS Infrared Window images [click to enlarge]](https://cimss.ssec.wisc.edu/satellite-blog/wp-content/uploads/sites/5/2018/07/180728_viirs_modis_infrared_WY_anim.gif)
![Terra and Aqua MODIS Total Precipitable Water product [click to enlarge]](https://cimss.ssec.wisc.edu/satellite-blog/wp-content/uploads/sites/5/2018/07/180728_modis_tpw_anim.gif)
