
GOES-16 “Red” Visible (0.64 µm) images, with hourly plots of surface reports; yellow * denotes the town of Alonsa [click to play MP4 animation]
The corresponding GOES-16 “Clean” Infrared Window (10.3 µm) images (below) revealed that the coldest cloud-top infrared brightness temperature of around -70ºC occurred at 0123 UTC (just prior to the time of the tornado).
![GOES-16 "Clean" Infrared Window (10.3 µm) images, with hourly plots of surface reports; black * denotes the town of Alonsa [click to play MP4 animation]](https://cimss.ssec.wisc.edu/satellite-blog/wp-content/uploads/sites/5/2018/08/G16_IR_ALONSA_MB_TORNADO_03AUG2018_960x1280_B13_2018216_012333_0001PANEL_00264.GIF)
GOES-16 “Clean” Infrared Window (10.3 µm) images, with hourly plots of surface reports; black * denotes the town of Alonsa [click to play MP4 animation]
Environment Canada has upgraded the deadly Manitoba tornado to an EF-4, making it the strongest tornado confirmed in all of North America in 2018.#MBstorm #Alonsa https://t.co/BAl8ed5ZfU
— The Weather Network (@weathernetwork) August 7, 2018
One day following the Canada’s EF-4 ? a pass by #Sentinel2B ? shows a short but clear tornado scar. Starts southeast of Alonsa, ending at Margaret Bruce Provincial Park into Lake Manitoba. #mbstorm pic.twitter.com/34xoBnHpeS
— Carl Jones (@northflwx) August 8, 2018
The tornado damage path could also be seen in a comparison of ESA Sentinel-2 False Color, Normalized Difference Vegetation Index (NDVI) and Moisture Index Red-Green-Blue (RGB) images (below).
![ESA Sentinel-2B False Color, Normalized Difference Vegetattion Index (NDVI) and Moisture Index RGB images [click to enlarge]](https://cimss.ssec.wisc.edu/satellite-blog/wp-content/uploads/sites/5/2018/08/180804_sentinel2b_falseColor_ndvi_moistureIndex_Alonsa_damage_path_anim.gif)
ESA Sentinel-2 False Color, Normalized Difference Vegetation Index (NDVI) and Moisture Index RGB images [click to enlarge]
View only this post Read Less
![GOES-16 Split Window (12.3 µm - 10.3 µm) Saharan Air Layer product [click to play MP4 animation]](https://cimss.ssec.wisc.edu/satellite-blog/wp-content/uploads/sites/5/2018/08/180802_12z_sal.jpeg)
![GOES-16 Natural Color RGB images [click to play MP4 animation]](https://cimss.ssec.wisc.edu/satellite-blog/wp-content/uploads/sites/5/2018/08/201808021830_fulldisk.jpg)
![GOES-16 Split Window 10.3 µm - 12.3 µm) images [click to play animation | MP4]](https://cimss.ssec.wisc.edu/satellite-blog/wp-content/uploads/sites/5/2018/08/180802_goes16_split_window_SAL_dust_anim.gif)
![GOES-16 Dust derived product [click to play animation | MP4]](https://cimss.ssec.wisc.edu/satellite-blog/wp-content/uploads/sites/5/2018/08/180802_goes16_dust_product_SAL_anim.gif)
![GOES-16 Split Window (10.3 µm - 12.3 µm) product [click to play animation | MP4]](https://cimss.ssec.wisc.edu/satellite-blog/wp-content/uploads/sites/5/2018/08/180803_goes16_split_window_SAL_dust_anim.gif)
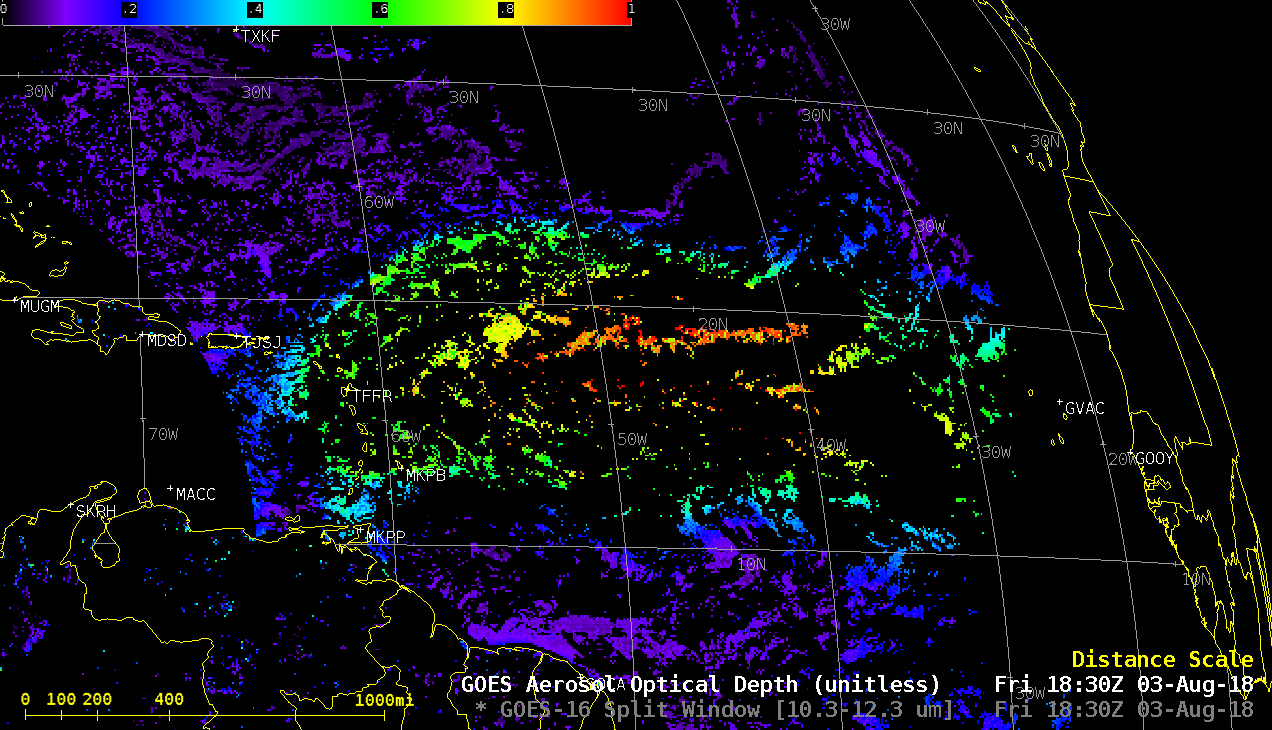
![GOES-16 Aerosol Optical Depth product [click to play animation | MP4]](https://cimss.ssec.wisc.edu/satellite-blog/wp-content/uploads/sites/5/2018/08/180803_goes16_aod_SAL_dust_anim.gif)
![Plots of rawinsonde data from San Juan, Puerto Rico [click to enlarge]](https://cimss.ssec.wisc.edu/satellite-blog/wp-content/uploads/sites/5/2018/08/180803_TJSJ_RAOBS.GIF)
![Visible images from GOES-15 (0.63 µm, left), GOES-17 (0.64 µm, center) and GOES-16 (0.64 µm, right), with SPC storm reports plotted in red [click to play animation | MP4]](https://cimss.ssec.wisc.edu/satellite-blog/wp-content/uploads/sites/5/2018/08/180802_goes15_goes17_goes16_visible_spc_storm_reports_AZ_anim.gif)
![Time series of surface observations for Phoenix, Arizona [click to enlarge]](https://cimss.ssec.wisc.edu/satellite-blog/wp-content/uploads/sites/5/2018/08/180802_KPXH_SFCMG.GIF)
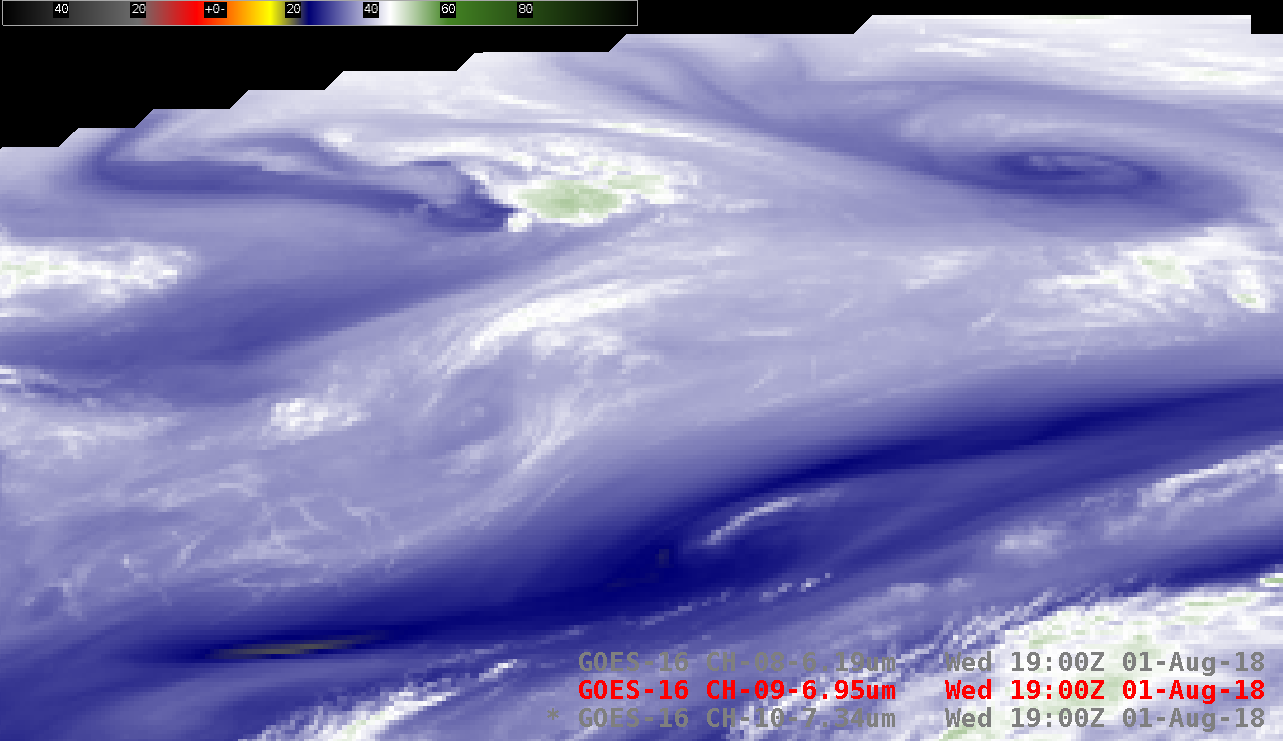
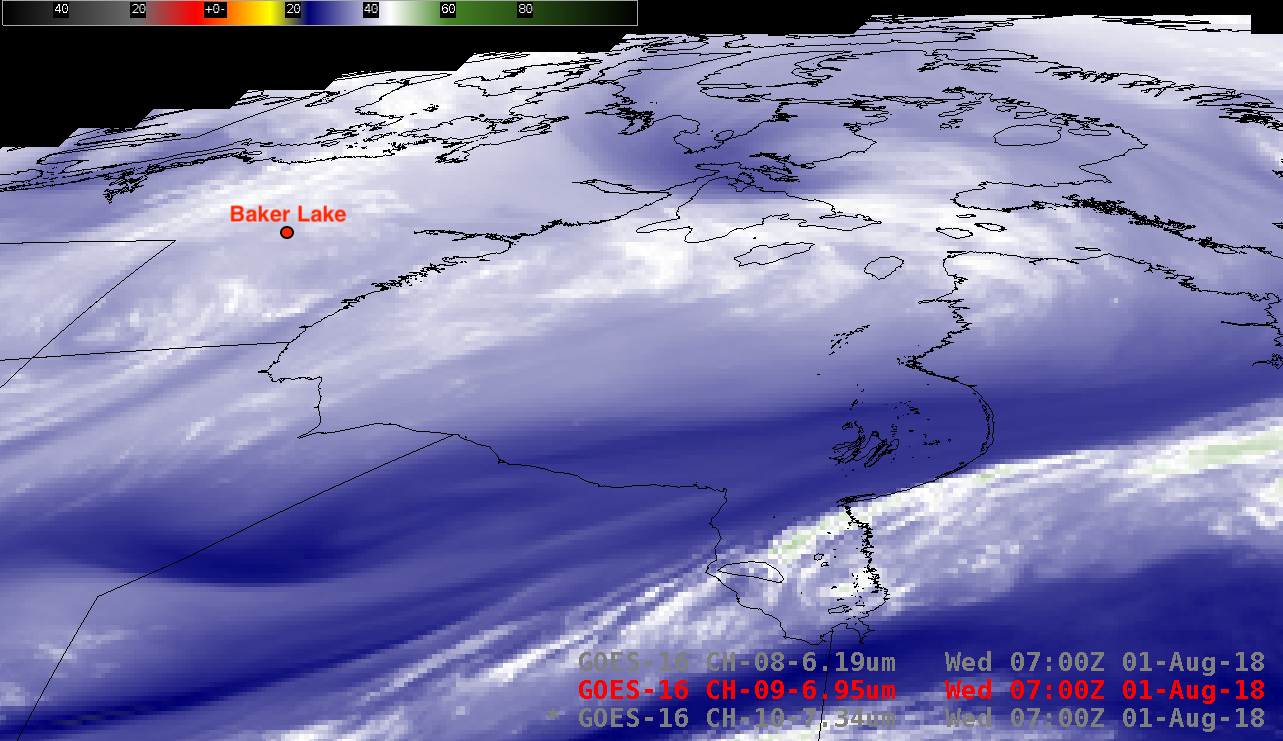
![GOES-16 Low-level (7.3 µm), Mid-level (6.9 µm) and Upper-level (6.2 µm) Water Vapor images [click to play animation | MP4]](https://cimss.ssec.wisc.edu/satellite-blog/wp-content/uploads/sites/5/2018/08/180801_goes16_water_vapor_Arctic_Canada_anim.gif)
![Magnified view of GOES-16 Mid-level (6.9 µm) Water Vapor image, showing the pixel dimension over Nunavut, Canada [click to enlarge]](https://cimss.ssec.wisc.edu/satellite-blog/wp-content/uploads/sites/5/2018/08/dist_fdwv9-20180801_230041.png)
![GOES-16 Water Vapor weighting function plots calculated using 12 UTC rawinsonde data from Baker Lake, Nunavut [click to enlarge]](https://cimss.ssec.wisc.edu/satellite-blog/wp-content/uploads/sites/5/2018/08/180801_12utc_cybk_wv_wf.jpeg)
