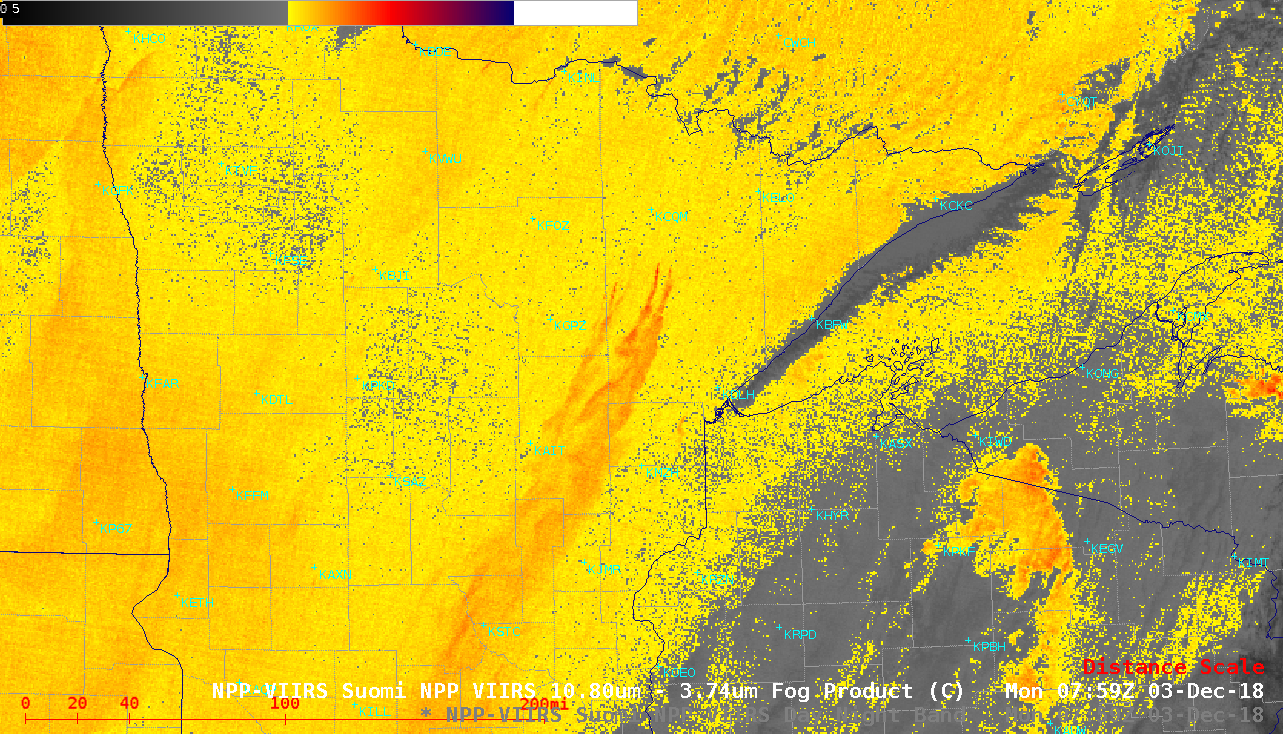
A sequence of nighttime MODIS and VIIRS “Fog/stratus” infrared Brightness Temperature Difference (BTD) images (above) revealed long plumes (darker shades of red) streaming southwestward for over 200 miles from their industrial point sources in the Mesabi Range of northeastern Minnesota on 03 December 2018.During the subsequent daytime hours, a comparison of GOES-16 (GOES-East)... Read More
MODIS and VIIRS “Fog/stratus” BTD images [click to enlarge]
A sequence of nighttime MODIS and VIIRS “Fog/stratus” infrared Brightness Temperature Difference (BTD) images
(above) revealed long plumes
(darker shades of red) streaming southwestward for over 200 miles from their industrial point sources in the
Mesabi Range of northeastern Minnesota on
03 December 2018.
During the subsequent daytime hours, a comparison of GOES-16 (GOES-East) “Red” Visible (0.64 µm), Near-Infrared “Snow/Ice” (1.61 µm), Near-Infrared “Cloud Particle Size” (2.24 µm) and Shortwave Infrared (3.9 µm) images (below) showed signatures of these Mesabi Range plumes along with others emanating from industrial or power plant sources. A few ship tracks were also apparent across Lake Superior.
Particles emitted from the exhaust stacks at power plants and industrial sites (as well as ships) can act as efficient cloud condensation nuclei, which causes the formation of large numbers of supercooled water droplets having a smaller diameter than those found within the adjacent unperturbed supercooled clouds — and these smaller supercooled cloud droplets are better reflectors of incoming solar radiation, thereby appearing brighter in the Near-Infrared and warmer (darker gray) in the Shortwave Infrared images.
GOES-16 “Red” Visible (0.64 µm), Near-Infrared “Snow/Ice” (1.61 µm), Near-Infrared “Cloud Particle Size” (2.24 µm) and Shortwave Infrared (3.9 µm) images [click to play animation | MP4]
On the following night, another sequence of MODIS and VIIRS “Fog/stratus” infrared Brightness Temperature Difference (BTD) images
(below) highlighted a number of industrial and power plant plumes across Minnesota, northern Wisconsin and the Upper Peninsula of Michigan. The curved shape of many of these plumes resulted from boundary layer winds shifting from northerly to westerly as the night progressed.
![MODIS and VIIRS "Fog/stratus" BTD images [click to enlarge]](https://cimss.ssec.wisc.edu/satellite-blog/wp-content/uploads/sites/5/2018/12/181204_modis_viirs_fogBTD_MN_WI_plumes_anim.gif)
MODIS and VIIRS “Fog/stratus” BTD images [click to enlarge]
During the following daytime hours on
04 December, a comparison of VIIRS Visible (0.64 µm), Near-Infrared “Snow/Ice” (1.61 µm), Shortwave Infrared (3.74 µm) and Infrared Window (11.45 µm) images
(below) showed 2 plume types across eastern Nebraska. There were several of the brighter/warmer plumes similar to those noted on the previous day across Minnesota/Wisconsin/Michigan — but one large plume originating from industrial sites just east of Norfolk (KOFK) had the effect of eroding the supercooled cloud deck via glaciation (initiated by the emission of particles that acted as efficient
ice nuclei) and subsequent snowfall. This is similar to the process that creates aircraft “distrails” or “fall streak clouds” as documented
here,
here and
here.
VIIRS Visible (0.64 µm), Near-Infrared “Snow/Ice” (1.61 µm), Shortwave Infrared (3.74 µm) and Infrared Window (11.45 µm) images [click to enlarge]
Farther to the east over Ohio and Pennsylvania, another example of the 2 plume types was seen (below) — one plume originating from an industrial site near Cleveland was glaciating/eroding the supercooled cloud and producing snowfall, while another bright/warm supercooled droplet plume was moving southeastward from a point source located west of Indiana County Airport KIDI.
The Cleveland plume was captured by an overpass of the Landsat-8 satellite, with a False Color Red-Green-Blue (RGB) image viewed using RealEarth providing great detail with 30-meter resolution (below). A small “overshooting top” can even be seen above the industrial site southeast of Cleveland, with the swath of glaciated and eroding cloud extending downwind (to the southeast) from that point.
![Landsat-8 False Color RGB image [click to enlarge]](https://cimss.ssec.wisc.edu/satellite-blog/wp-content/uploads/sites/5/2018/12/181204_1604utc_landsat8_falsecolor_CLE_factory_plume_anim.gif)
Landsat-8 False Color RGB image [click to enlarge]
Coincidentally, Landsat-8 also captured another example of a glaciating cloud plume downwind of the
Flint Hills Oil Refinery south of St. Paul, Minnesota on 03 December
(below). The erosion/glaciation of supercooled cloud extended as far south as Albert Lea, Minnesota. Similar to the Cleveland example, a small “overshooting top” was seen directly over the plume point source.
![Landsat-8 False Color RGB image [click to enlarge]](https://cimss.ssec.wisc.edu/satellite-blog/wp-content/uploads/sites/5/2018/12/181203_1658utc_landsat8_falsecolor_Minnesota_industrial_glaciation_plume_anim.gif)
Landsat-8 False Color RGB image [click to enlarge]
===== 08 December Update =====
The effect of this industrial plume glaciating and eroding the supercooled water droplet clouds over northern Indiana was also seen in a comparison of Terra MODIS Visible (0.65 µm), Near-Infrared “Snow/Ice” (1.61 µm) and Infrared Window (11.0 µm) images (below).
Terra MODIS Visible (0.65 µm), Near-Infrared “Snow/Ice” (1.61 µm) and Infrared Window (11.0 µm) images [click to enlarge]
===== 09 December Update =====
During the following daytime hours, GOES-16 “Red” Visible (0.64 µm), Near-Infrared “Snow/Ice” (1.61 µm), Near-Infrared “Cloud Particle Size” (2.24 µm), Shortwave Infrared (3.9 µm) and “Clean” Infrared Window (10.3 µm) images
(below) showed a number of plumes from industrial sites
(many of which were likely refineries) streaming southeastward and eastward over the Gulf of Mexico on 09 December. Note the lack of a plume signature in the 10.3 µm imagery.
![GOES-16 "Red" Visible (0.64 µm), Near-Infrared "Snow/Ice" (1.61 µm), Near-Infrared "Cloud Particle Size" (2.24 µm), Shortwave Infrared (3.9 µm) and "Clean" Infrared Window (10.3 µm) images [click to play MP4 animation]](https://cimss.ssec.wisc.edu/satellite-blog/wp-content/uploads/sites/5/2018/12/gom_nir225-20181209_183218.png)
GOES-16 “Red” Visible (0.64 µm), Near-Infrared “Snow/Ice” (1.61 µm), Near-Infrared “Cloud Particle Size” (2.24 µm), Shortwave Infrared (3.9 µm) and “Clean” Infrared Window (10.3 µm) images [click to play MP4 animation]
View only this post
Read Less
![GOES-16 Mid-level Water Vapor (6.9 µm) images, with hourly plots of surface weather type [click to play MP4 animation]](https://cimss.ssec.wisc.edu/satellite-blog/wp-content/uploads/sites/5/2018/12/G16_WV_WXS_WINTER_STORM_DEIGO_9_DEC2018_2018343_180218_GOES-16_0001PANEL.GIF)
![Suomi NPP VIIRS Visible (0.64 µm) and Near-Infrared "Snow/Ice" (1.61 µm) images [click to enlarge]](https://cimss.ssec.wisc.edu/satellite-blog/wp-content/uploads/sites/5/2018/12/181209_viirs_visible_snowIce_AR_anim.gif)
![Topography in feet [click to enlarge]](https://cimss.ssec.wisc.edu/satellite-blog/wp-content/uploads/sites/5/2018/12/or_id_vortex_topo.png)
![12 UTC rawinsonde data from Boise, Idaho [click to enlarge]](https://cimss.ssec.wisc.edu/satellite-blog/wp-content/uploads/sites/5/2018/12/181207_12utc_kboi_raob.png)
