Banner cloud in Alaska
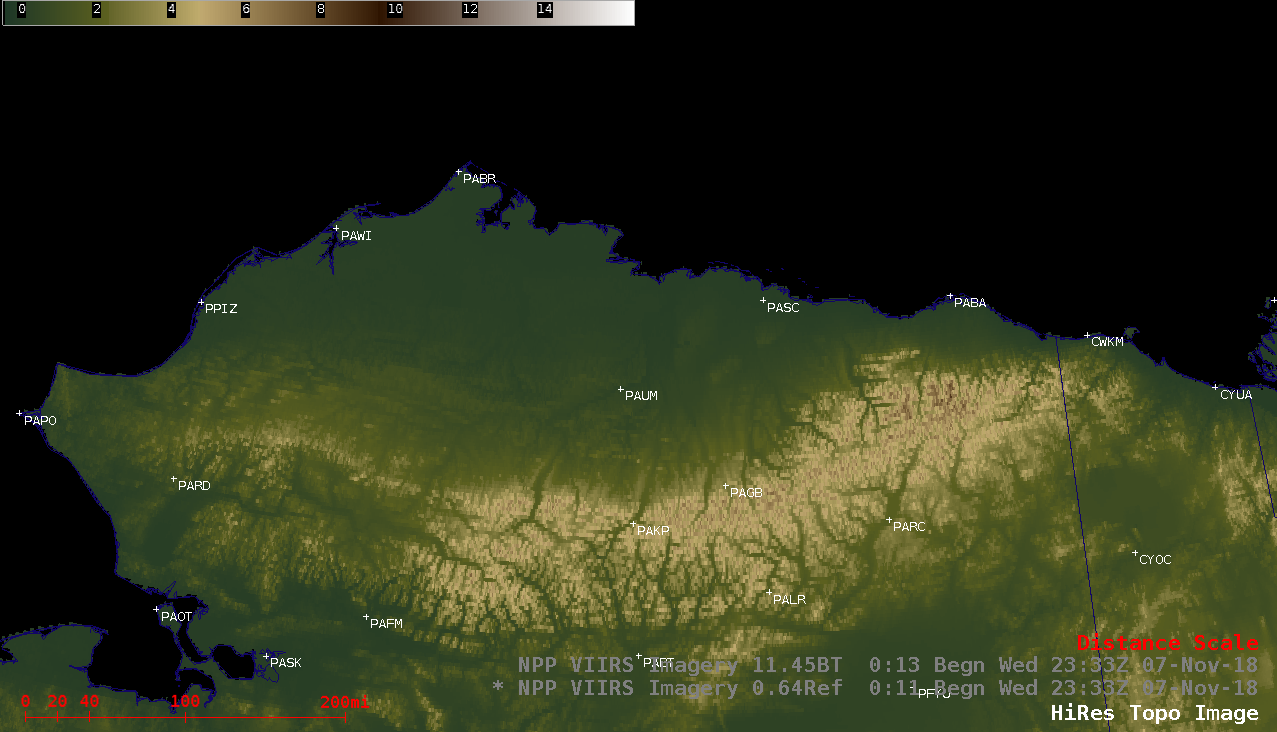
![Topography + Suomi NPP VIIRS Infrared Window (11.45 µm) images, with/without overlays of NAM12 250 hPa winds [click to play animation | MP4]](https://cimss.ssec.wisc.edu/satellite-blog/wp-content/uploads/sites/5/2018/11/181107_suomiNPP_viirs_infraredWindow_250winds_AK_banner_cloud_anim.gif)
Topography + Suomi NPP VIIRS Infrared Window (11.45 µm) images, with/without overlays of NAM12 250 hPa winds [click to play animation | MP4]
In a comparison of Suomi NPP VIIRS Shortwave Infrared (3.74 µm) and Infrared Window (11.45 µm) images (below), note the significantly warmer 3.74 µm cloud-top brightness temperatures — as much as 40 to 50ºC warmer at 2009 UTC when the sun angle was highest over Alaska — caused by enhanced solar reflectance off the very small ice crystals at the top of the banner cloud.
![Suomi NPP VIIRS Shortwave Infrared (3.74 µm) and Infrared Window (11.45 µm) images [click to play animation | MP4]](https://cimss.ssec.wisc.edu/satellite-blog/wp-content/uploads/sites/5/2018/11/181107_suomiNPP_viirs_shortwaveInfrared_infraredWindow__AK_banner_cloud_anim.gif)
Suomi NPP VIIRS Shortwave Infrared (3.74 µm) and Infrared Window (11.45 µm) images [click to play animation | MP4]
![GOES-15 Water Vapor (6.5 µm, top) and Infrared Window (10.7 µm, bottom) images [click to play animation | MP4]](https://cimss.ssec.wisc.edu/satellite-blog/wp-content/uploads/sites/5/2018/11/181107_goes15_waterVapor_infraredWindow_AK_banner_cloud_anim.gif)
GOES-15 Water Vapor (6.5 µm, top) and Infrared Window (10.7 µm, bottom) images [click to play animation | MP4]