GOES-16 “Red” Visible (0.64 µm) images [click to play animation | MP4]
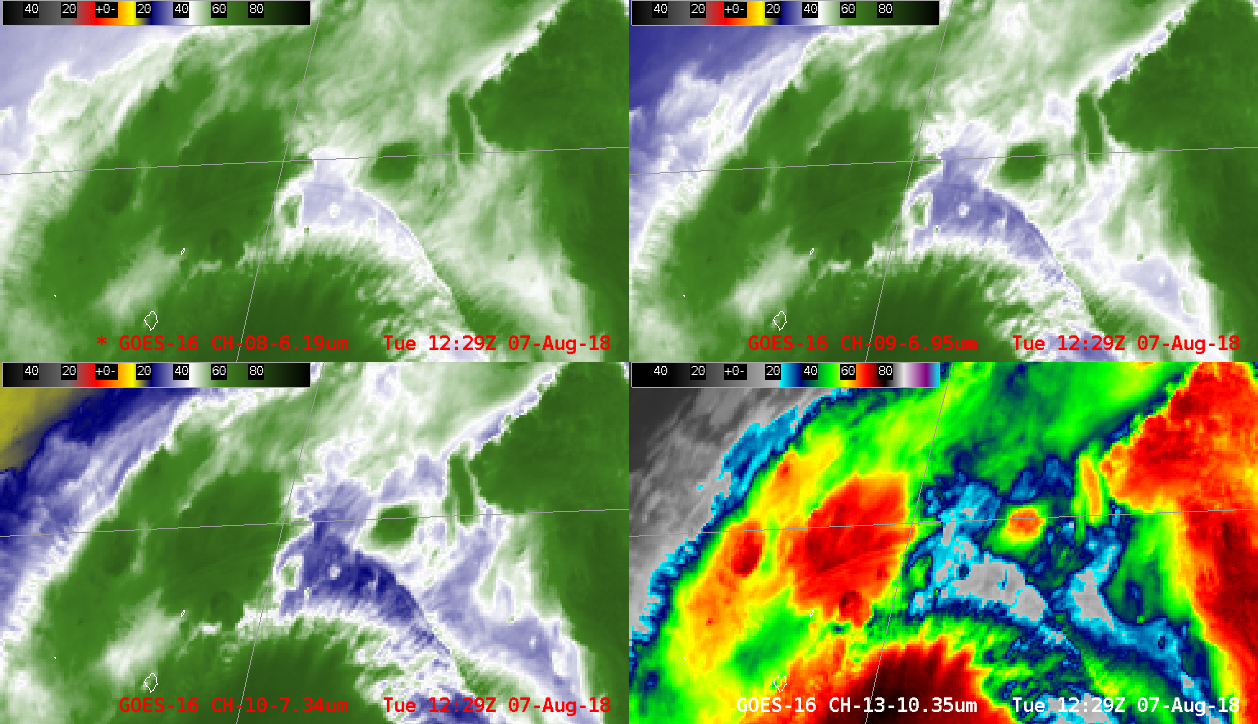
GOES-16 Upper-level Water Vapor (6.2 µm), Mid-level Water Vapor (6.9 µm), Low-level Water Vapor (7.3 µm) and “Clean” Infrared Window (10.3 µm) images (below) revealed an interesting gravity wave that was propagating northward away from the center of John. This wave appeared to perturb the cloud tops — perhaps via vertical mixing — leading to a slight warming of the colder cloud-top infrared brightness temperatures as the wave passed. The appearance and behavior of this wave was very similar to another observed in Nebraska, Colorado and Kansas on 22 July.

GOES-16 Upper-level Water Vapor (6.2 µm, top left), Mid-level Water Vapor (6.9 µm, top right), Low-level Water Vapor (7.3 µm, bottom left) and “Clean” Infrared Window (10.3 µm, bottom right) images [click to play MP4 animation]
![3-hourly analyses of 850 hPa relative vorticity [click to enlarge]](https://cimss.ssec.wisc.edu/satellite-blog/wp-content/uploads/sites/5/2018/08/180807_TS_Ileana_Hurricane_John_850hPa_vorticity_anim.gif)
3-hourly analyses of 850 hPa relative vorticity [click to enlarge]
===== 08 August Update =====
![Visible images from GOES-15, GOES-14, GOES-17 and GOES-16 [click to play animation | MP4]](https://cimss.ssec.wisc.edu/satellite-blog/wp-content/uploads/sites/5/2018/08/180808_goes15_goes14_goes17_goes16_visible_Hurricane_John_anim.gif)
Visible images from GOES-15, GOES-14, GOES-17 and GOES-16 [click to play animation | MP4]
Note that the GOES-15 and GOES-14 Visible images do not appear as bright as those from GOES-17 and GOES-16 — prior to the GOES-R Series of satellites, the performance of visible detectors degraded over time, leading to imagery that appeared more dim as the Imager instrument aged. Visible detectors on the new ABI instrument benefit from on-orbit calibration to remedy this type of degradation.
* GOES-17 images shown here preliminary and non-operational *
View only this post Read Less
![NOAA-20 and Suomi NPP VIIRS Infrared Window (11.45 µm) images [click to enlarge]](https://cimss.ssec.wisc.edu/satellite-blog/wp-content/uploads/sites/5/2018/08/180806_1027utc_noaa20_1117utc_suomi_npp_viirs_InfraredWindow_Hurricane_Hector_anim.gif)
![GOES-15 Visible (0.63 µm, left) and Infrared Window (10.7 µm, right) images [click to play animation | MP4]](https://cimss.ssec.wisc.edu/satellite-blog/wp-content/uploads/sites/5/2018/08/180806_goes15_visible_infrared_Hurricane_Hector_anim.gif)
![GOES-15 Visible (0.63 µm) images [click to play animation | MP4]](https://cimss.ssec.wisc.edu/satellite-blog/wp-content/uploads/sites/5/2018/08/180806_goes15_visible_Hurricane_Hector_anim.gif)
![GOES-15 Infrared Window (10.7 µm) image and Metop ASCAT surface scatterometer winds [click to enlarge]](https://cimss.ssec.wisc.edu/satellite-blog/wp-content/uploads/sites/5/2018/08/180806_1930utc_goes15_ir_ascat_Hurricane_Hector_anim.gif)
![MIMIC-TC morphed microwave product [click to play animation]](https://cimss.ssec.wisc.edu/satellite-blog/wp-content/uploads/sites/5/2018/08/180804_180806_mimic_tc_Hector_anim.gif)
![NOAA-20 VIIRS Day/Night Band (0.7 µm) and Infrared Window (11.45 µm) images [click to enlarge]](https://cimss.ssec.wisc.edu/satellite-blog/wp-content/uploads/sites/5/2018/08/180807_1148utc_noaa20_DayNightBand_InfraredWindow_Hurricane_Hector_anim.gif)
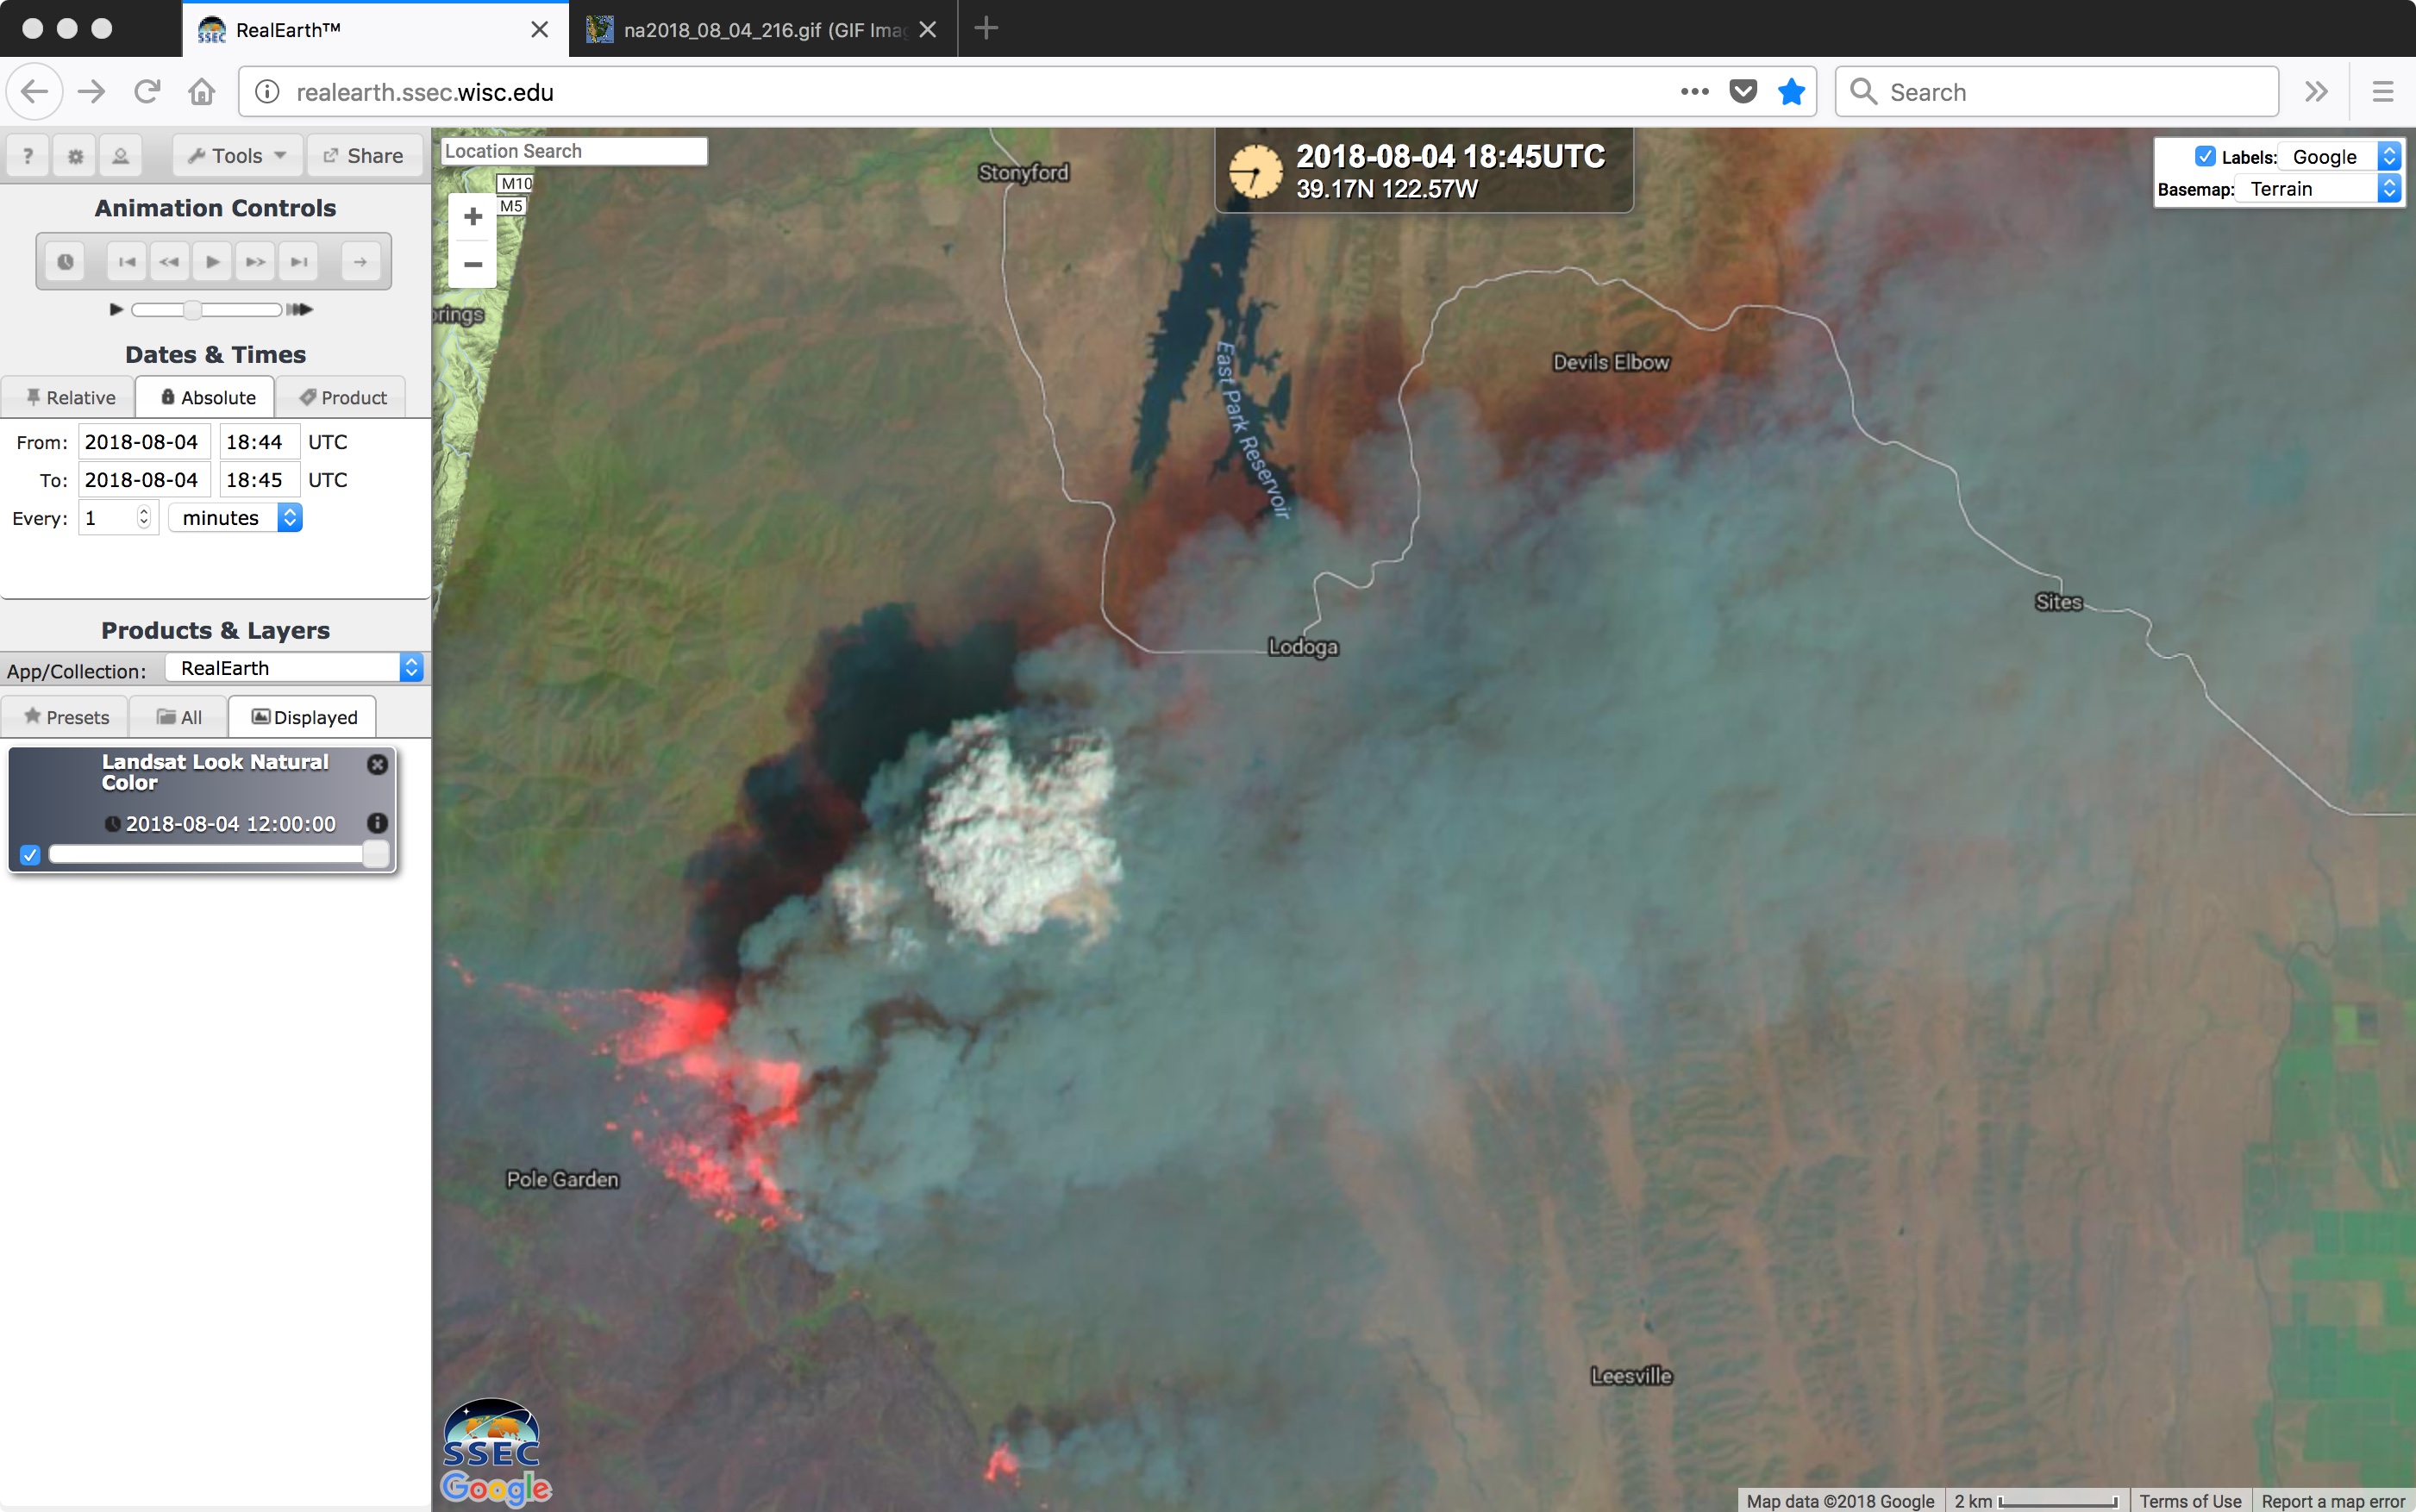
![Landsat-8 False Color image [click to enlarge]](https://cimss.ssec.wisc.edu/satellite-blog/wp-content/uploads/sites/5/2018/08/180804_1845utc_landsat8_falsecolor_Mendocino_Complex_CA_fire.jpeg)
![GOES-16 Upper-level (6.2 µm, top left), Mid-level (6.9 µm, top right), Low-level (7.3 µm, bottom left) Water Vapor and "Red" Visible with Derived Motion Winds (0.64 µm, bottom right) [click to play MP4 animation]](https://cimss.ssec.wisc.edu/satellite-blog/wp-content/uploads/sites/5/2018/08/CA_4panel_dmw-20180804_220225.png)
![NOAA-20 VIIRS Day/Night Band (0.7 µm), Near-Infrared (1.61 µm and 2.25 µm) and Shortwave Infrared (3.75 µm) images [click to enlarge]](https://cimss.ssec.wisc.edu/satellite-blog/wp-content/uploads/sites/5/2018/08/180807_1001utc_noaa20_viirs_Mendocino_Complex_anim.gif)

![GOES-16 "Clean" Infrared Window (10.3 µm) images, with hourly plots of surface reports; black * denotes the town of Alonsa [click to play MP4 animation]](https://cimss.ssec.wisc.edu/satellite-blog/wp-content/uploads/sites/5/2018/08/G16_IR_ALONSA_MB_TORNADO_03AUG2018_960x1280_B13_2018216_012333_0001PANEL_00264.GIF)
![ESA Sentinel-2B False Color, Normalized Difference Vegetattion Index (NDVI) and Moisture Index RGB images [click to enlarge]](https://cimss.ssec.wisc.edu/satellite-blog/wp-content/uploads/sites/5/2018/08/180804_sentinel2b_falseColor_ndvi_moistureIndex_Alonsa_damage_path_anim.gif)
