This website works best with a newer web browser such as Chrome, Firefox, Safari or Microsoft
Edge. Internet Explorer is not supported by this website.
1-minute Mesoscale Domain Sector GOES-18 (GOES-West) Visible and Infrared images (above) showed the westward motion of of Hurricane Kiko during an 8.5-hour period as the tropical cyclone was rapidly intensifying (SATCON) from a Category 2 storm at 1500 UTC on 03 September 2025 to a Category 3 storm at 1800 UTC and... Read More
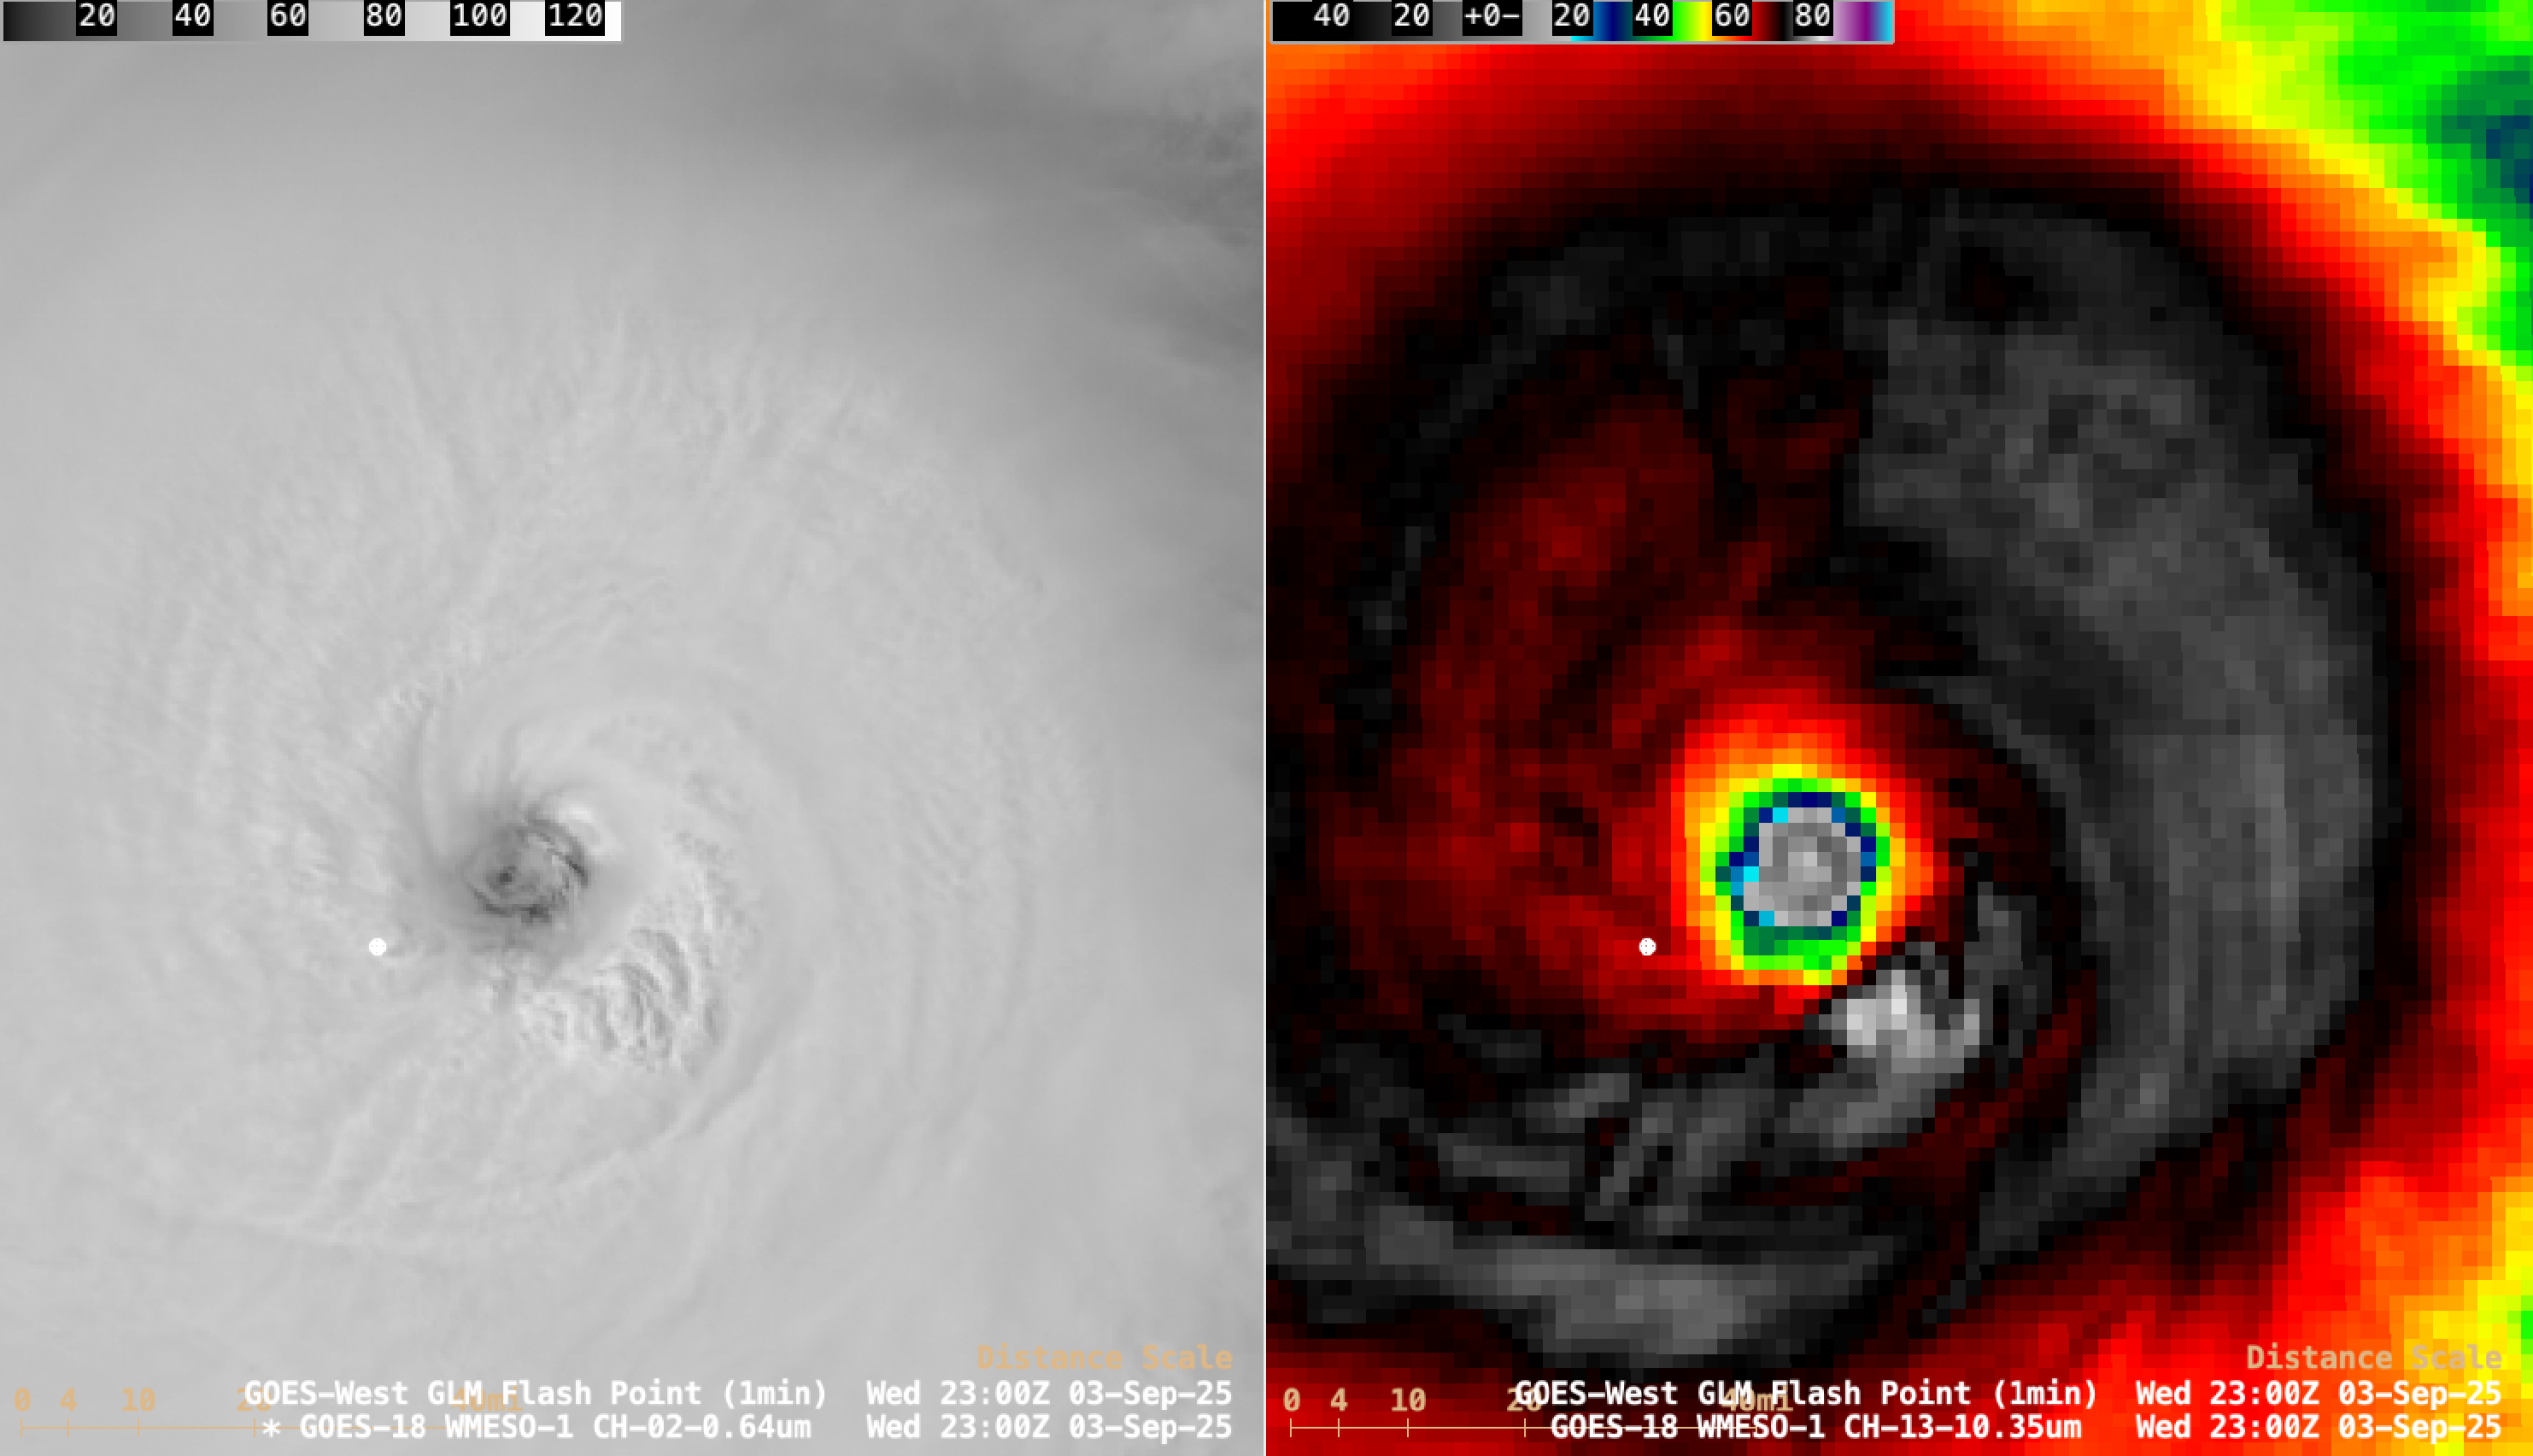
1-minute GOES-18 Visible and Infrared images with plots of 1-minute GOES-18 GLM Flash Points, from 1733 UTC on 03 September to 0200 UTC on 04 September [click to play MP4 animation]
1-minute Mesoscale Domain Sector GOES-18 (GOES-West) Visible and Infrared images (above) showed the westward motion of of Hurricane Kiko during an 8.5-hour period as the tropical cyclone was rapidly intensifying (SATCON) from a Category 2 storm at 1500 UTC on 03 September 2025 to a Category 3 storm at 1800 UTC and then to a Category 4 storm at 2100 UTC. Visible imagery revealed low-altitude mesoscale vortices that were occasionally evident within the eye. Plots of 1-minute GOES-18 GLM Flash Points displayed intermittent lightning activity within the eyewall — and the coldest cloud-top infrared brightness temperatures within the eyewall were in the -80ºC to -85ºC range.
Kiko was moving through an environment characterized by low values of deep-layer wind shear(below), and moving over relatively warm water — two factors that were favorable for tropical cyclone intensification.
GOES-18 Infrared images with an overlay of contours and streamlines of Deep-Layer Wind Shear at 2200 UTC on 03 September
An AMSU-B Microwave image at 1815 UTC (below) displayed a closed eyewall around the time that Kiko reached Category 4 intensity.
AMSU-B Microwave (183 GHz) image at 1815 UTC
A RCM-2 Synthetic Aperture Radar (SAR) image (source) at 0301 UTC on 04 September (below) depicted a maximum wind speed of 118.35 kts within the eyewall of Kiko.
RCM-2 SAR wind speed image at 0301 UTC on 04 September [click to enlarge]
1-minute CIMSS True Color RGB images created using Geo2Grid(below) showed a larger-scale view of Kiko.
1-minute GOES-18 CIMSS True Color RGB images, from 1800 UTC on 03 September to 0259 UTC on 04 September (courtesy Mat Gunshor, CIMSS) [click to play animated GIF | MP4]
MIMIC Total Precipitable Water images (below) indicated that Kiko (centered around 13ºN and moving between 130ºW and 140ºW) was beginning to tap moisture from the Intertropical Convergence Zone (ITCZ).
Hourly MIMIC Total Precipitable Water images, from 0000 UTC on 03 September to 2300 UTC on 04 September
Driven by a dry summer, numerous fires have been ignited in the Pacific northwest of the United States and far southwestern Canada. These fires were largely ignited by lightning from late summer storms, but continued drying in the area has both increased susceptibility to fire while also preventing rain from... Read More
Driven by a dry summer, numerous fires have been ignited in the Pacific northwest of the United States and far southwestern Canada. These fires were largely ignited by lightning from late summer storms, but continued drying in the area has both increased susceptibility to fire while also preventing rain from quenching the flames. The largest fire, Bear Gulch Fire on the Olympic Peninsula, has grown to over 9400 acres while containment holds steady at around 10%. The true color RGB from GOES-18 as displayed on CSPP Geosphere clearly shows the nearly state-wide extent of the smoke on an otherwise cloud-free day.
The GOES Fire Temperature RGB product (described here) uses a combination of the 3.9, 2.2, and 1.6 micron channels to provide a qualitative assessment of fire temperature. Since these are shortwave channels, they are subject to solar reflectance. However, the brightness temperatures of fires are so great that they can still be seen in the day. The hotter a fire is, the more emission it produces at the shorter wavelengths. When those three channels are combined into an RGB recipe, the fire hot spots change from red to yellow to white with increasing fire temperature as more influence from those shorter-wavelength channels is present.
This animation below shows the Fire Temperature RGB product in action. Note the numerous red dots across the region.
However, the Bear Gulch Fire is hardly visible via this product despite being the largest fire in the state of Washington. Located southwest of Seattle on the Olympic Peninsula, this fire is only intermittently present on the RGB product. Zooming in on the target area helps emphasize this as the bright red dot representing the fire only appears briefly over the course of a 2+ hour long animation.
The reason for this has to do, in part, with the unique terrain of the region. The GOES aerosol optical depth product vividly indicates just how extensive the smoke is across the state of Washington. However, the plume from the Bear Gulch Fire (seen as the red area in western Washington just west of Puget Sound in the below movie) has a much smaller extent than many of the other, smaller fires. This is because the mountainous terrain is largely trapping the smoke.
This trapped smoke results in a higher optical depth than in other locations, which then obscures the infrared emission from the fire. As a result, the 3.9 micron channel view of the fire is largely insensitive to the fire’s high temperatures; only occasionally does the smoke plume abate enough to enable some of that intense radiant energy to escape to space.
1-minute Mesoscale Domain Sector GOES-18 (GOES-West) Clean Infrared Window (10.3 µm) images combined with the FDCA Fire Mask derived product (above) showed that the Dollar Lake Fire in western Wyoming produced a pyrocumulonimbus (pyroCb) cloud as it was experiencing very active fire behavior (growing in size from 1300 to 5000 acres) in... Read More
1-minute GOES-18 Clean Infrared Window (10.3 µm) images combined with the Fire Mask derived product (cluster of semi-transparent red pixels), from 1757-2235 UTC on 22 August [click to play MP4 animation]
1-minute Mesoscale Domain Sector GOES-18 (GOES-West) Clean Infrared Window (10.3 µm) images combined with the FDCA Fire Mask derived product (above) showed that the Dollar Lake Fire in western Wyoming produced a pyrocumulonimbus (pyroCb) cloud as it was experiencing very active fire behavior (growing in size from 1300 to 5000 acres) in the wake of a cold frontal passage on 22 August 2025. The pyroCb cloud first exhibited a cloud-top 10.3 µm infrared brightness temperature (IRBT) of -40ºC (denoted by darker blue pixels) — a necessary condition to be classified as a pyroCb — at 1908 UTC.
A non-pyroCb meteorological thunderstorm also developed just north of the Dollar Lake Fire pyroCb. While no GLM-detected lightning activity was seen with the pyroCb, several GLM Flash Points were associated with the northern thunderstorm (however, since the Flash Points are parallax-corrected, their surface locations appeared south-southwest of the parent thunderstorm).
GOES-18 Infrared image at 2222 UTC on 22 August, with a cursor sample of the coldest pyroCb cloud-top infrared brightness temperature [click to enlarge]
The coldest pyroCb cloud-top IRBT was -53.49ºC at 2222 UTC, about 300 mi downwind (east) of the Dollar Lake Fire, as the leading edge of the pyroCb approached the Wyoming/South Dakota border (above). On a plot of rawinsonde data from Riverton, Wyoming (below) the air temperature of -53.49ºC occurred just above the Most Unstable (MU) air parcel’s Maximum Parcel Level (EL) of ~10.2 km.
Plot of rawinsonde data from Riverton, Wyoming at 0000 UTC on 23 August [click to enlarge]
The Dollar Lake Fire burned very hot, exhibiting a 3.9 µm infrared brightness temperature of 137.88ºC — which is the saturation temperature of the GOES-18 ABI Band 7 detectors — for about 3 hours, beginning at 1823 UTC (below).
GOES-18 Shortwave Infrared (3.9 µm) image at 1823 UTC on 22 August, with a cursor sample of the hottest 3.9 µm brightness temperature over the Dollar Lake Fire [click to enlarge]
The Dollar Lake Fire continues to burn today, which is very evident when you look at nearby webcams. A large smoke plume is developing and forming pyrocumulus clouds. These clouds are being picked up by our radar showing the plume continuing to spread to the east. #wywxpic.twitter.com/CzDa9L68qU
At 15:28 UTC today, NOAA decommissioned the final remaining legacy POES satellite, NOAA-15. The spacecraft was launched on May 13, 1998, and entered full operations on December 15th of that same year. Amazingly, that equates to 27 years of observations from low-earth orbit; for a spacecraft with an original mission... Read More
At 15:28 UTC today, NOAA decommissioned the final remaining legacy POES satellite, NOAA-15. The spacecraft was launched on May 13, 1998, and entered full operations on December 15th of that same year. Amazingly, that equates to 27 years of observations from low-earth orbit; for a spacecraft with an original mission lifespan of 2 years, that is incredible! Based on available information, that should cement NOAA-15 in the record books as the longest-lived operational American polar weather satellite, a record that is unlikely to be broken anytime soon as modern constellations (such as JPSS) now adhere to more stringent deorbiting requirements.
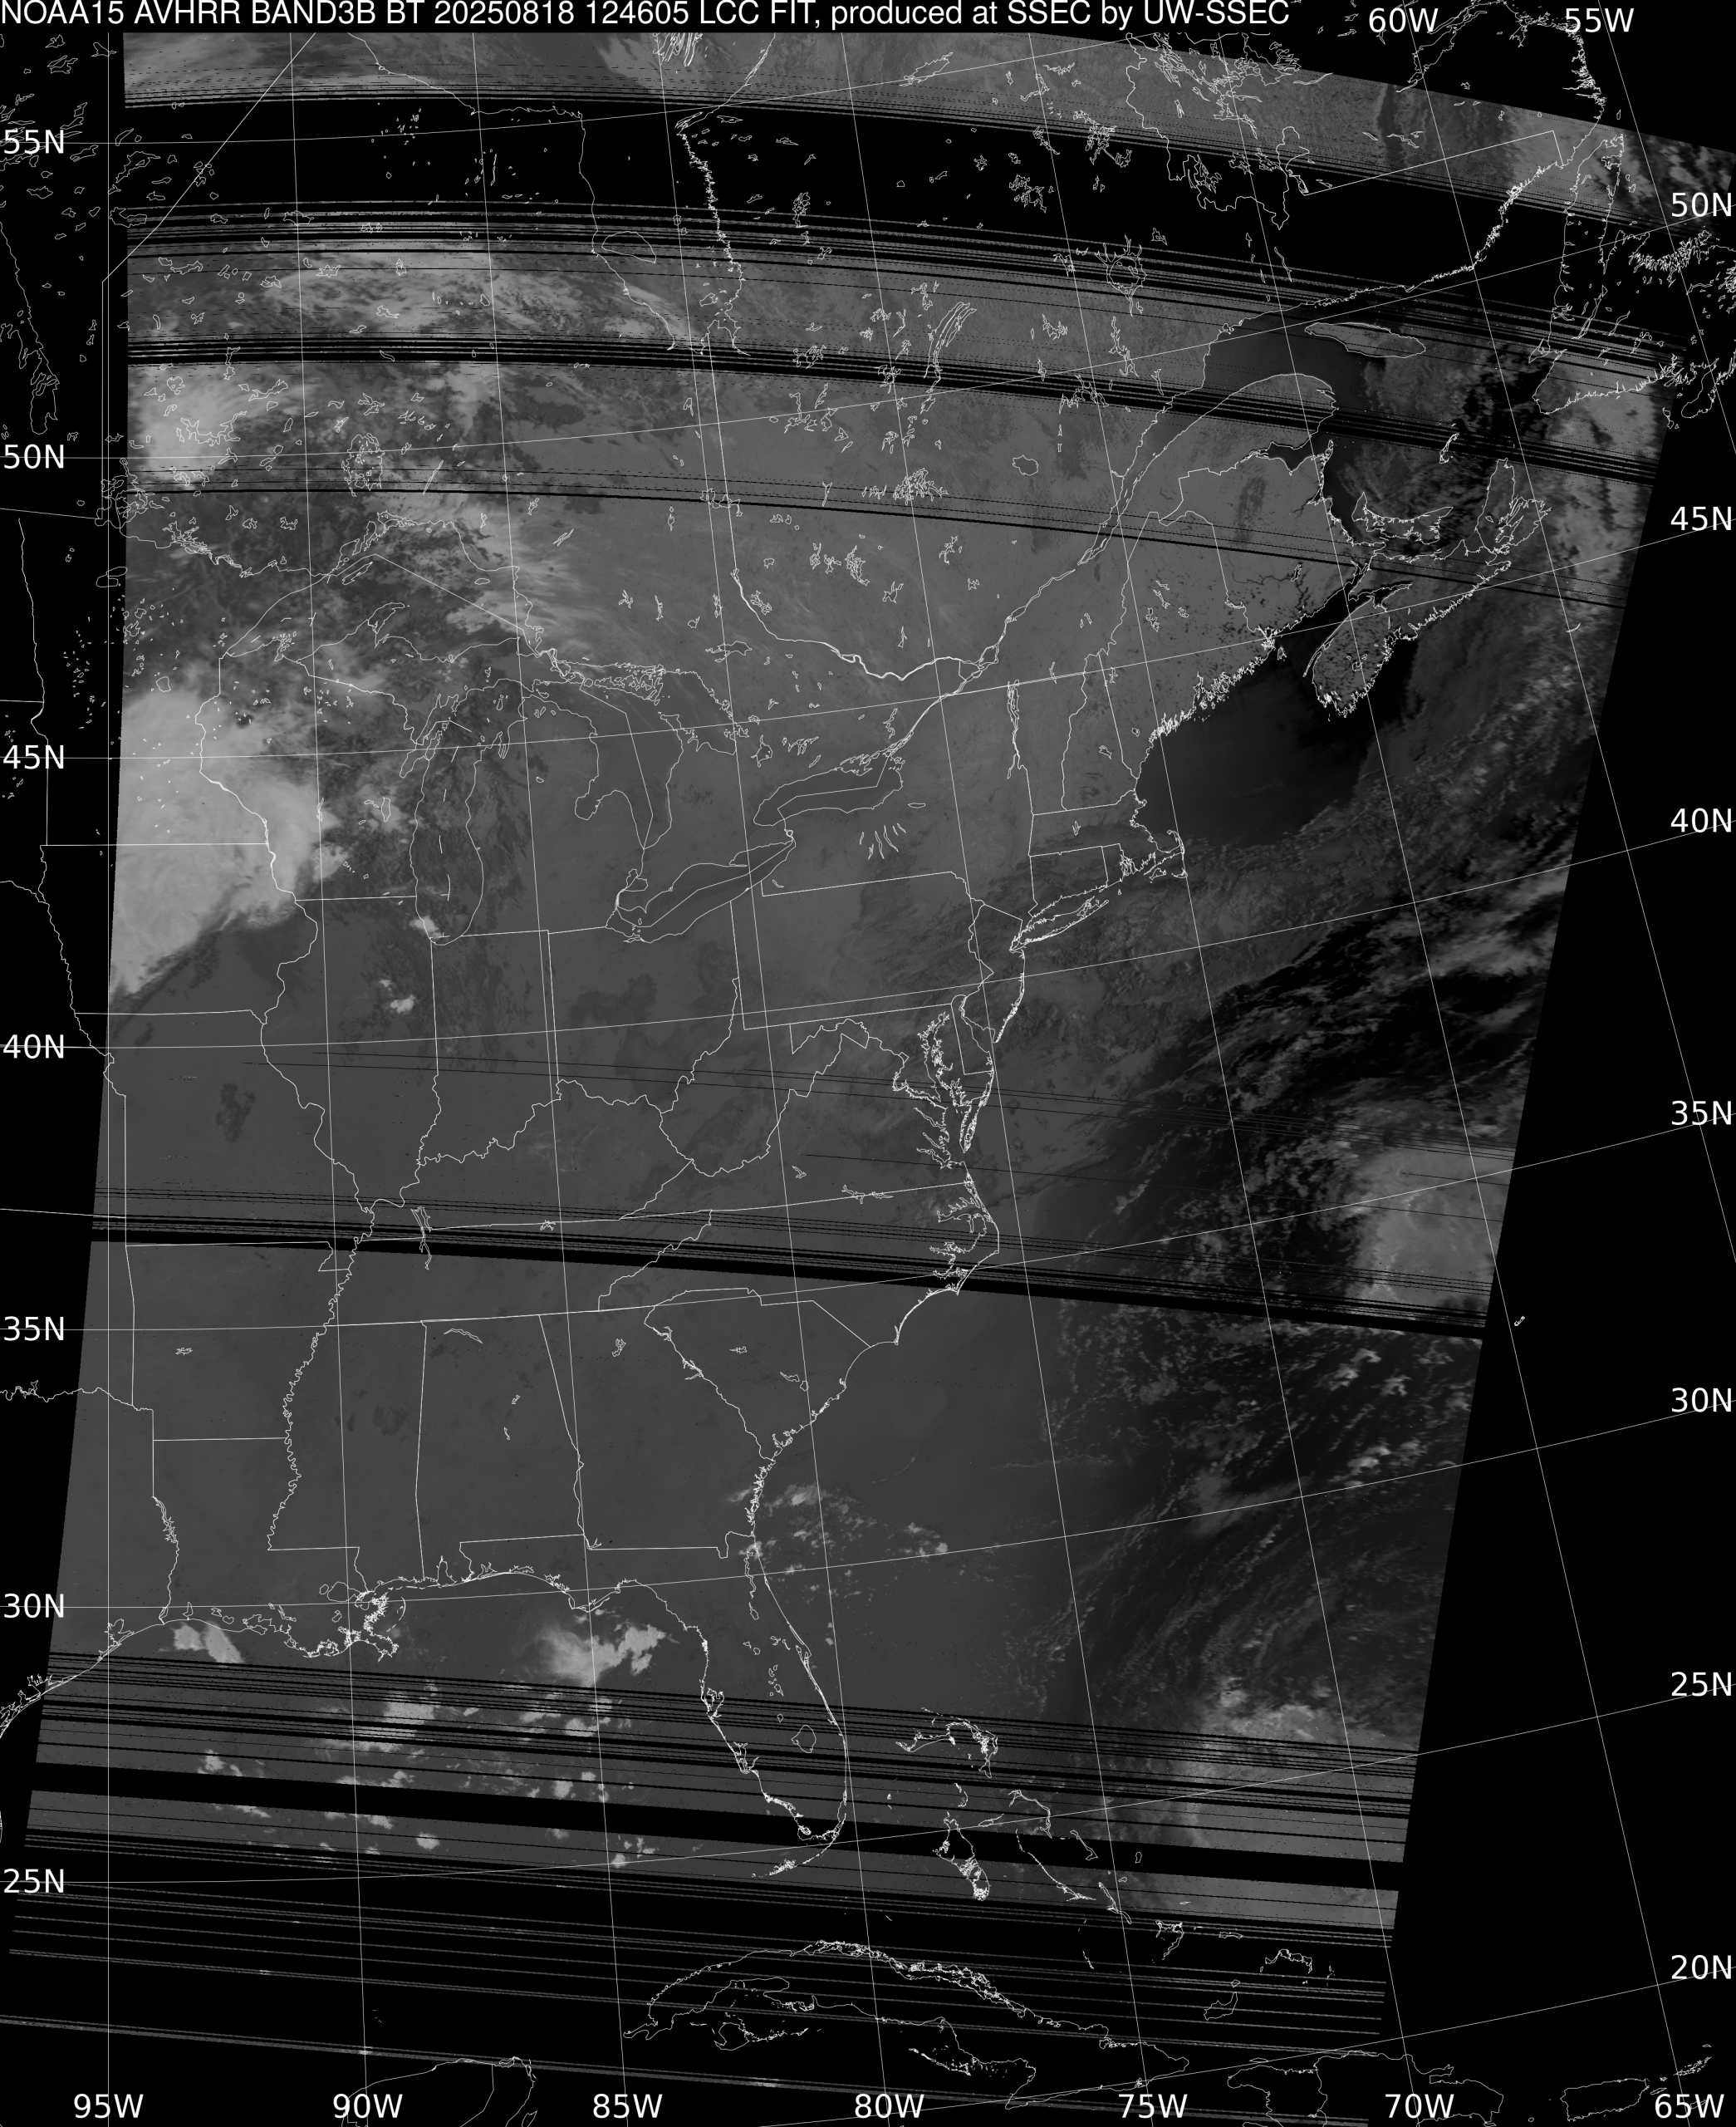
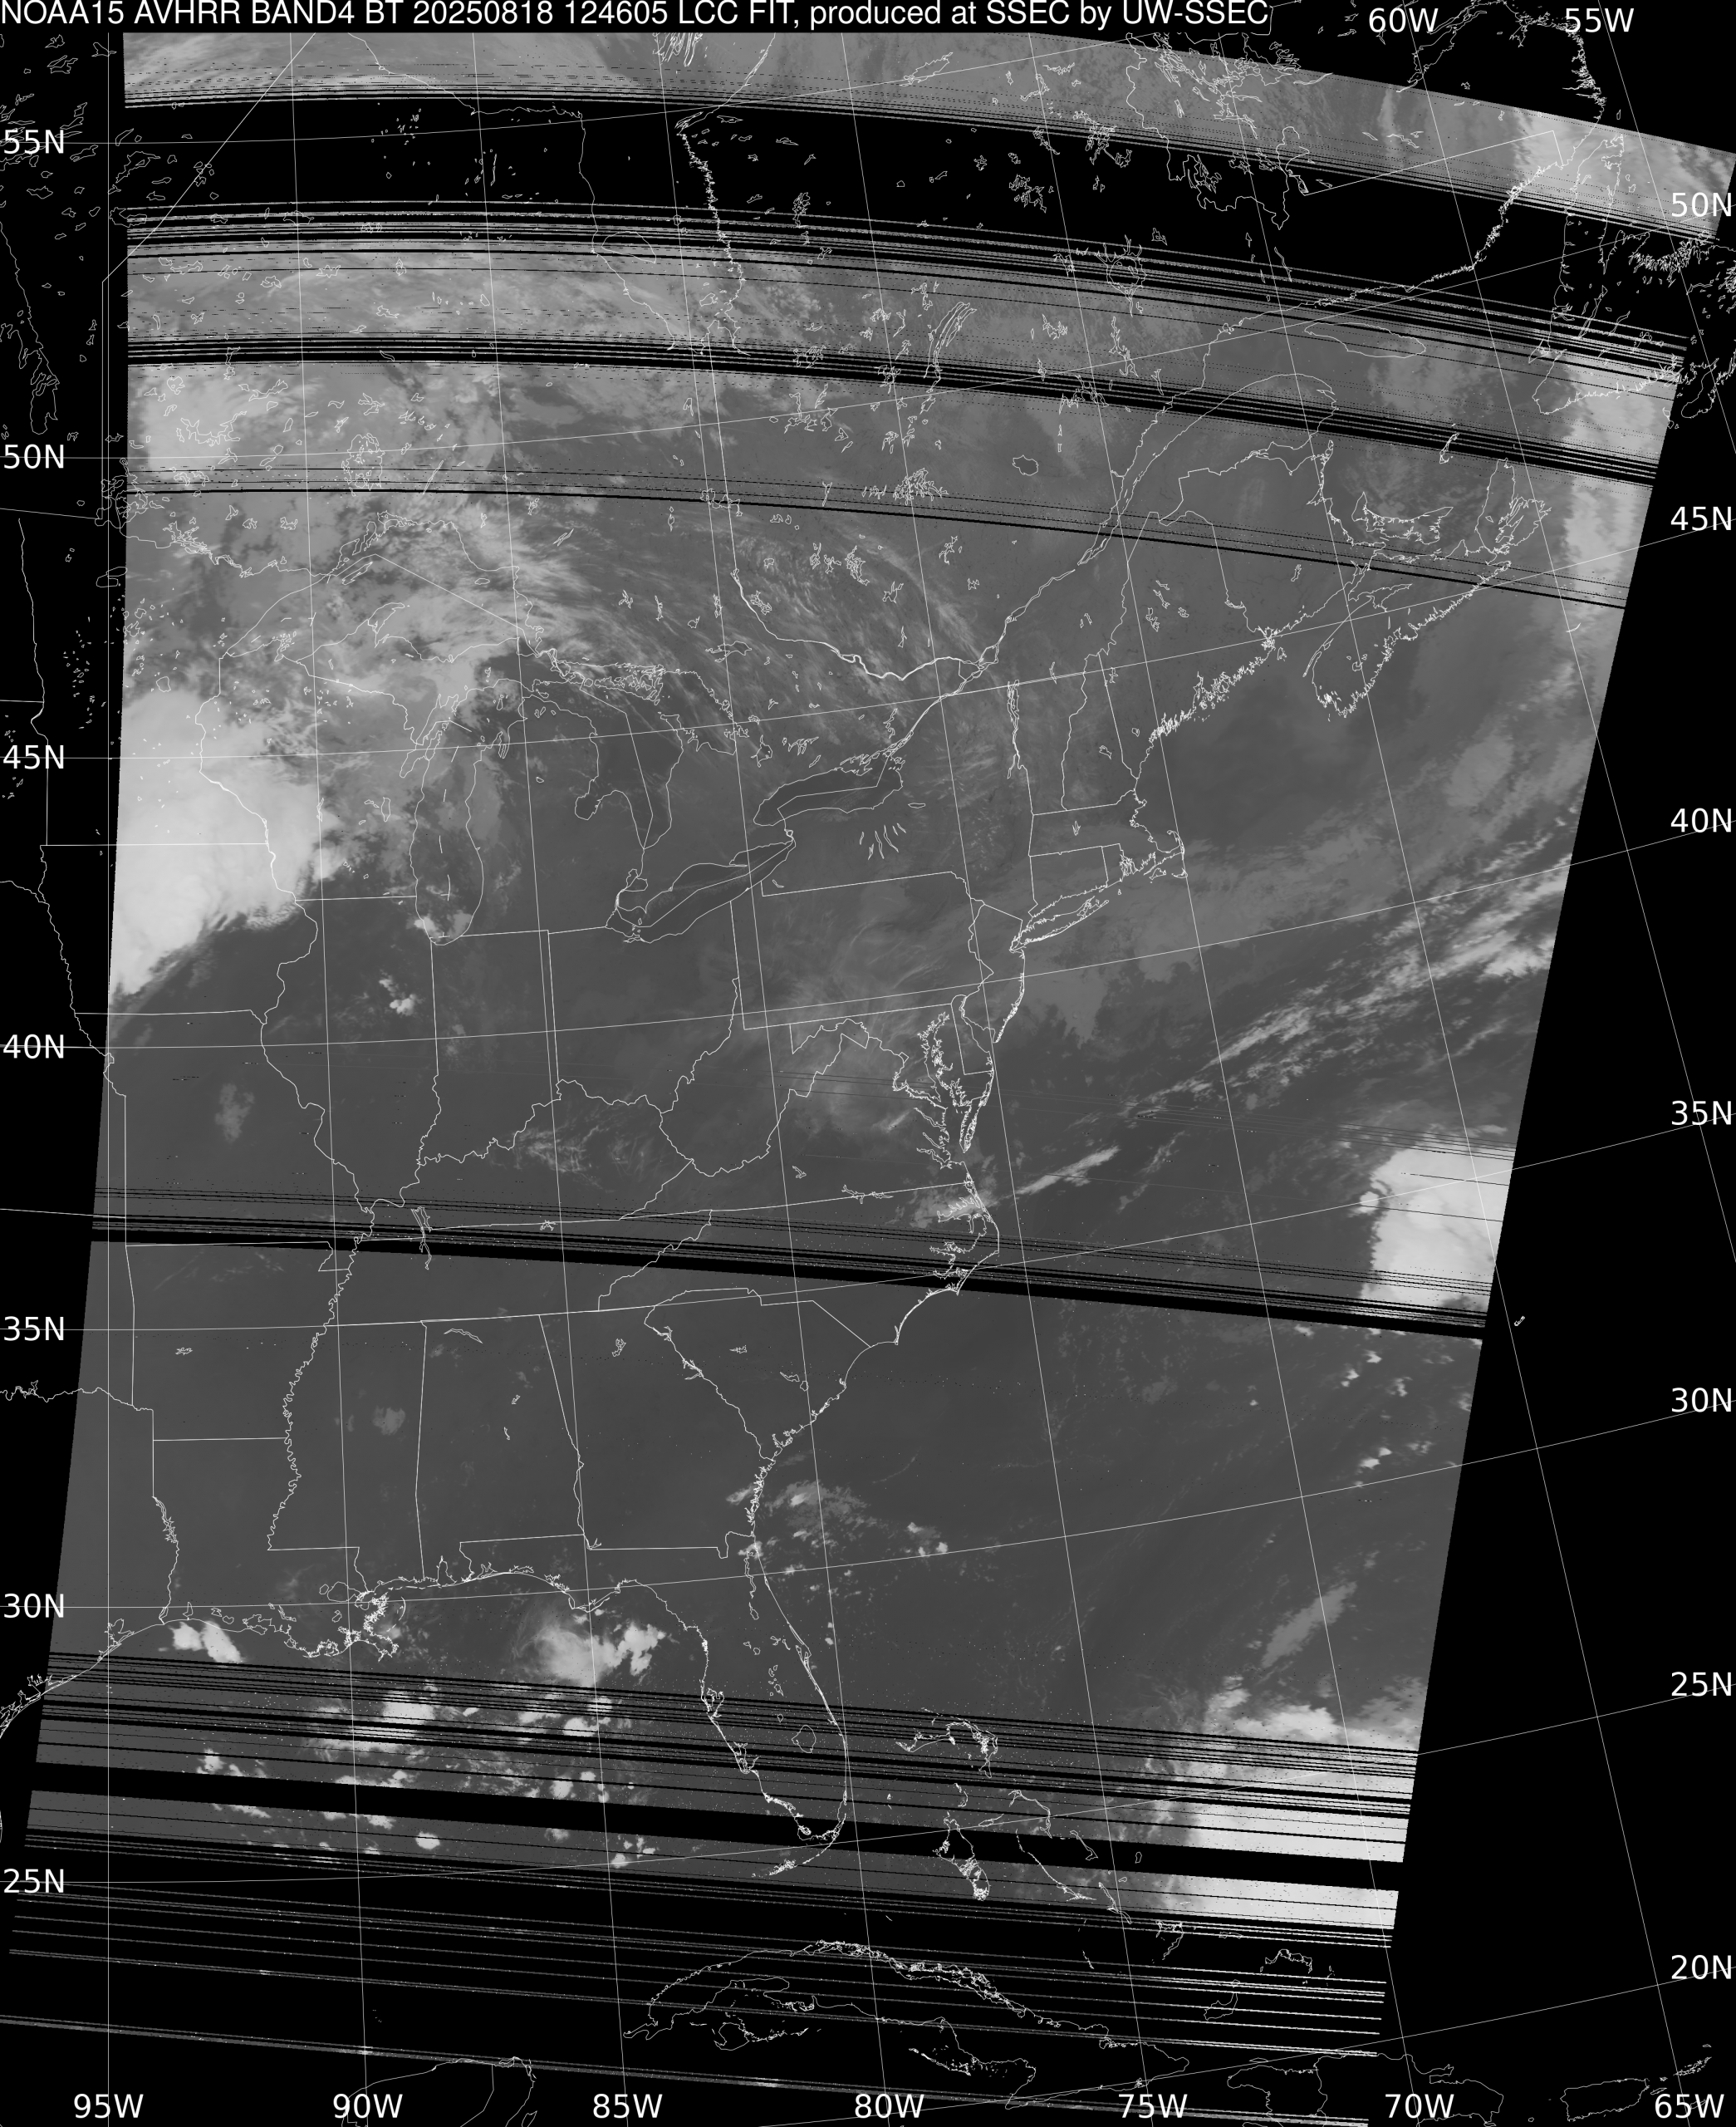
In recent years, NOAA-15’s various instruments have become degraded and thus its data in operations has had limited utility. Additionally, its L-band HRPT direct broadcast antenna was operated at a lower power than other POES satellites, resulting in more frequent data dropouts during reception. With that said, there was still some interesting data coming from NOAA-15’s AVHRR imager as of its last active pass over SSEC’s Madison X/L-band DB antenna on 12:46 UTC on August 18th:
[Inactive]
AVHRR Band 1: “Red Visible” [0.63 µm]
AVHRR Band 2: “Vegetation Near-IR” [0.86 µm]
AVHRR Band 3A: “Snow/Ice Near-IR” [1.61 µm]
AVHRR Band 3B: “Shortwave IR Window” [3.74 µm]
AVHRR Band 4: “Legacy IR Window” [10.8 µm]
AVHRR Band 5: “Dirty IR Window” [12.0 µm]
Notably, NOAA-15 was the final active satellite to broadcast an Automatic Picture Transmission (APT) signal. APT was an analog direct broadcast format first developed in the 1960s, and was onboard the legacy POES and precursor spacecraft. Broadcast in the VHF range around 137 MHz, APT was easy to pick up with inexpensive radio frequency equipment. It was engineered in such a way that it did not require a tracking antenna to receive, so a simple V-dipole antenna in a fixed location could pick up the signal as the satellite tracked across the sky. Given these traits, and the availability of cheap software defined radios (SDRs) since the 2010s, APT reception was a common beginner project in the satellite/radio hobbyist communities. In May 2025, I set up a temporary APT receive station in rural northern Wisconsin, using an off-the shelf V-dipole kit, SDR, filter/amplifier, and single board computer:
Douglas’ APT reception setup in May 2025. The V-dipole antenna is at the top of the ladder, the filter/amplifier on the SMA RF cable, and the SDR and computer was inside the gray waterproof box at the bottom.
Raw APT was transmitted as an audio signal, one line at a time, and the final output (when decoded) contained images from 2 of the AVHRR bands. At any given time, the two bands being sent were configured by the NOAA ground station – during the daytime, bands 2 (left) and 4 (right) were the most common. The spatial resolution was downscaled to roughly 4 km, and the nature of the analog format made it susceptible to interference from many types of equipment. However, with the right hobbyist-grade equipment and a clear view between the satellite and receive station, it was possible to get fairly usable imagery via APT.
NOAA-15 raw APT data received at 14:42 UTC on May 29, 2025, including AVHRR bands 2 and 4 over the central/western CONUS.
With the legacy NOAA POES constellation now turned off, NOAA’s low-earth orbiting weather satellite efforts continue with the JPSS constellation, with S-NPP, NOAA-20, and NOAA-21 all in orbit now and two additional missions planned. NOAA’s partners at EUMETSAT have been busy, with the recent launch of their first spacecraft in the MetOp Second Generation series, MetOp-SG-A1, and their prototype passive microwave sounder mini-satellite, Arctic Weather Satellite, now operational. Also, JAXA recently launched its next-generation passive microwave imager, AMSR3, on the satellite GOSAT-GW, which will replace AMSR2 on GCOM-W1.


