
1-minute Mesoscale Domain Sector GOES-19 (GOES-East) Visible and Infrared images (above) showed the WNW motion of the eye of Hurricane Erin during a 7-hour period as the tropical cyclone rapidly intensified from a Category 4 storm at 0950 UTC to a Category 5 storm at 1520 UTC, north of the Leeward Islands on... Read More
1-minute GOES-19 Visible and Infrared images with plots of GOES-19 GLM Flash Points, from 1000-1700 UTC on 16 August [click to play MP4 animation]
1-minute Mesoscale Domain Sector GOES-19
(GOES-East) Visible and Infrared images
(above) showed the WNW motion of the eye of Hurricane
Erin during a 7-hour period as the tropical cyclone rapidly intensified from a Category 4 storm at
0950 UTC to a
Category 5 storm at
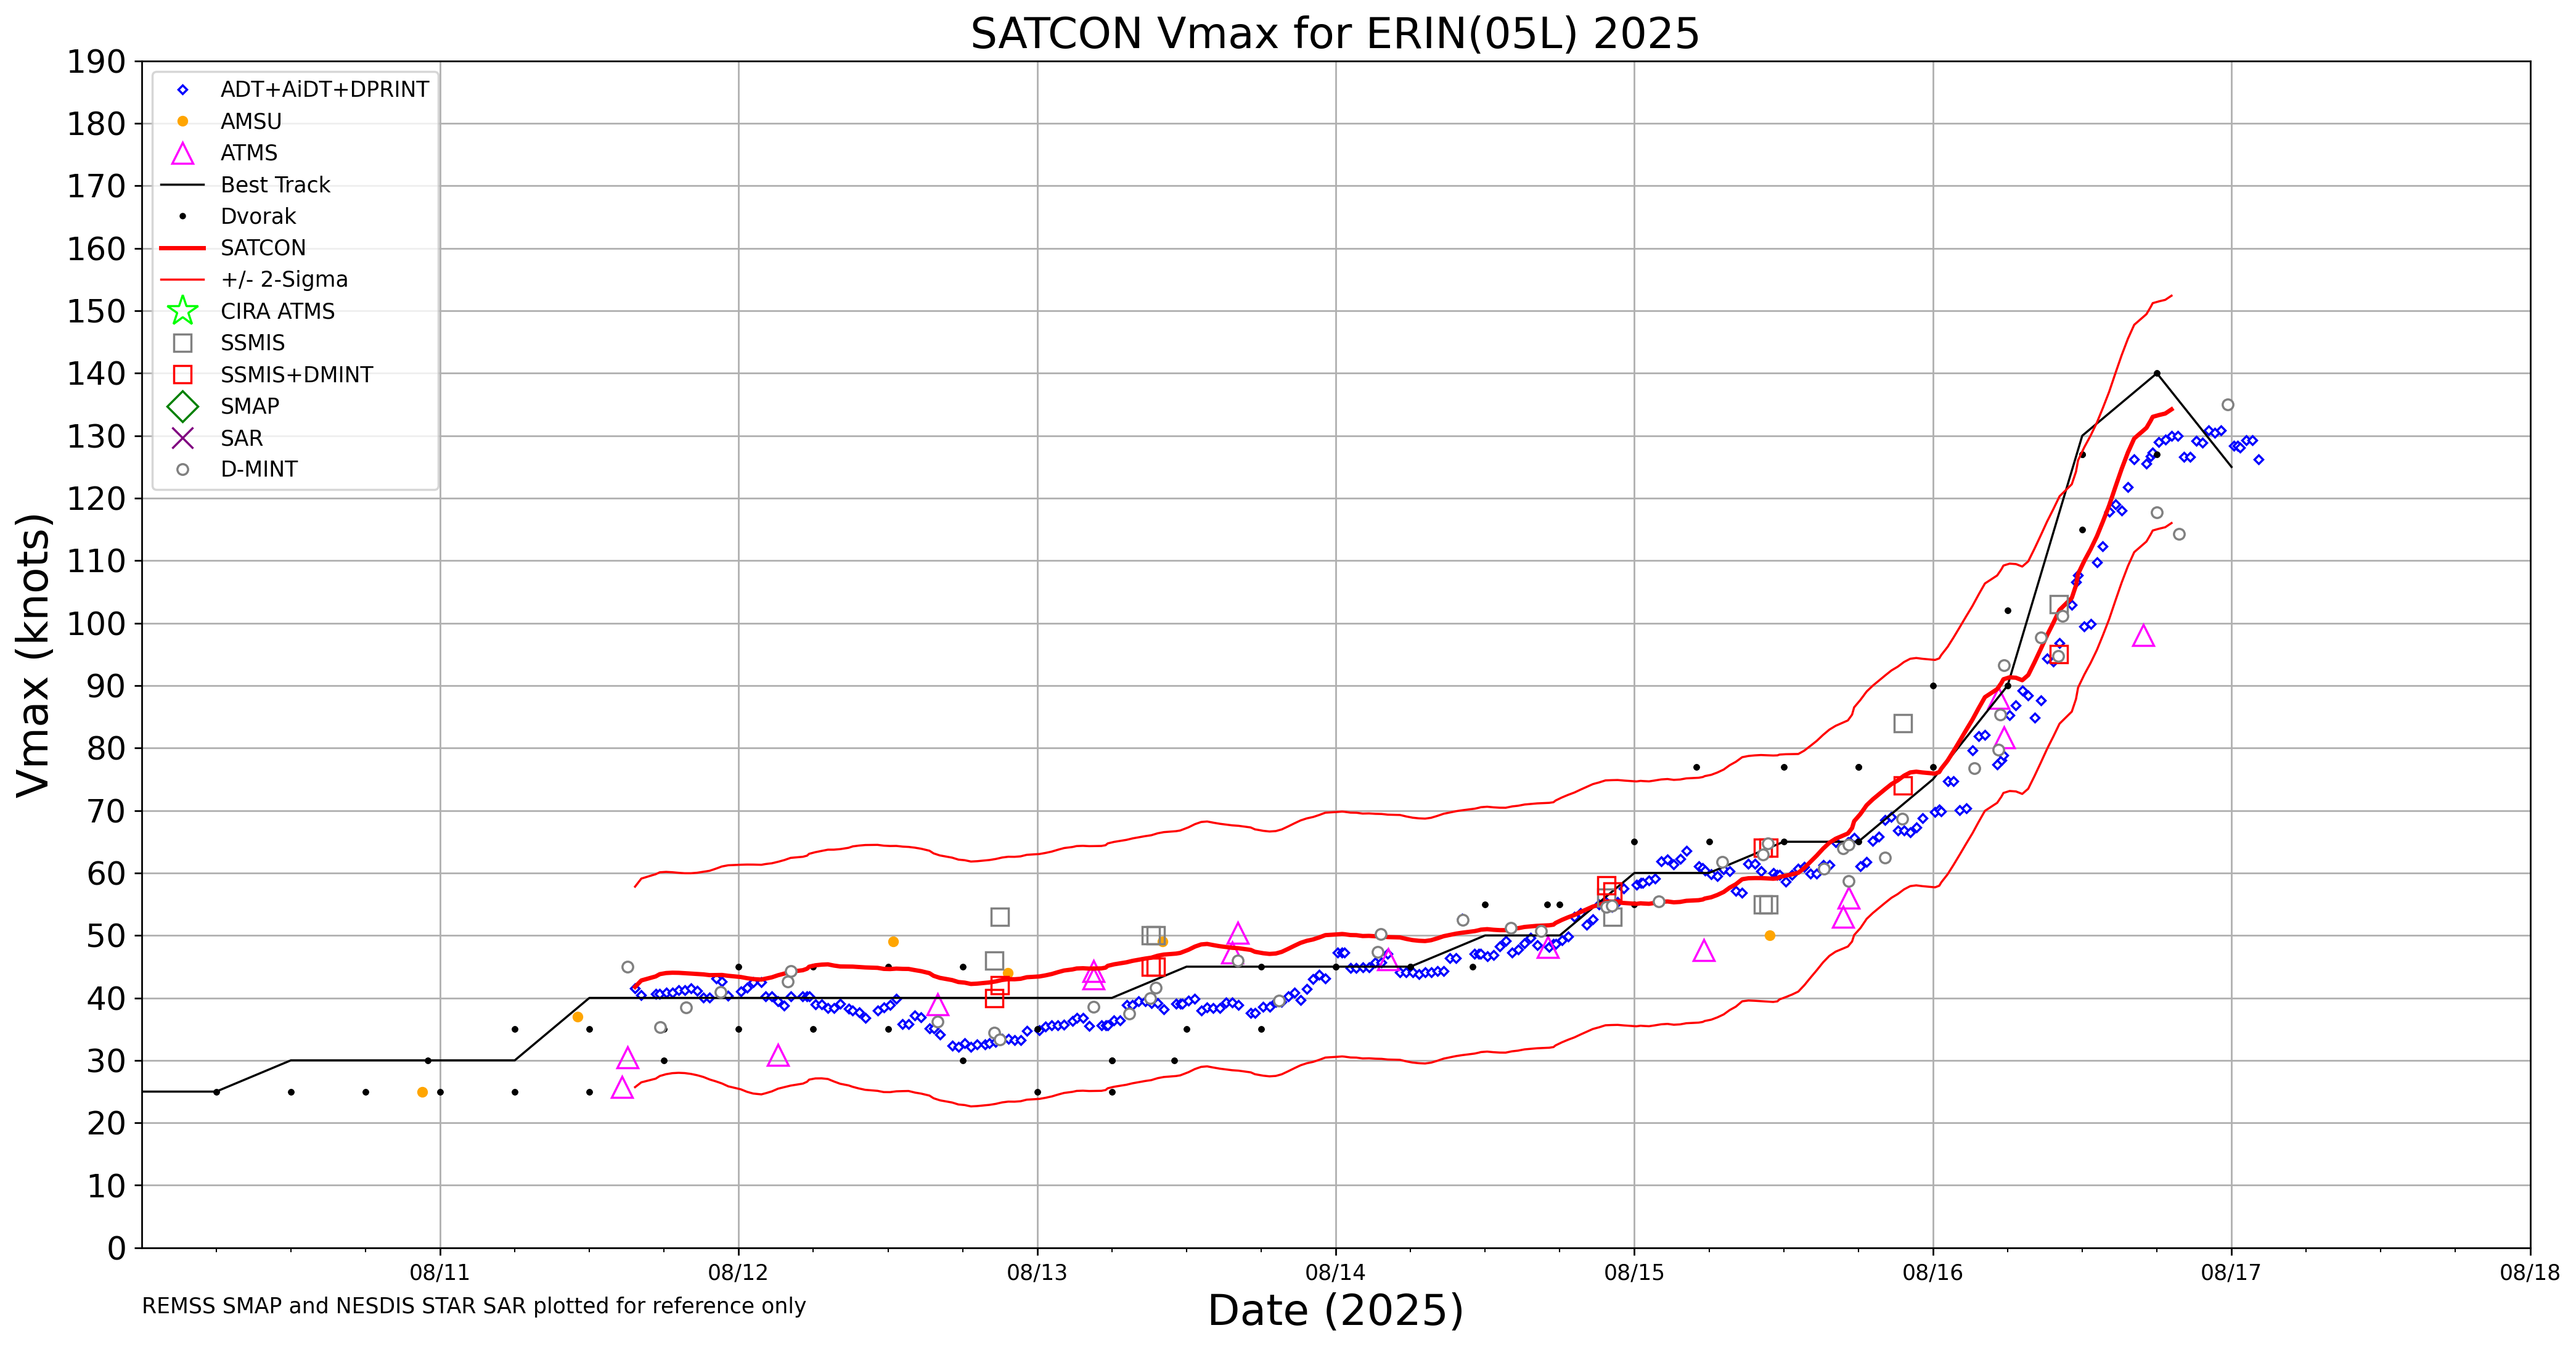
1520 UTC, north of the Leeward Islands on 16 August 2025. Erin was the earliest Category 5 hurricane on record in the Atlantic Ocean, as well as one of the Atlantic’s fastest-intensifying tropical cyclones on record (
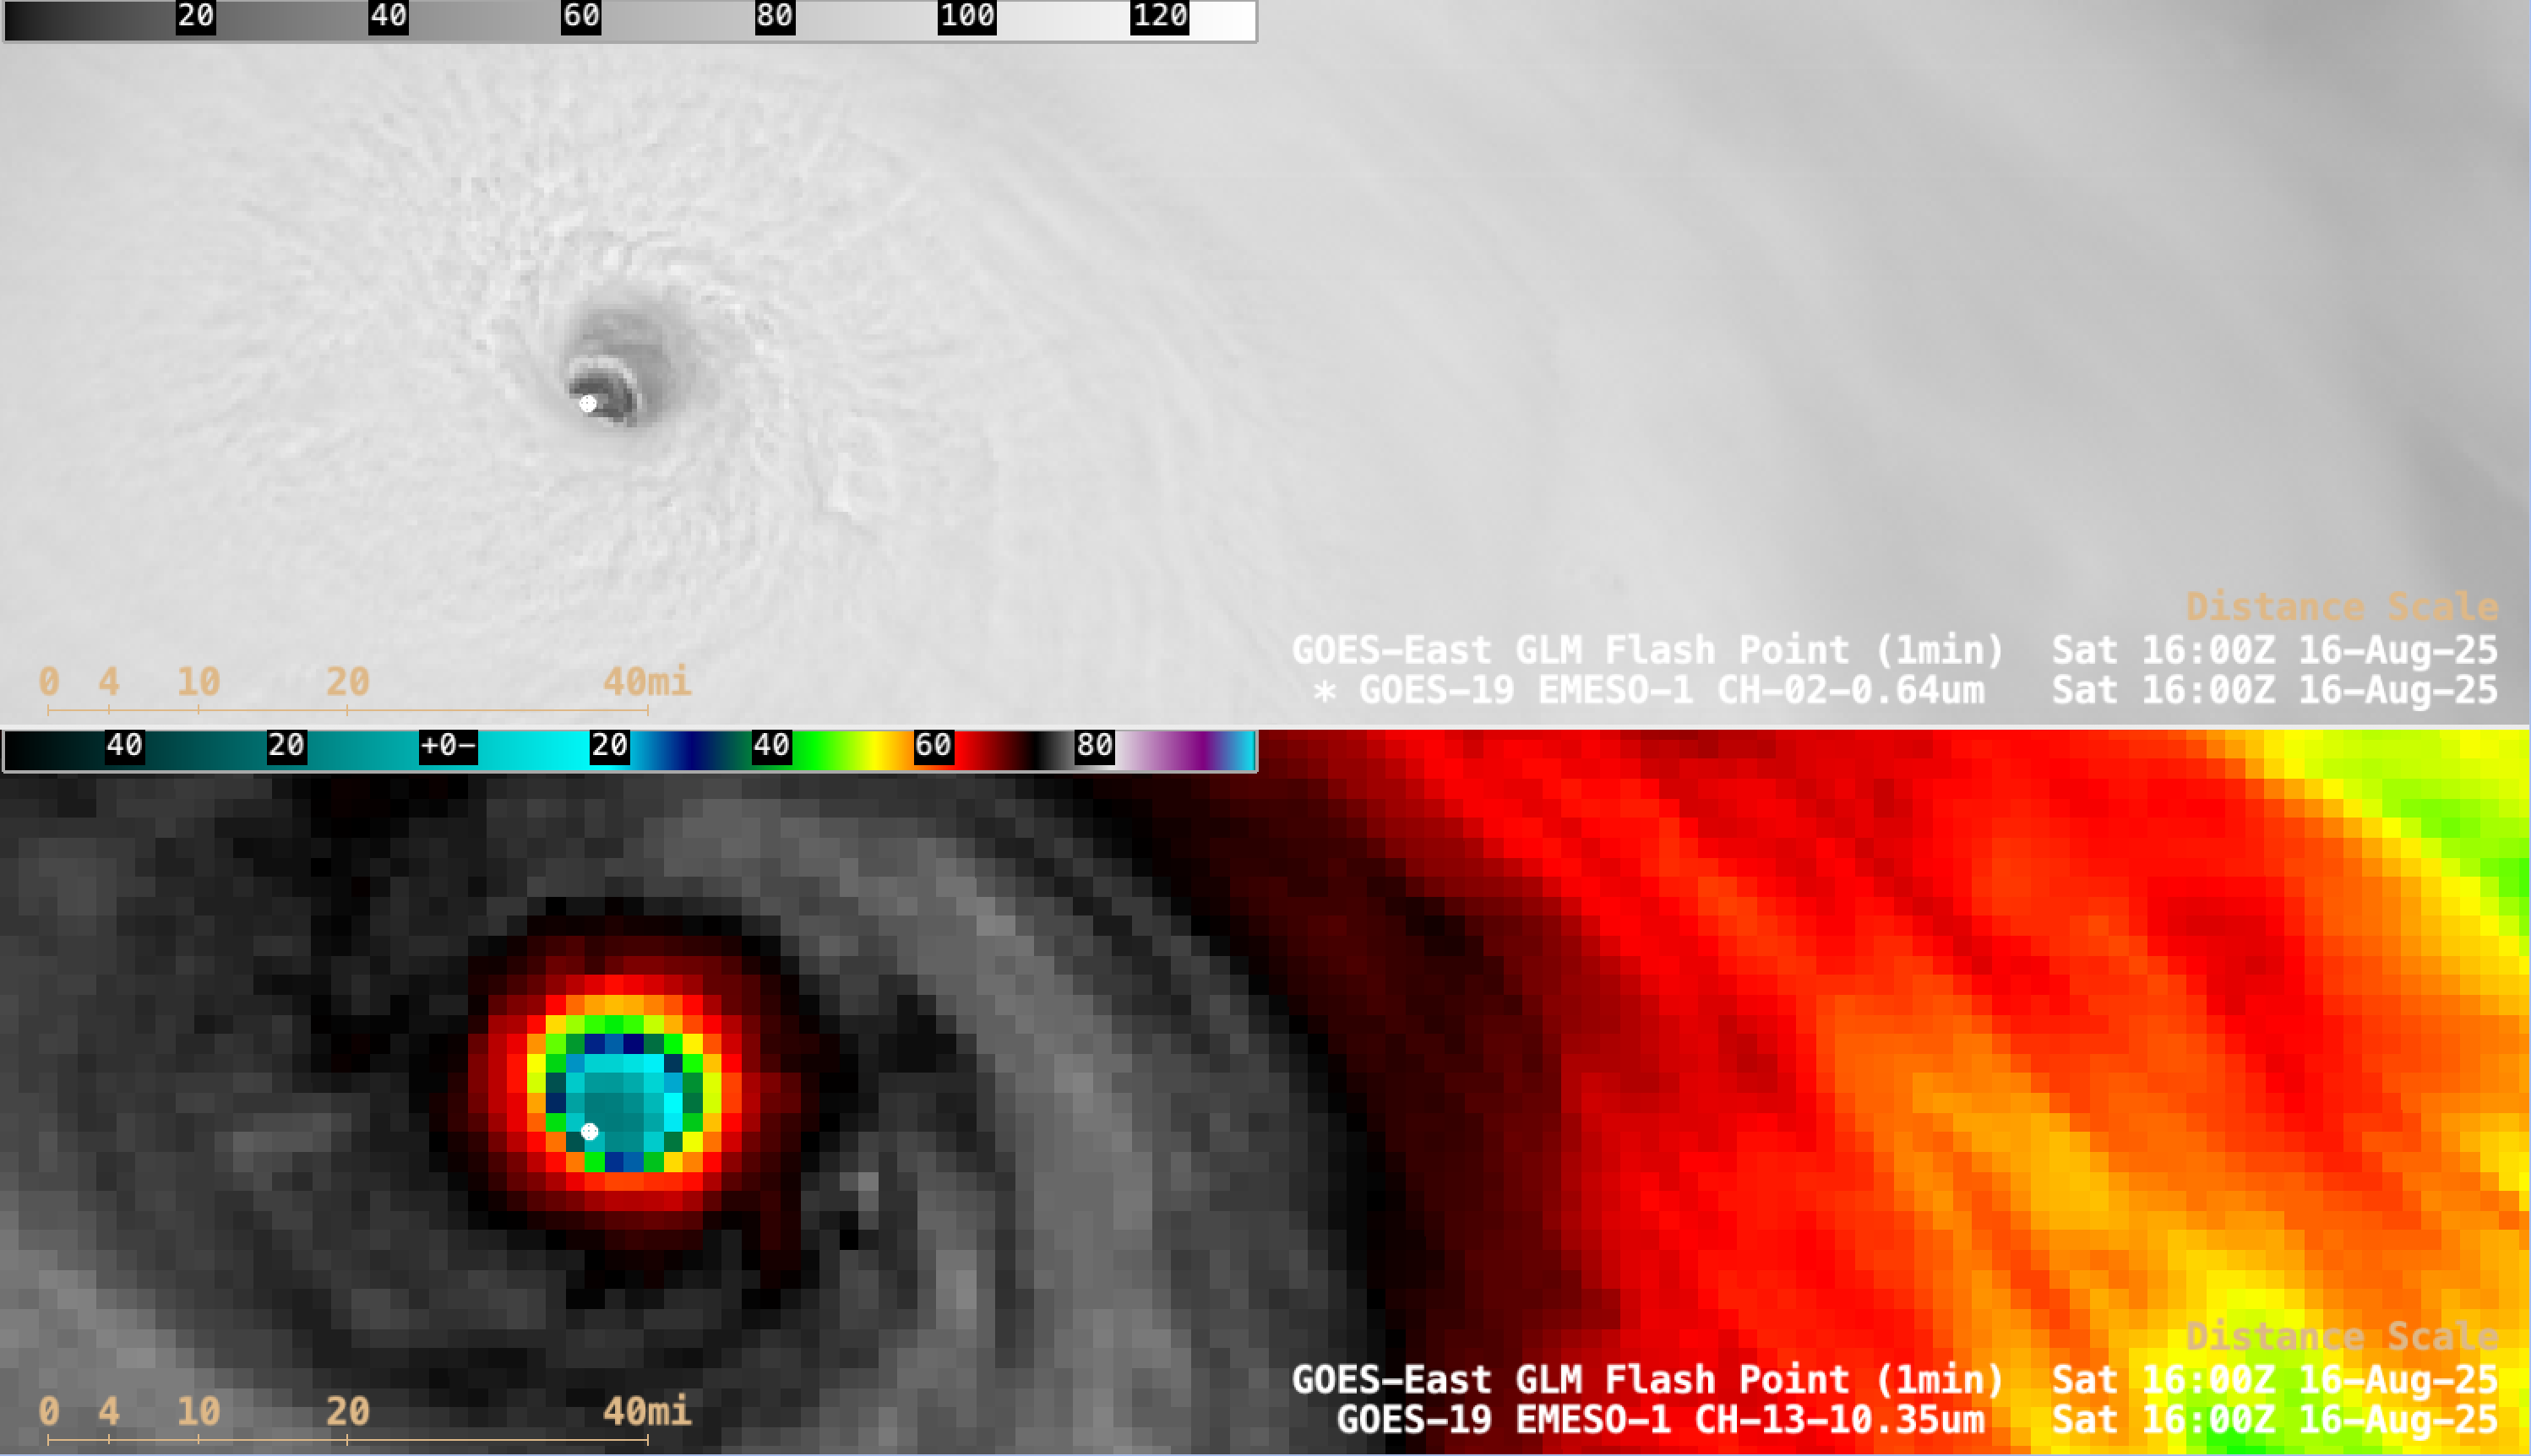
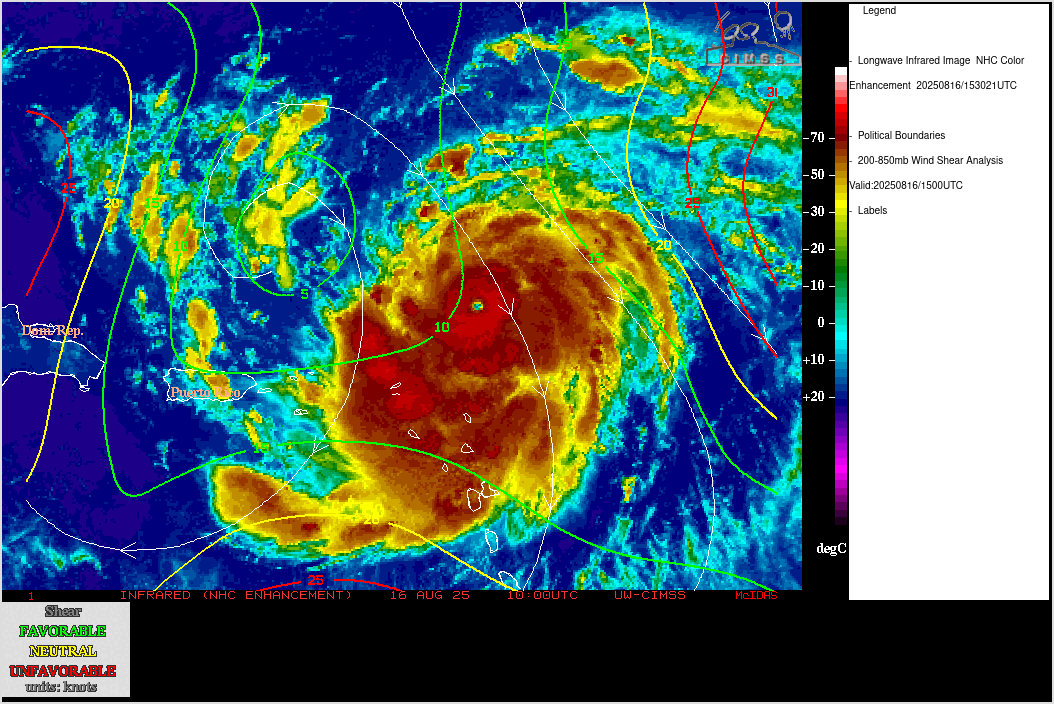
SATCON). Plots of 1-minute GOES-19
GLM Flash Points displayed abundant lightning activity within the inner eyewall of Erin’s pinhole eye. In addition, the eye exhibited a notable stadium effect — with a very small low-altitude eye seen in visible imagery, broadening to a larger high-altitude eye in infrared imagery (for example, at
1657 UTC). The coldest cloud-top infrared brightness temperatures within the eyewall were around -80 C.
A closer view of 1-minute GOES-19 Visible imagery (below) revealed the presence of low-altitude mesovortices within the eye. A pinhole eye and mesovortices within the eye are 2 satellite-observed characteristics often associated with intense Category 5 tropical cyclones. In addition, Erin was moving though an environment of weak deep-layer wind shear and traversing warm sea surface temperatures — 2 factors that favored intensification.
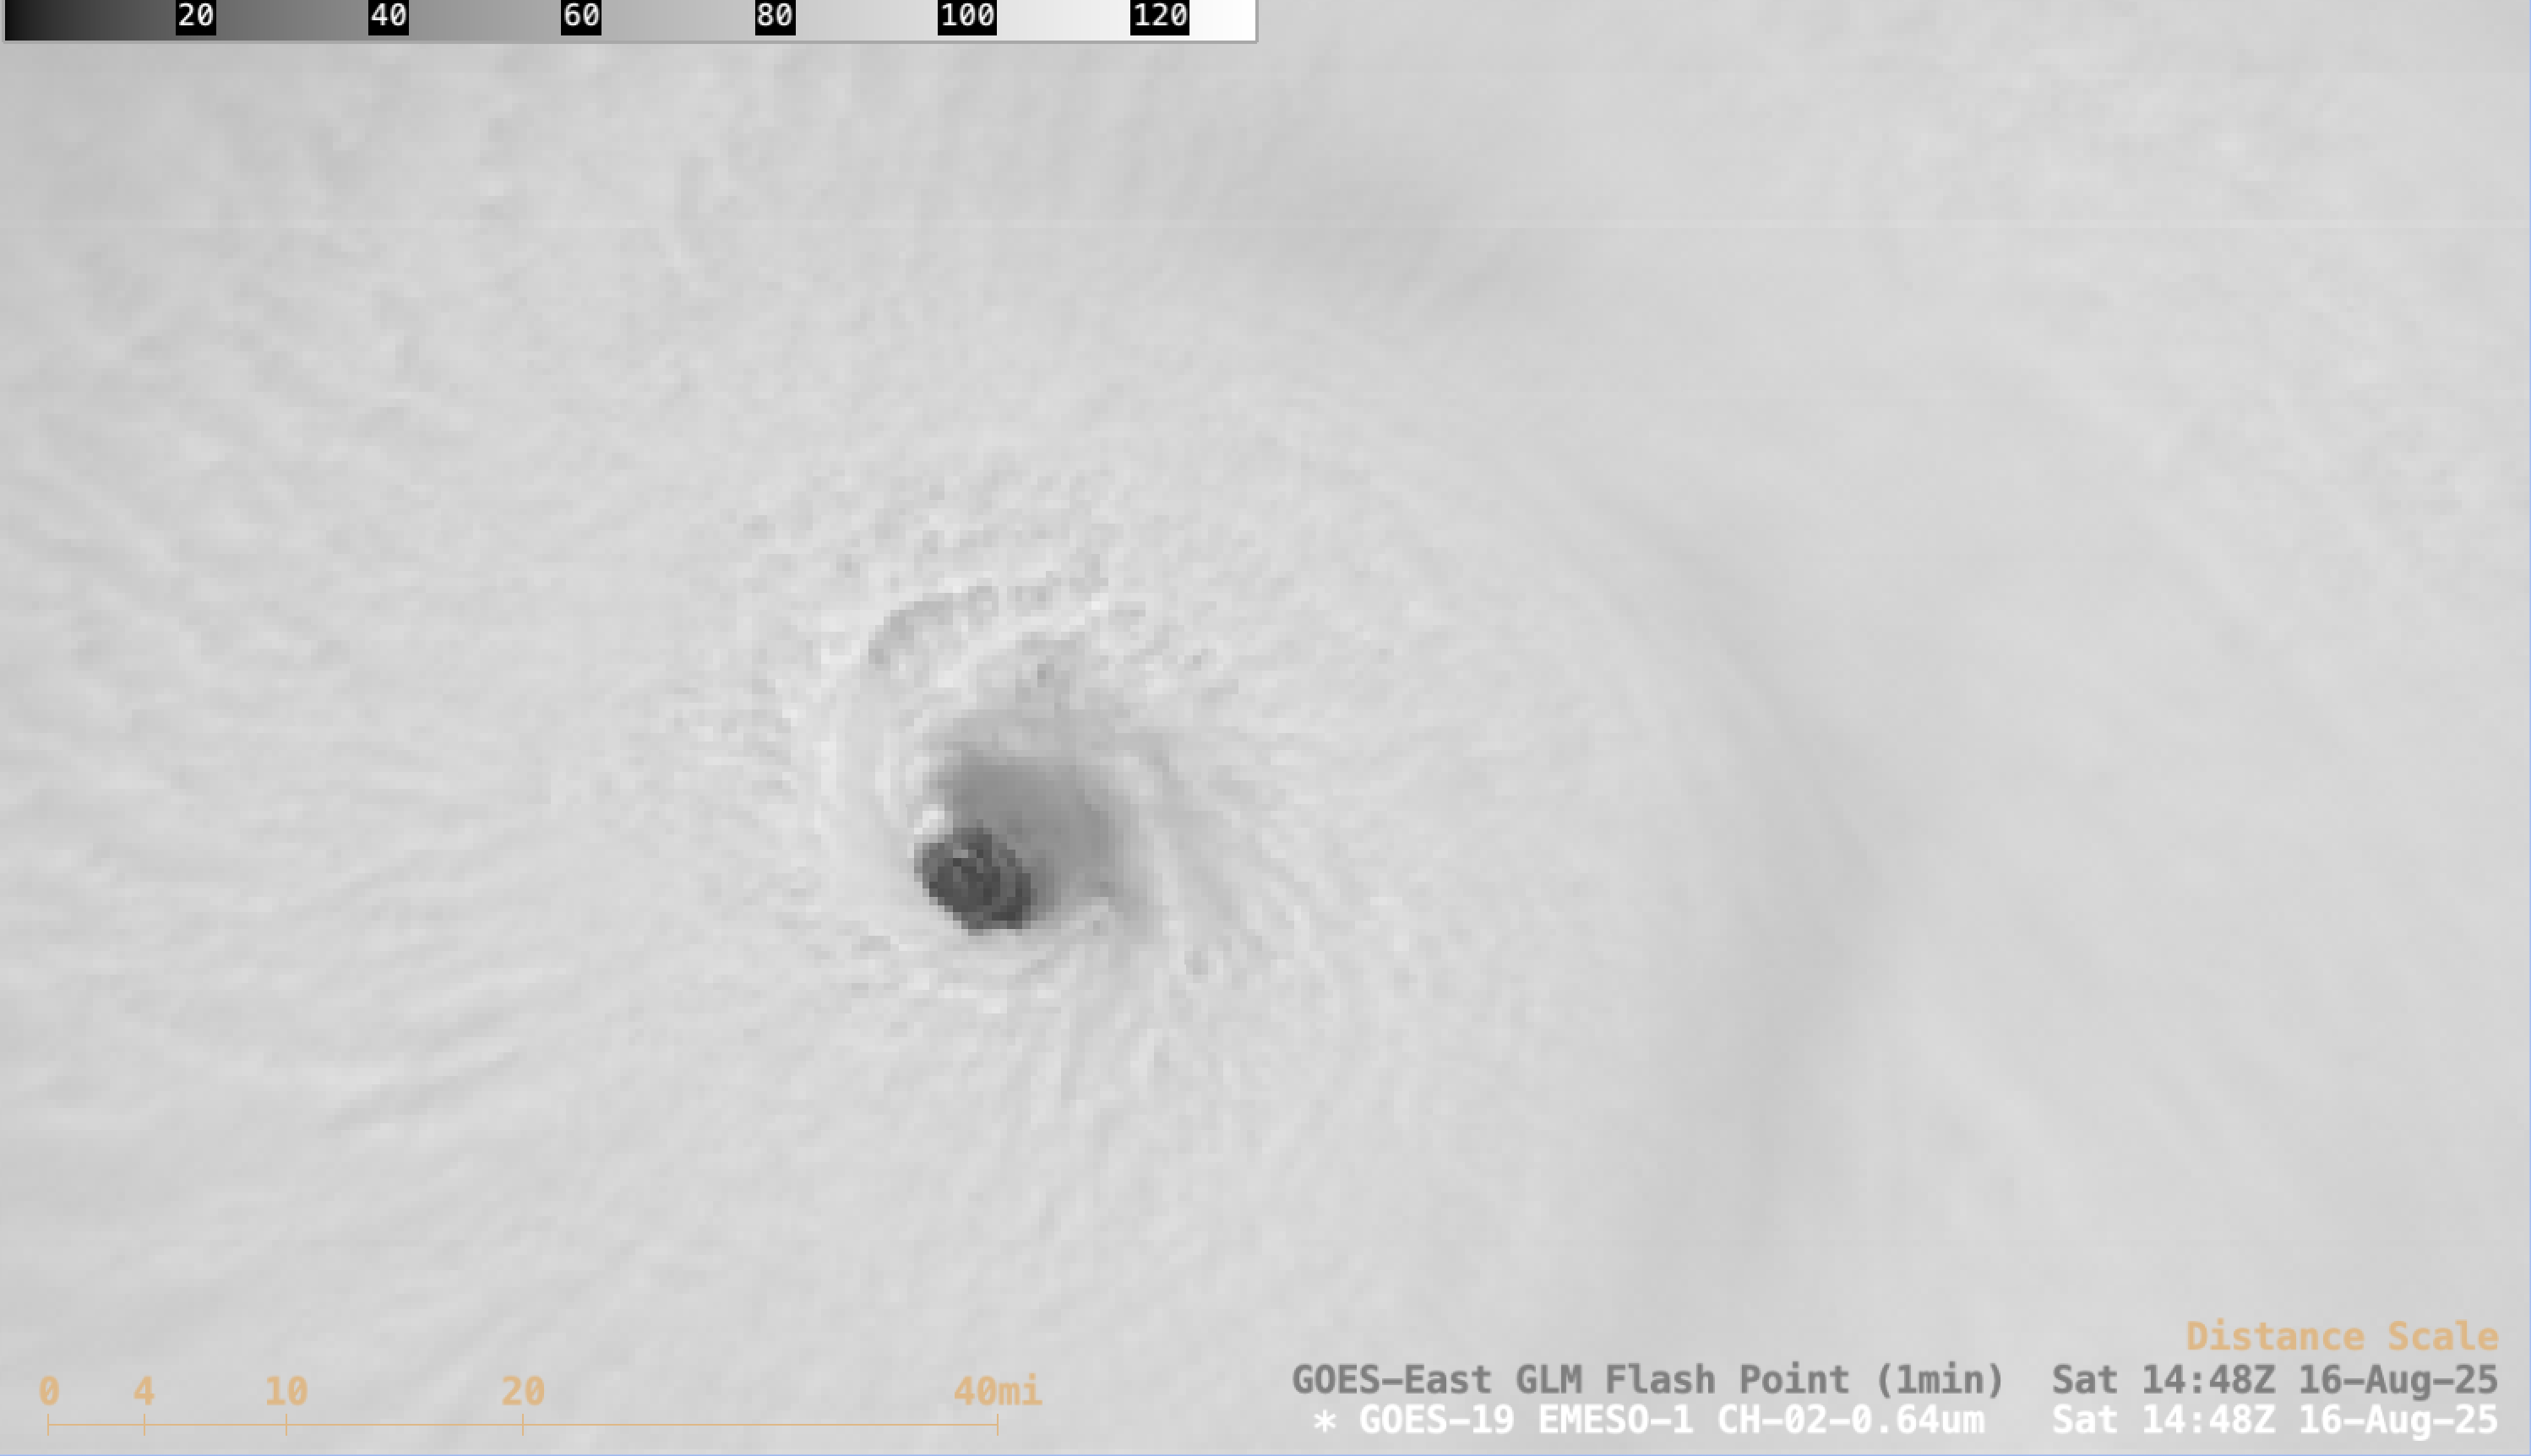
1-minute GOES-19 Visible images, from 1200-1900 UTC on 16 August [click to play MP4 animation]
A GOES-19 Visible image at 1424 UTC
(below) included plots of ASCAT ocean surface winds valid at that time; hurricane-force winds only extended about 10-15 miles from the center of Erin. However, significant rainfall contamination within portions of the eyewall adversely affected the quality of a few of the scatterometer winds (with 3 erroneous wind directions seen near the eye).
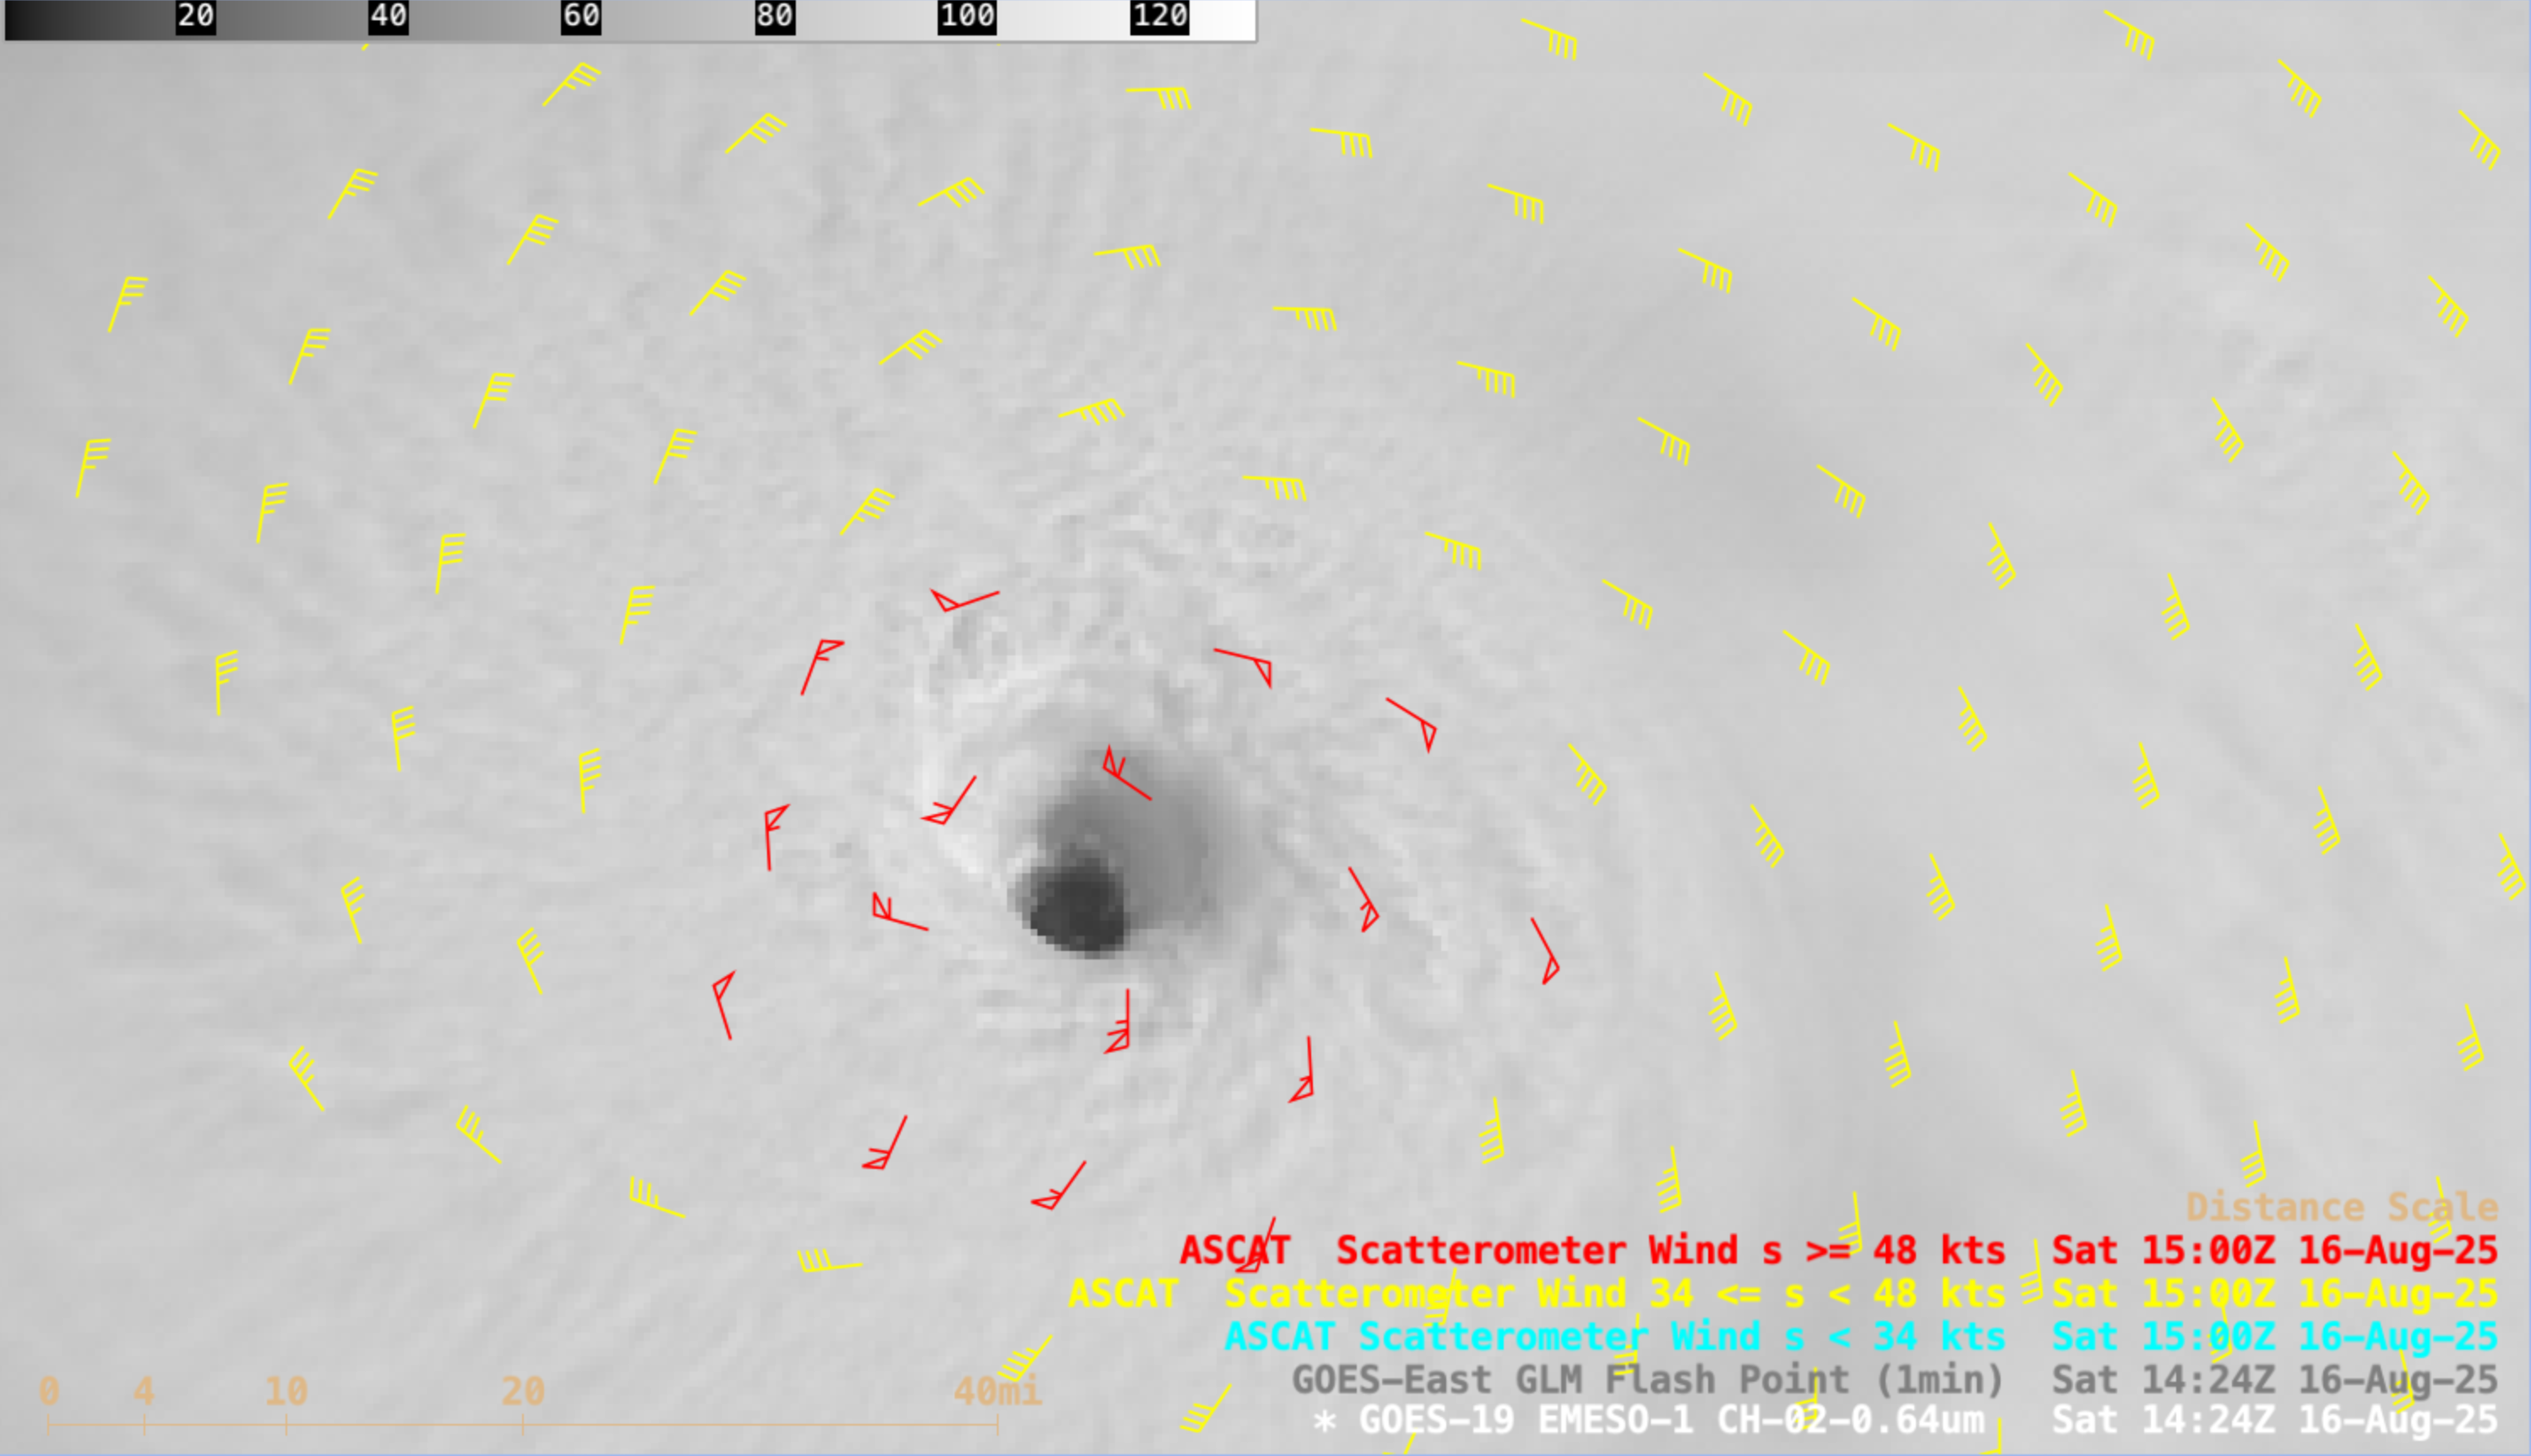
GOES-19 Visible image at 1424 UTC on 16 August, with plots of ASCAT ocean surface winds [click to enlarge]
A Synthetic Aperture Radar (SAR) image from RCM-3 at 2229 UTC on 16 August
(below) depicted a peak radial wind velocity of 123 kts in the
SE quadrant of Erin (
source) — this was around the time that the hurricane was undergoing an eyewall replacement cycle, and decreasing in intensity from a Category 5 at
2100 UTC to a Category 4 at
0000 UTC.

RCM-3 Synthetic Aperture Radar (SAR) image at 2229 UTC on 16 August [click to enlarge]
Later that evening, 1-minute GOES-19 Infrared images
(below) showed that the eye of Category 4 Hurricane Erin passed about 40 miles south of
Buoy 41043 — which reported hourly wind gusts of 64 kts at 0200 UTC and 0300 UTC on 17 August (the highest 10-minute wind gust was 66.1 kts at 0250 UTC).

1-minute GOES-19 Infrared images and GLM Flash Points from 2300 UTC on 16 August to 0500 UTC on 17 August, with hourly plots of weather at Buoy 41043 [click to play MP4 animation]
Plots of wind speed / wind gusts / atmospheric pressure and wave height at Buoy 41043
(below) indicated that their maximum (or minimum, in terms of pressure) values occurred around 0300 UTC on 17 August (just as the eye of Erin was passing south of the Buoy).
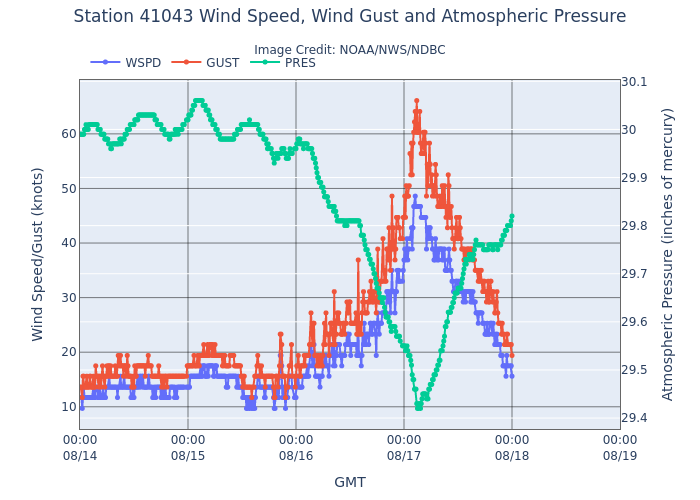
Plots of wind speed (blue), wind gusts (red) and pressure (green) at Buoy 41043

Plot of wave height at Buoy 41043
The maximum wave height of 29 ft measured at Buoy 41043 was commensurate with the 25.32 ft significant wave height sensed by Sentinel-3A (and the 39.52 ft sensed by SWOT) farther to the south, near the northern Leeward Islands, during the morning hours (1237 UTC and 1428 UTC) on 16 August (below).
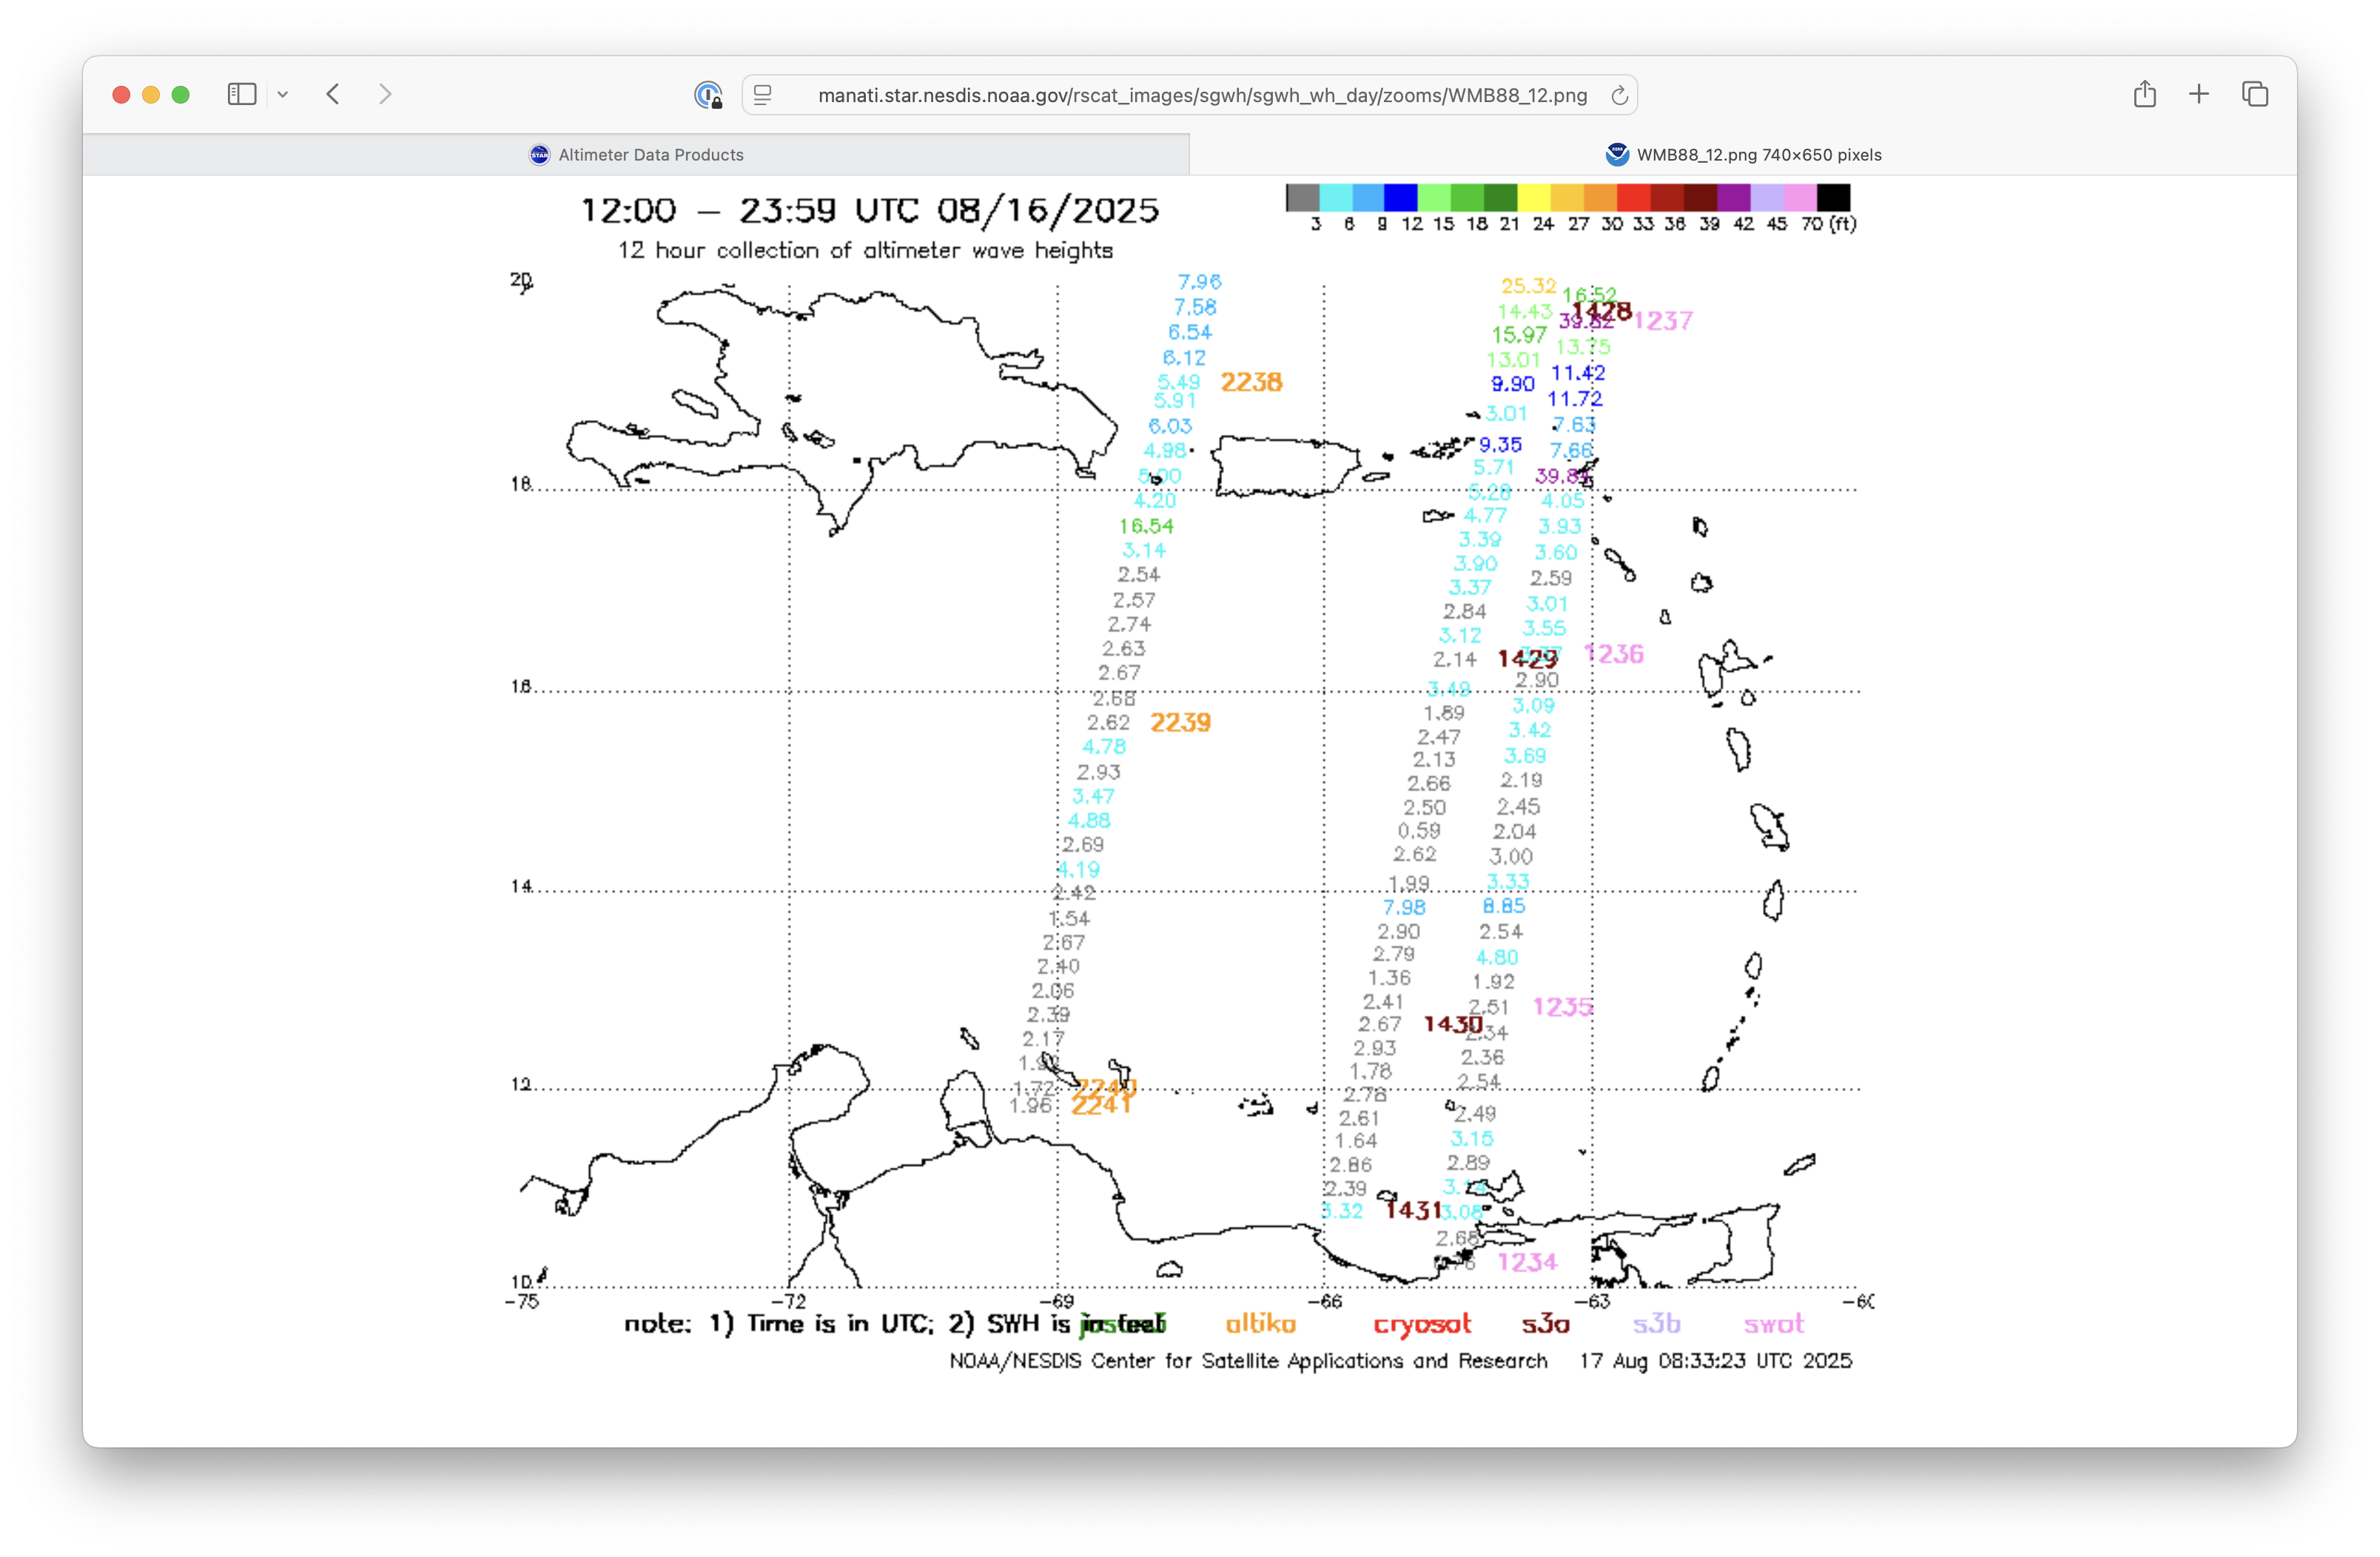
Significant wave heights (in feet) in the vicinity of the Leeward Islands on the morning of 16 August, as sensed from Sentnel-3A (brown time stamps, center swath) and SWOT (violet time stamps, eastern swath) [click to enlarge]
View only this post
Read Less


