
The Great Lakes have a significant amount of thermal mass, meaning it takes a long time for them to cool down as the seasons change from summer to autumn. Often during this time of year, the air overlying the lakes is warmer than the lakes themselves. As water evaporates from the lake surface into the cold, dry air above, it quickly condenses into fog. GOES-19 and the NOAA Buoy Network can work together to identify such an event.
NOAA’s buoys are preimarily intended to measure waves and winds, but many of them have air and water temperatures as well. Here’s a time series of the recent air and water temperature observations from NOAA’s West Superior buoy, located in the middle of western Superior about 30 miles northeast of the Apostle Islands. Here, it is clear that since about 0500 UTC (midnight local time) on 10 September, the water temperature has been at or above the air temperature.

This is a clear recipe for fog as the unsaturated air quickly becomes overwhelmed with moisture that has evaporated from the lake. The buoy itself can confirm this, as it has a system of cameras that show an up close and personal view of conditions at that site.

Of course, there are only a handful of buoys in the otherwise vast expanse of Lake Superior. Most of the lake has no in situ information at all. This is yet another case where satellites can be useful. However, satellite observations of fog can be challenging, especially when relying on the infrared band. This is because fog is such a low cloud that its brightness temperature is effectively the same as the land. Take, for example, this view of the Band 13 (10.7 micron) infrared window channel. Clouds are easy to discern over the upper peninsula of Michigan and eastern Wisconsin, but things are much murkier over western Lake Superior. Is the fog uniform across the lake, or are there clearing spots that cannot be seen from this view because the lake and fog temperatures are basically the same?
This is where RGB views can help add significant insight. In the Day Microphysics view (shown here because local time is from 9-10 AM for these loops) it is evident that there is clearing along the Minnesota shore, where the blue of the surface can be clearly discerned by the greyish color of the fog. Such clearing is impossible to discern from the infrared satellite.
SSEC Researcher Kathy Strabala notes that during the portions of the lunar cycle where the moon is providing a lot of illumination, VIIRS can provide visible-like imagery at night that can also aid in fog detection. For this event, the closest full moon was on 7 September, just two days before. The following image from the VIIRS Direct Broadcast antenna at CIMSS Headquarters illustrates the impact of the moon’s light perfectly. Note that even though it is night, it is easy to see where the fog ends. Thanks, Kathy!

____________________
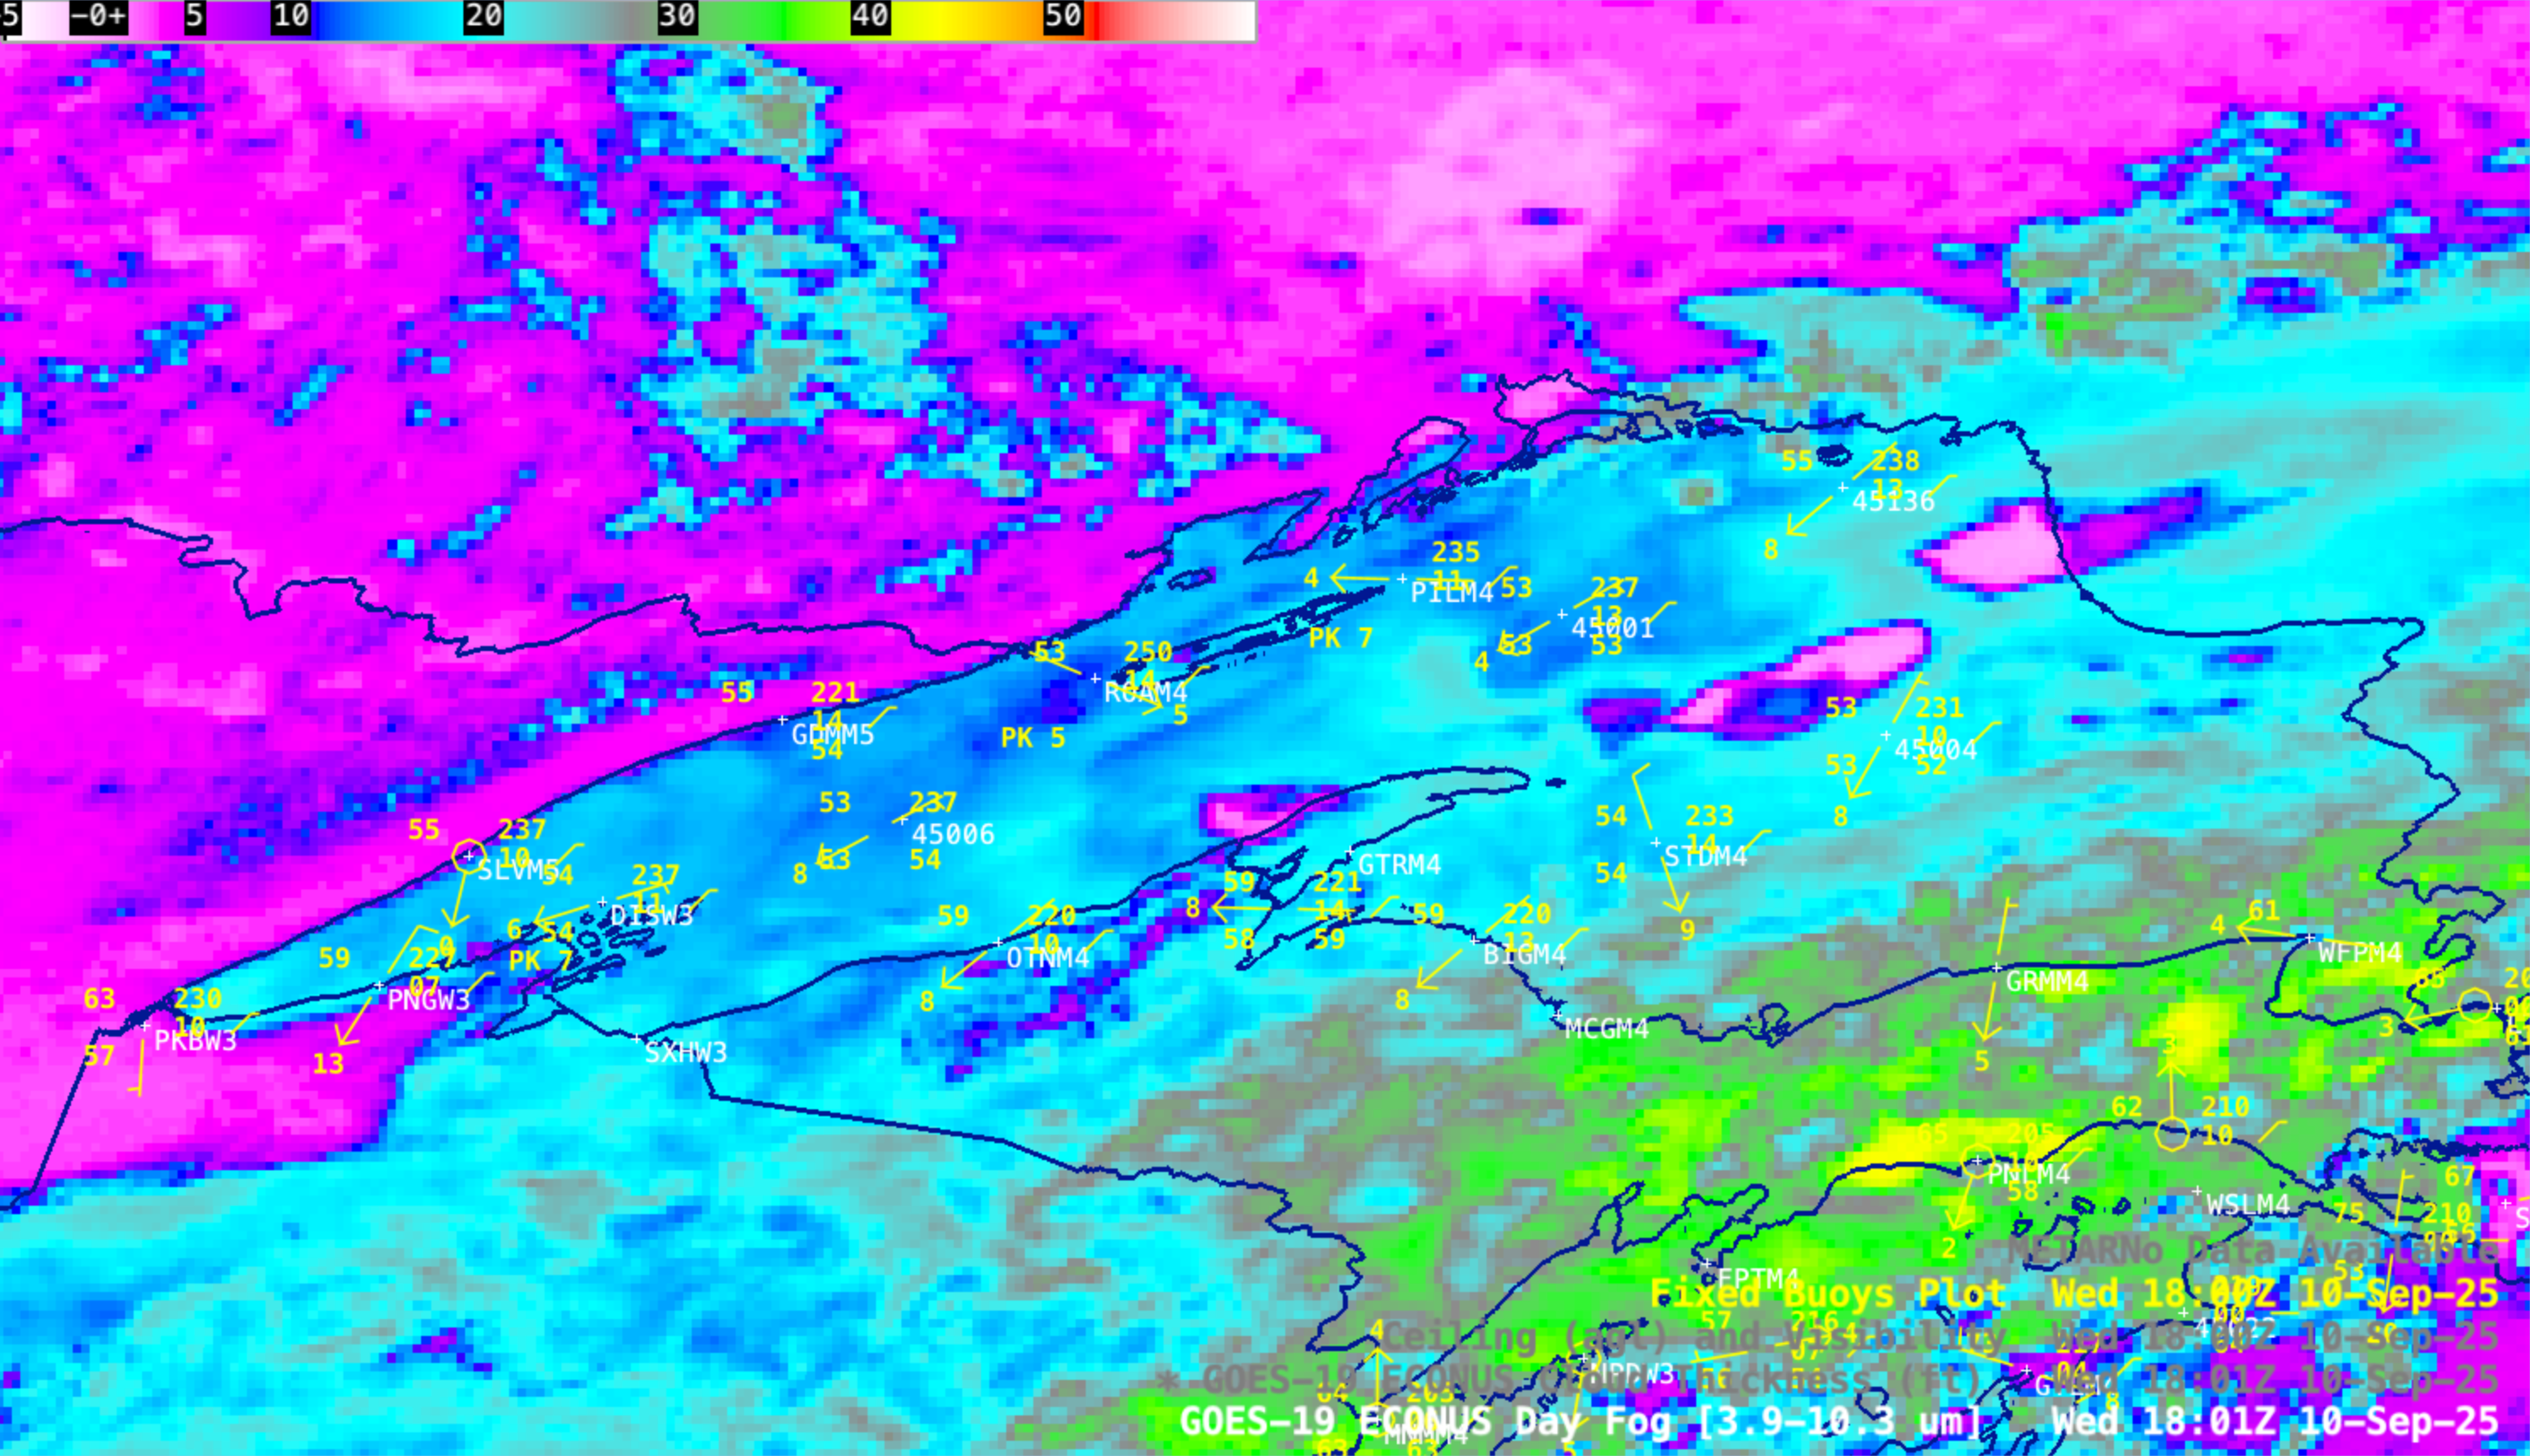
5-minute GOES-19 Day Fog BTD (3.9 µm – 10.3 µm) images with buoy observations plotted in yellow, from 1301-1801 UTC on 10 September (courtesy Scott Bachmeier, CIMSS) [click to play MP4 animation]
GOES-19 Day Fog brightness temperature difference (BTD) images with plots of buoy data (above) revealed that Lake Superior buoy water temperatures were generally in the 52-54 F range, with air temperatures within 1-2 degrees F of the water temperatures.
The corresponding Day Fog BTD images with plots of METAR surface reports (below) helped to explain why the aforementioned gap in the fog off the North Shore of Minnesota began to fill in after about 1501 UTC — this was in response to the development of a lake breeze (note the shoreline-parallel cloud line that formed not far inland, along the leading edge of the lake breeze) as daytime heating progressed across the Arrowhead of Minnesota. This lake breeze then acted to draw the fog edge toward the coast.

5-minute GOES-19 Day Fog BTD (3.9 µm – 10.3 µm) images with METAR surface reports plotted in white, from 1301-1801 UTC on 10 September (courtesy Scott Bachmeier, CIMSS) [click to play MP4 animation]
The GOES-19 Cloud Thickness derived product (below) showed that much of the fog across western Lake Superior was 500-1000 ft thick.

5-minute GOES-19 Cloud Thickness derived product with buoy observations plotted in yellow, from 1401-1801 UTC on 10 September (courtesy Scott Bachmeier, CIMSS) [click to play MP4 animation]
A 30-meter resolution Landsat-8 “Natural Color” RGB image at 1652 UTC (below) displayed the intricate and non-uniform structure of the top of the lake fog layer — and also highlighted the presence of an undular bore east of the Apostle Islands.
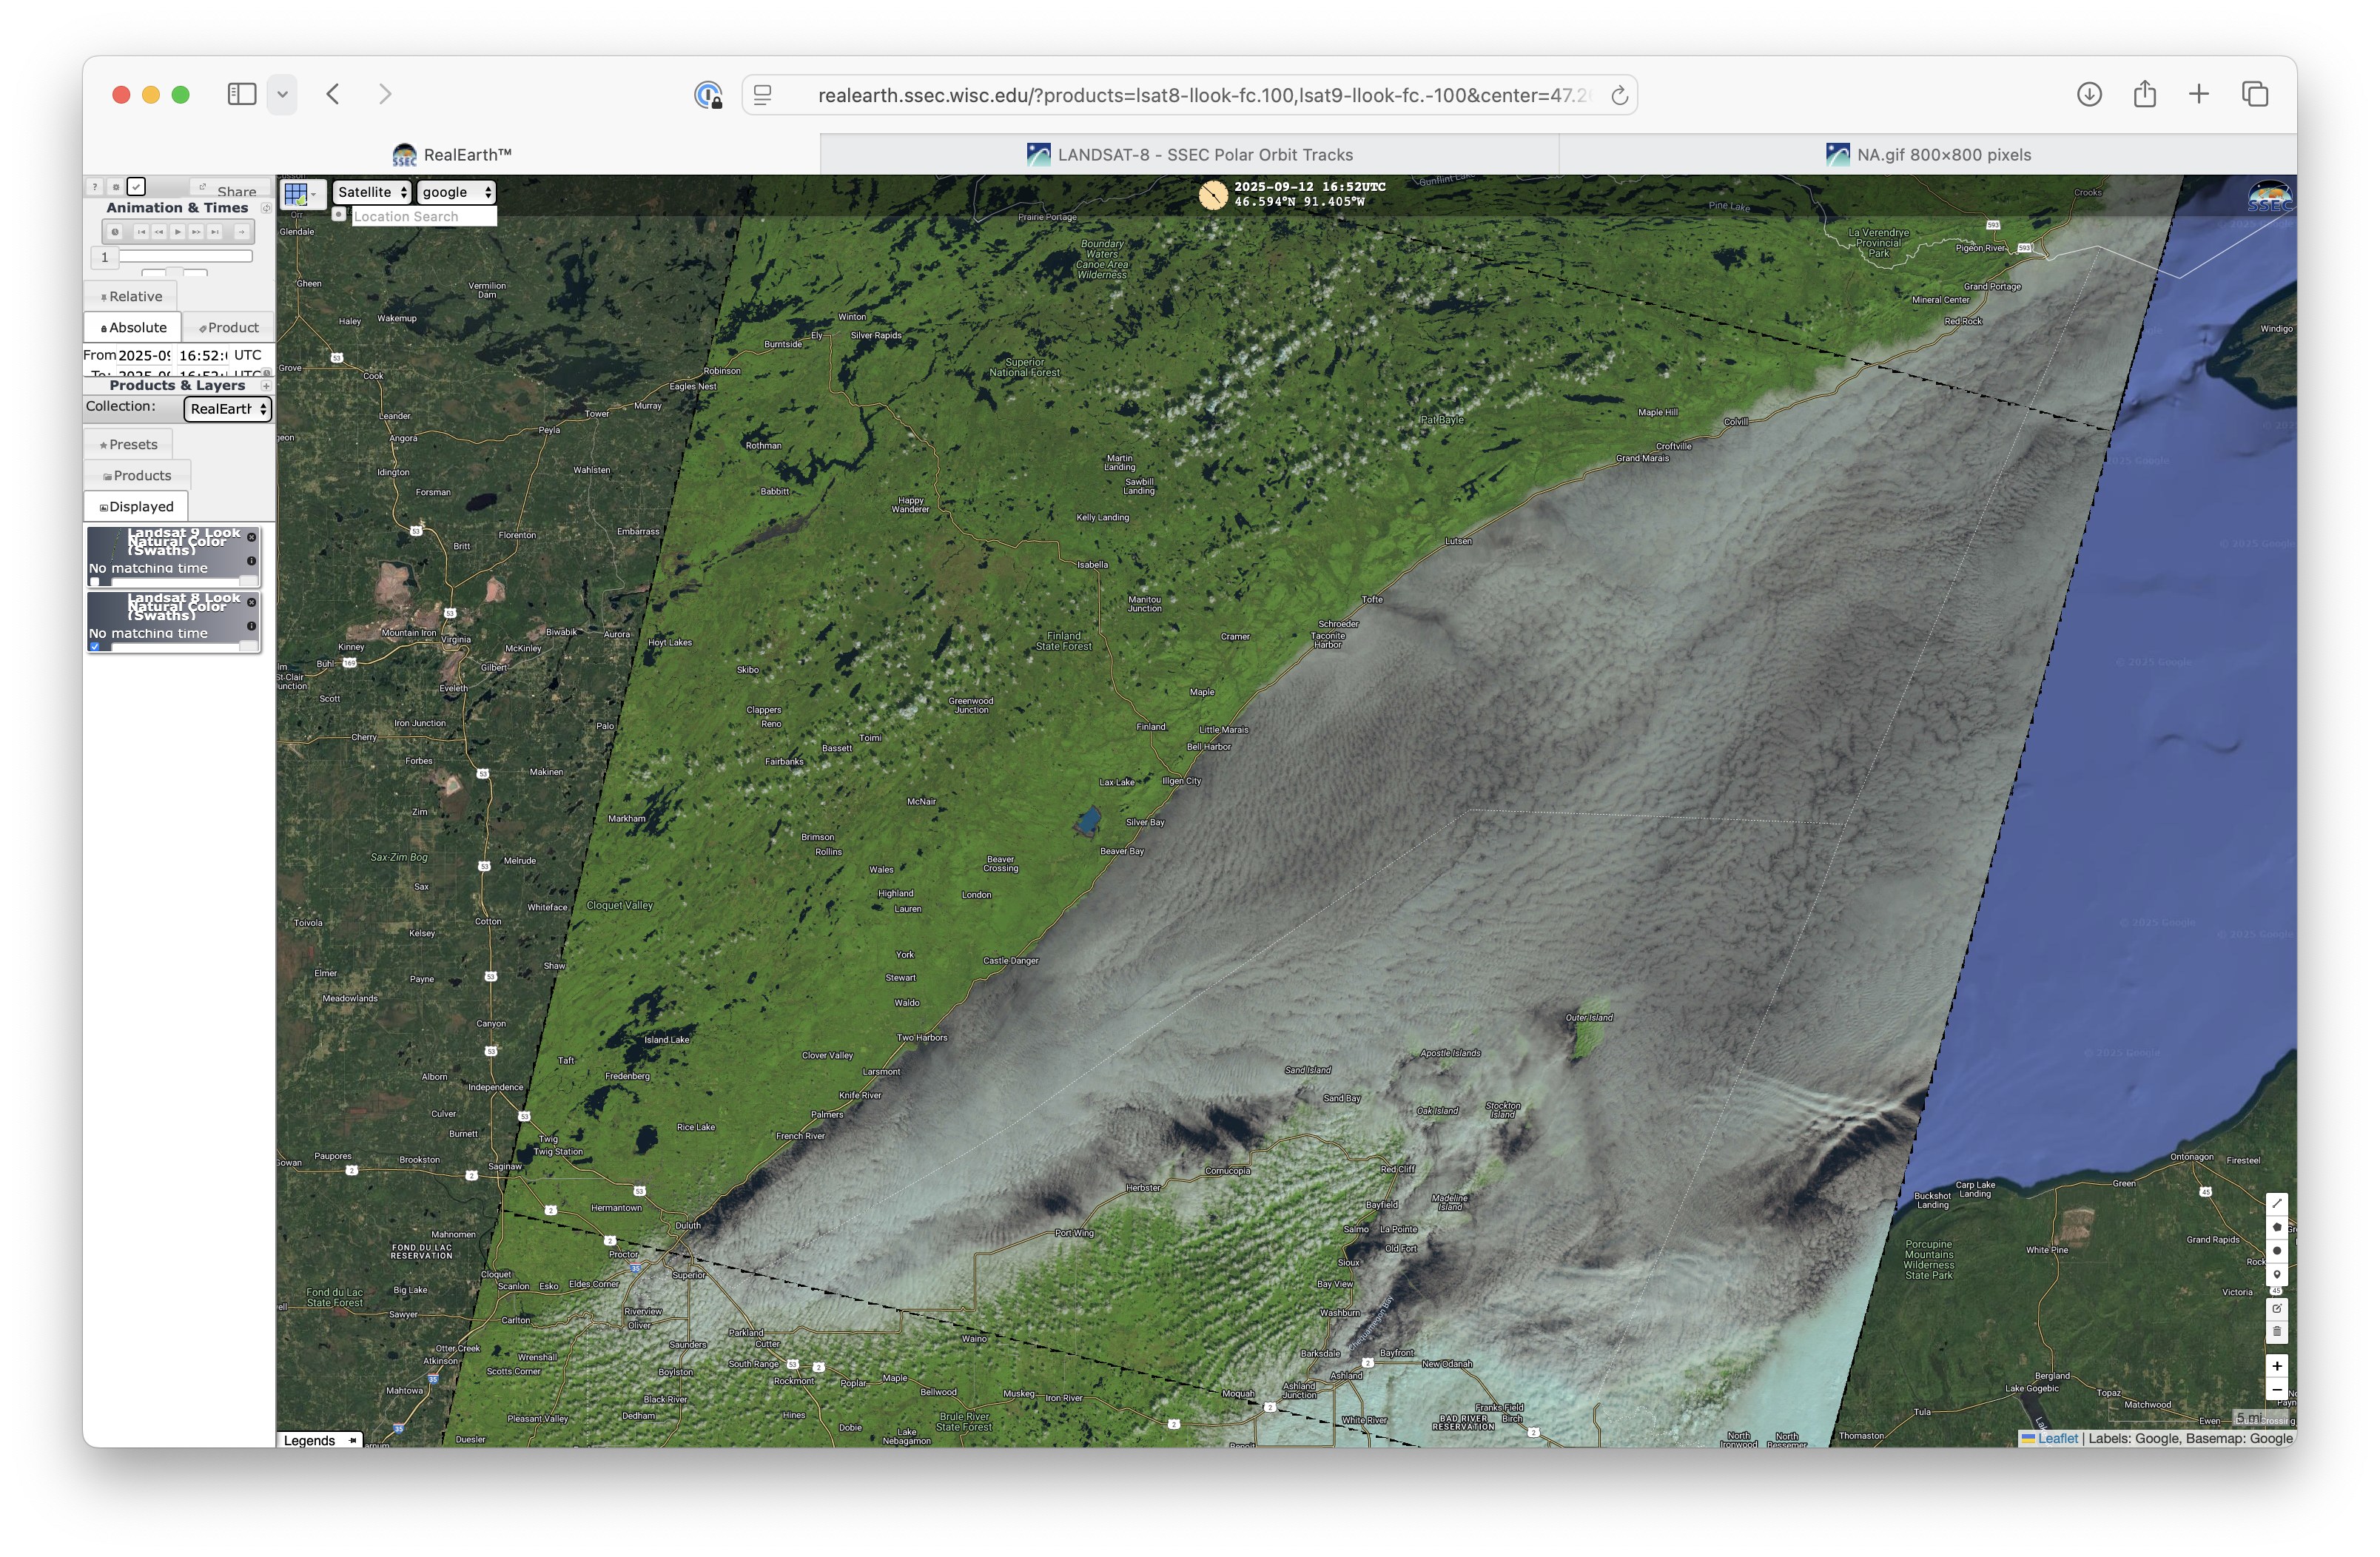
Landsat-8 “Natural Color” RGB image at 1652 UTC on 10 September [click to enlarge]
View only this post Read Less


