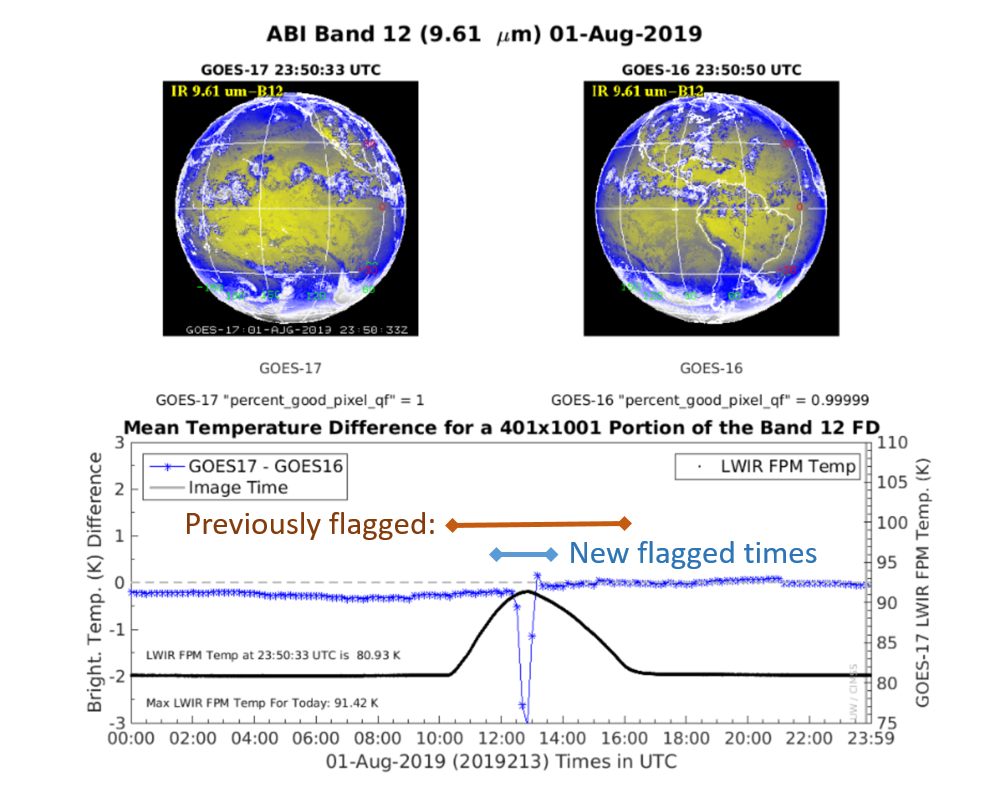
Top: Thumbnails of GOES-17 and GOES-16 ABI Band 12 (9.6 µm) on August 1, 2019. Bottom: Time series of GOES-17 minus GOES-16 brightness temperature for a region located between the two satellites. Also plotted is the GOES-17 Focal Plane Temperature. The reduced duration of the GOES-17 data to be flagged is highlighted. [click to enlarge]
- DQF:percent_good_pixel_qf = 1.f ;
- DQF:percent_conditionally_usable_pixel_qf = 0.f ;
- DQF:percent_out_of_range_pixel_qf = 0.f ;
- DQF:percent_no_value_pixel_qf = 0.f ;
- DQF:percent_focal_plane_temperature_threshold_exceeded_qf = 0.f
The last one, DQF:percent_focal_plane_temperature_threshold_exceeded_qf, reports what percentage of the images pixels are warmer than the threshold value. Note that the thresholds on both the increasing and decreasing temperatures are also reported in the meta-data.
Near realtime brightness temperature comparisons between GOES-16 and GOES-17, as well as historical comparisons for a region centered on the equator and half way between the two satellites.
From the NOAA Notification:
Product(s) or Data Impacted: GOES-17 ABI auxiliary field change
Date/Time of Initial Impact: August 8, 2019 1945 UTC
Details/Specifics of Change:
The GOES-17 ABI Temperature Data Quality Flags (TDQF) thresholds for the thermal bands have been updated to the values in the table below. This update will make utilizing the TDQF more effective for flagging saturated data caused by the GOES-17 ABI cooling system anomaly. There will be no impacts to distribution caused by this update.
![Table of updated Temperature Quality Data Flag thresholds [click to enlarge]](https://cimss.ssec.wisc.edu/satellite-blog/wp-content/uploads/sites/5/2019/08/190808_tqdf_table.png)
Table of updated Temperature Quality Data Flag thresholds [click to enlarge]
On October 2, 2019, at 17:04 UTC, updates for a number of the ABI GOES-17 DQF thresholds were implemented in the operational system. NOAA Notification: https://www.ospo.noaa.gov/data/messages/2019/MSG2751954.html
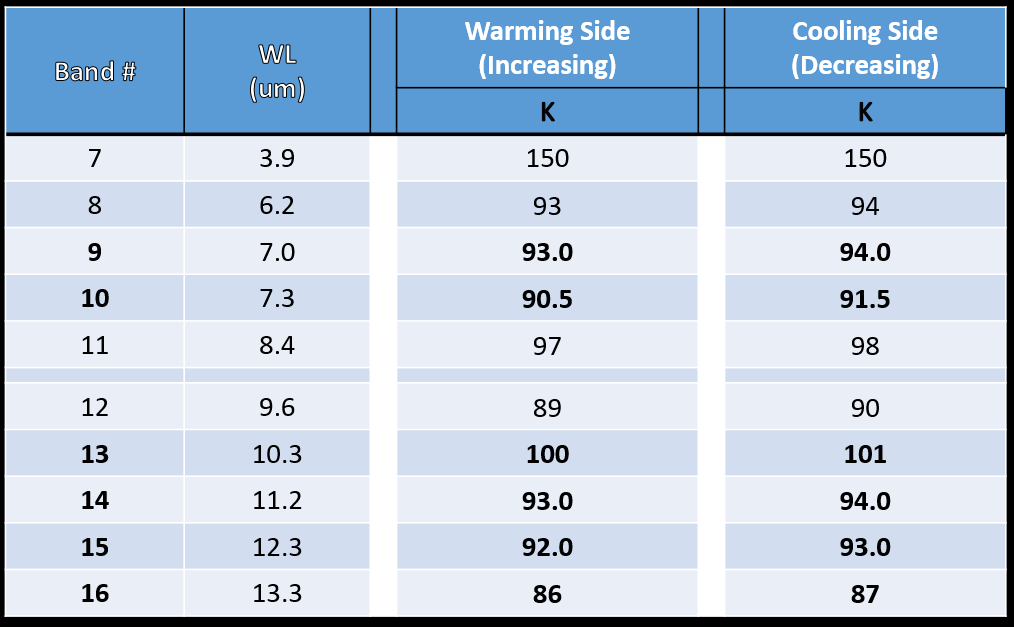
Table of updated Temperature Quality Data Flag thresholds [click to enlarge]. The bold numbers are those values that were updated on October 2nd.
View only this post Read Less
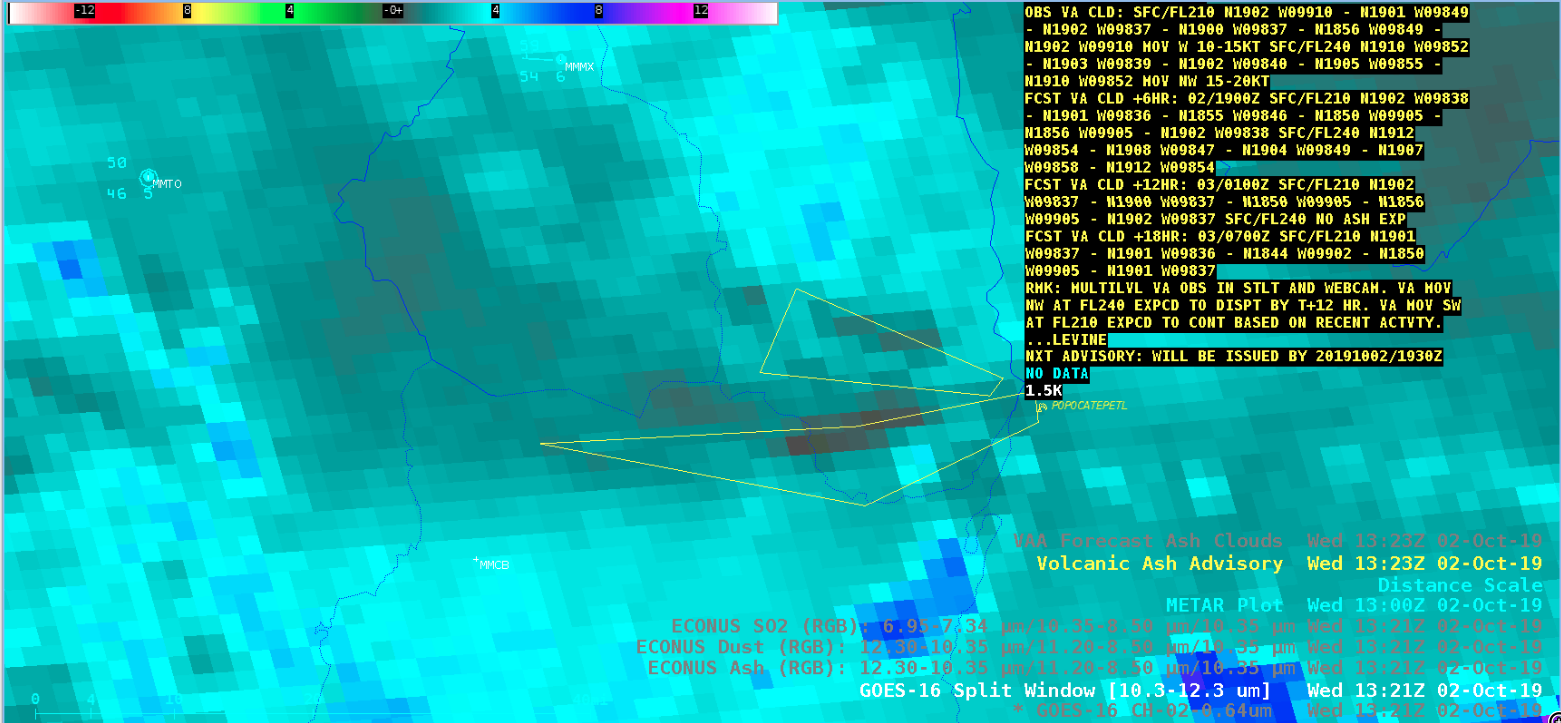

![GOES-16 Split Window image with the text of the 1323 UTC Volcanic Ash Advisory [click to enlarge]](https://cimss.ssec.wisc.edu/satellite-blog/wp-content/uploads/sites/5/2019/10/191002_1321utc_goes16_swd_vaa_popo.png)
![GOES-16 Volcanic Ash Height product [click to play animation | MP4]](https://cimss.ssec.wisc.edu/satellite-blog/wp-content/uploads/sites/5/2019/10/191002_goes16_ash_height_Popo_anim.gif)

![GOES-16 Day Cloud Phase Distinction RGB images [click to play animation | MP4]](https://cimss.ssec.wisc.edu/satellite-blog/wp-content/uploads/sites/5/2019/09/190930_goes16_dayCloudPhaseDistinctionRGB_MT_anim.gif)
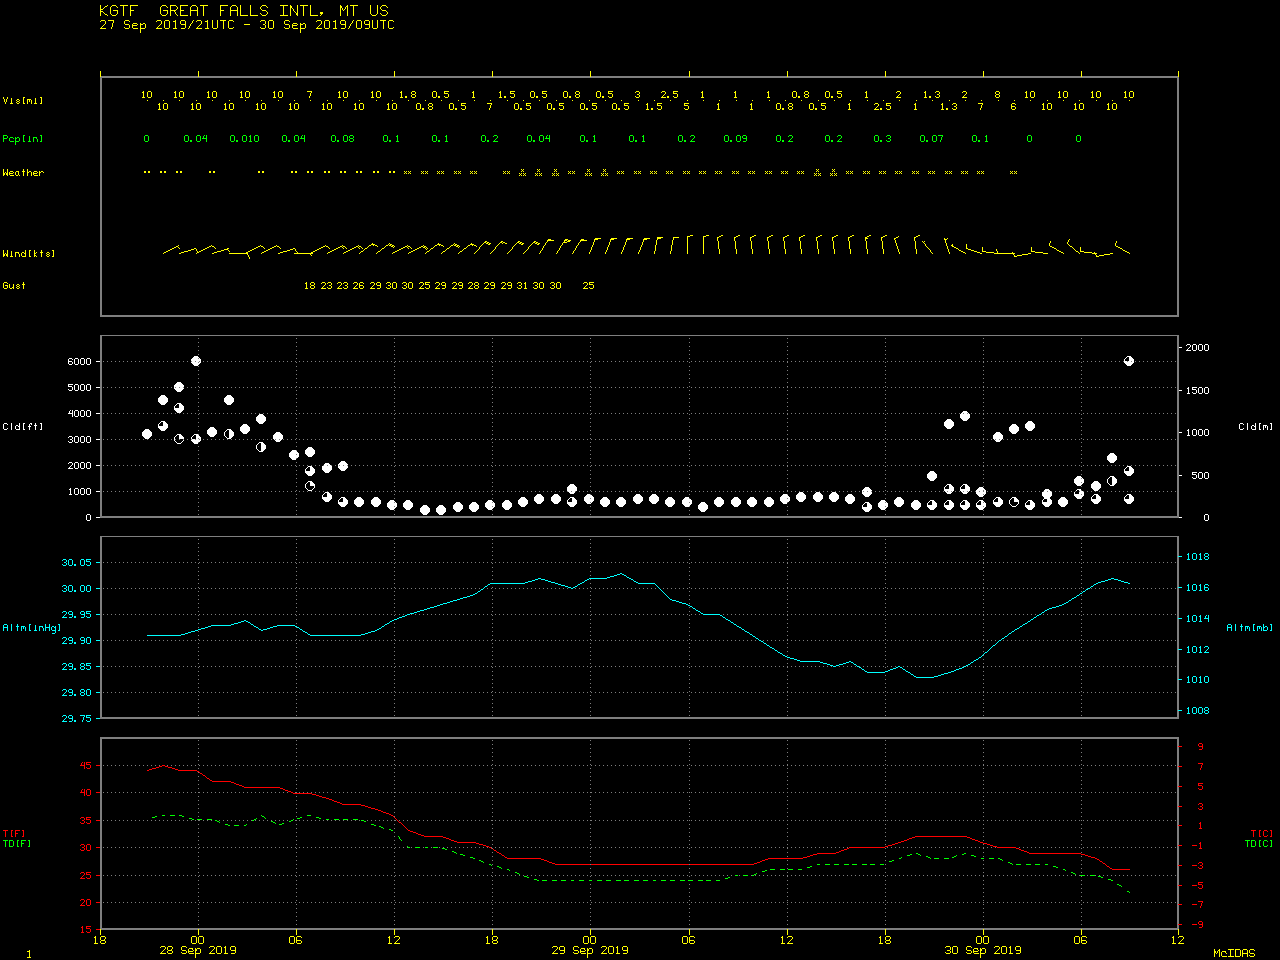
![GOES-16 Mid-level Water Vapor images, with hourly plots of precipitation type [click to play animation | MP4]](https://cimss.ssec.wisc.edu/satellite-blog/wp-content/uploads/sites/5/2019/09/190928_190930_goes16_waterVapor_precipitationType_Northern_Rockies_snowstorm_anim.gif)
![GOES-16 Day Cloud Phase Distinction and Day Snow-Fog RGB images [click to play animation | MP4]](https://cimss.ssec.wisc.edu/satellite-blog/wp-content/uploads/sites/5/2019/10/191001_goes16_dayCloudPhaseDistinctionRGB_daySnowFogRGB_MT_anim.gif)
![GOES-16 Day Cloud Phase Distinction RGB and Topography images [click to enlarge]](https://cimss.ssec.wisc.edu/satellite-blog/wp-content/uploads/sites/5/2019/10/191001_goes16_dayCloudPhaseDistinctionRGB_topography_MT_AB_anim.gif)
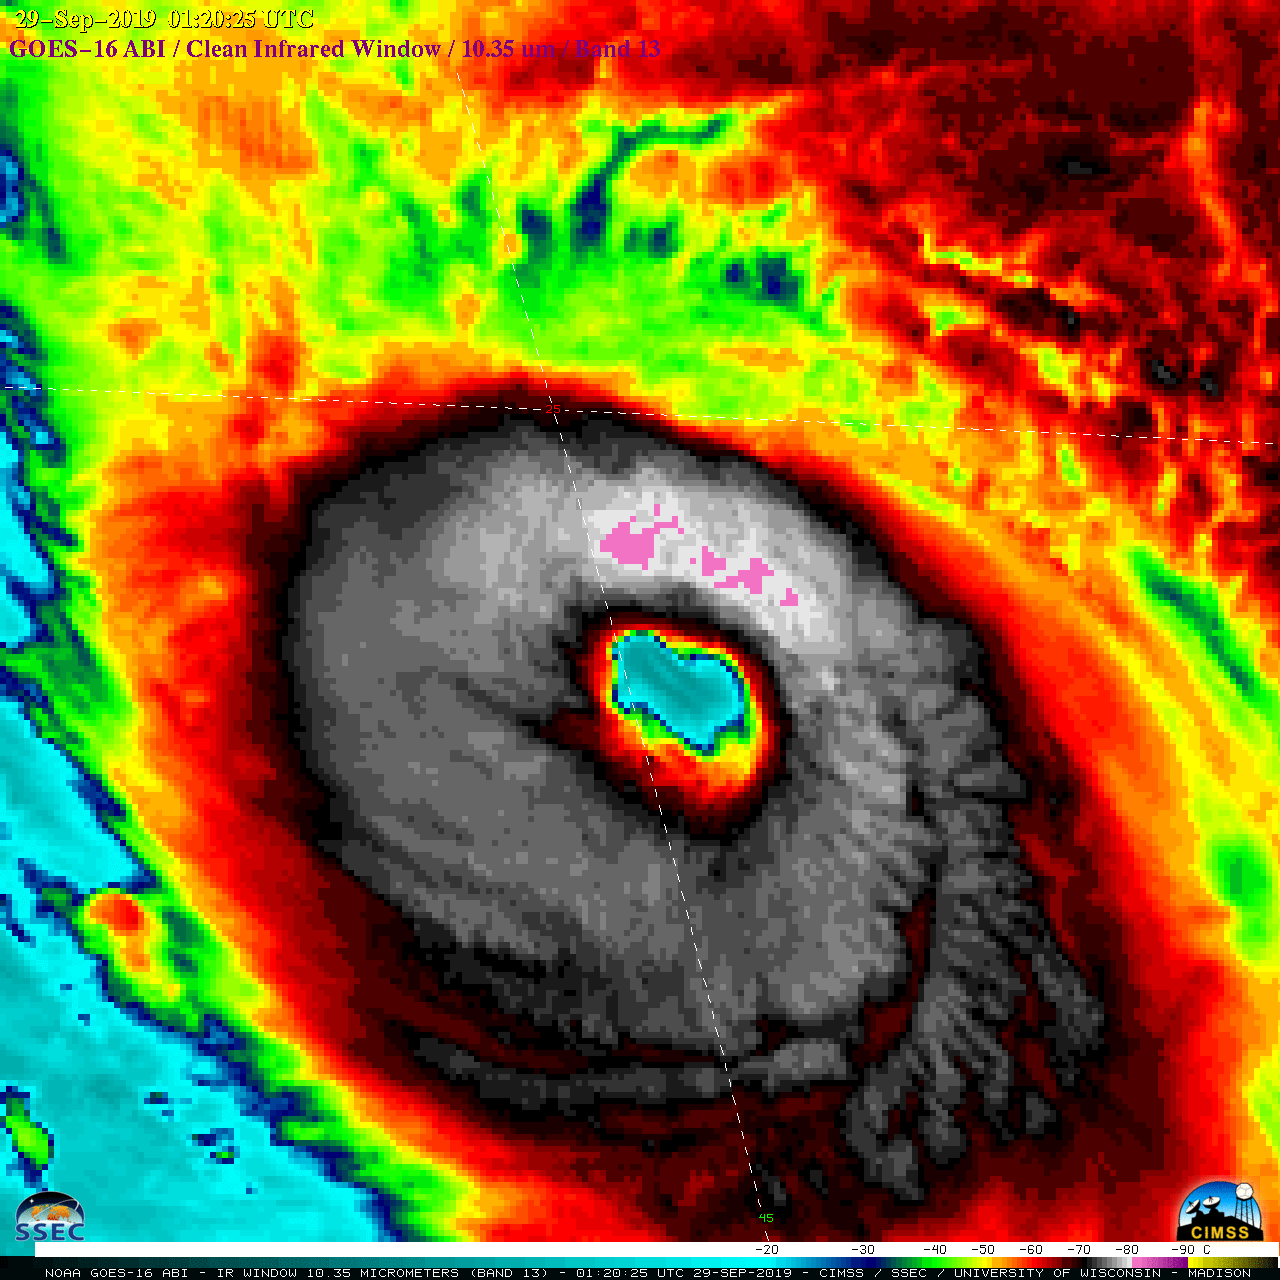
![GOES-16 "Clean" Infrared Window (10.35 µm) images [click to play animation | MP4]](https://cimss.ssec.wisc.edu/satellite-blog/wp-content/uploads/sites/5/2019/09/190928_goes16_infrared_Lorenzo_anim.gif)
![Plot of the CIMSS Advanced Dvorak Technique (ADT) for Hurricane Lorenzo [click to enlarge]](https://cimss.ssec.wisc.edu/satellite-blog/wp-content/uploads/sites/5/2019/09/190929_adt_Lorenzo.GIF)
![GOES-16 Water Vapor images, with contours and streamlines of deep-layer wind shear [click to play animation]](https://cimss.ssec.wisc.edu/satellite-blog/wp-content/uploads/sites/5/2019/09/190927_190929_goes16_waterVapor_deepLayerShear_anim.gif)
![Sea Surface Temperature and Ocean Heat Content on 29 September, with a plot of the track/intensity of Lorenzo [click to enlarge]](https://cimss.ssec.wisc.edu/satellite-blog/wp-content/uploads/sites/5/2019/09/190929_seaSurfaceTemperature_oceanHeatContent_Lorenzo_anim.gif)
