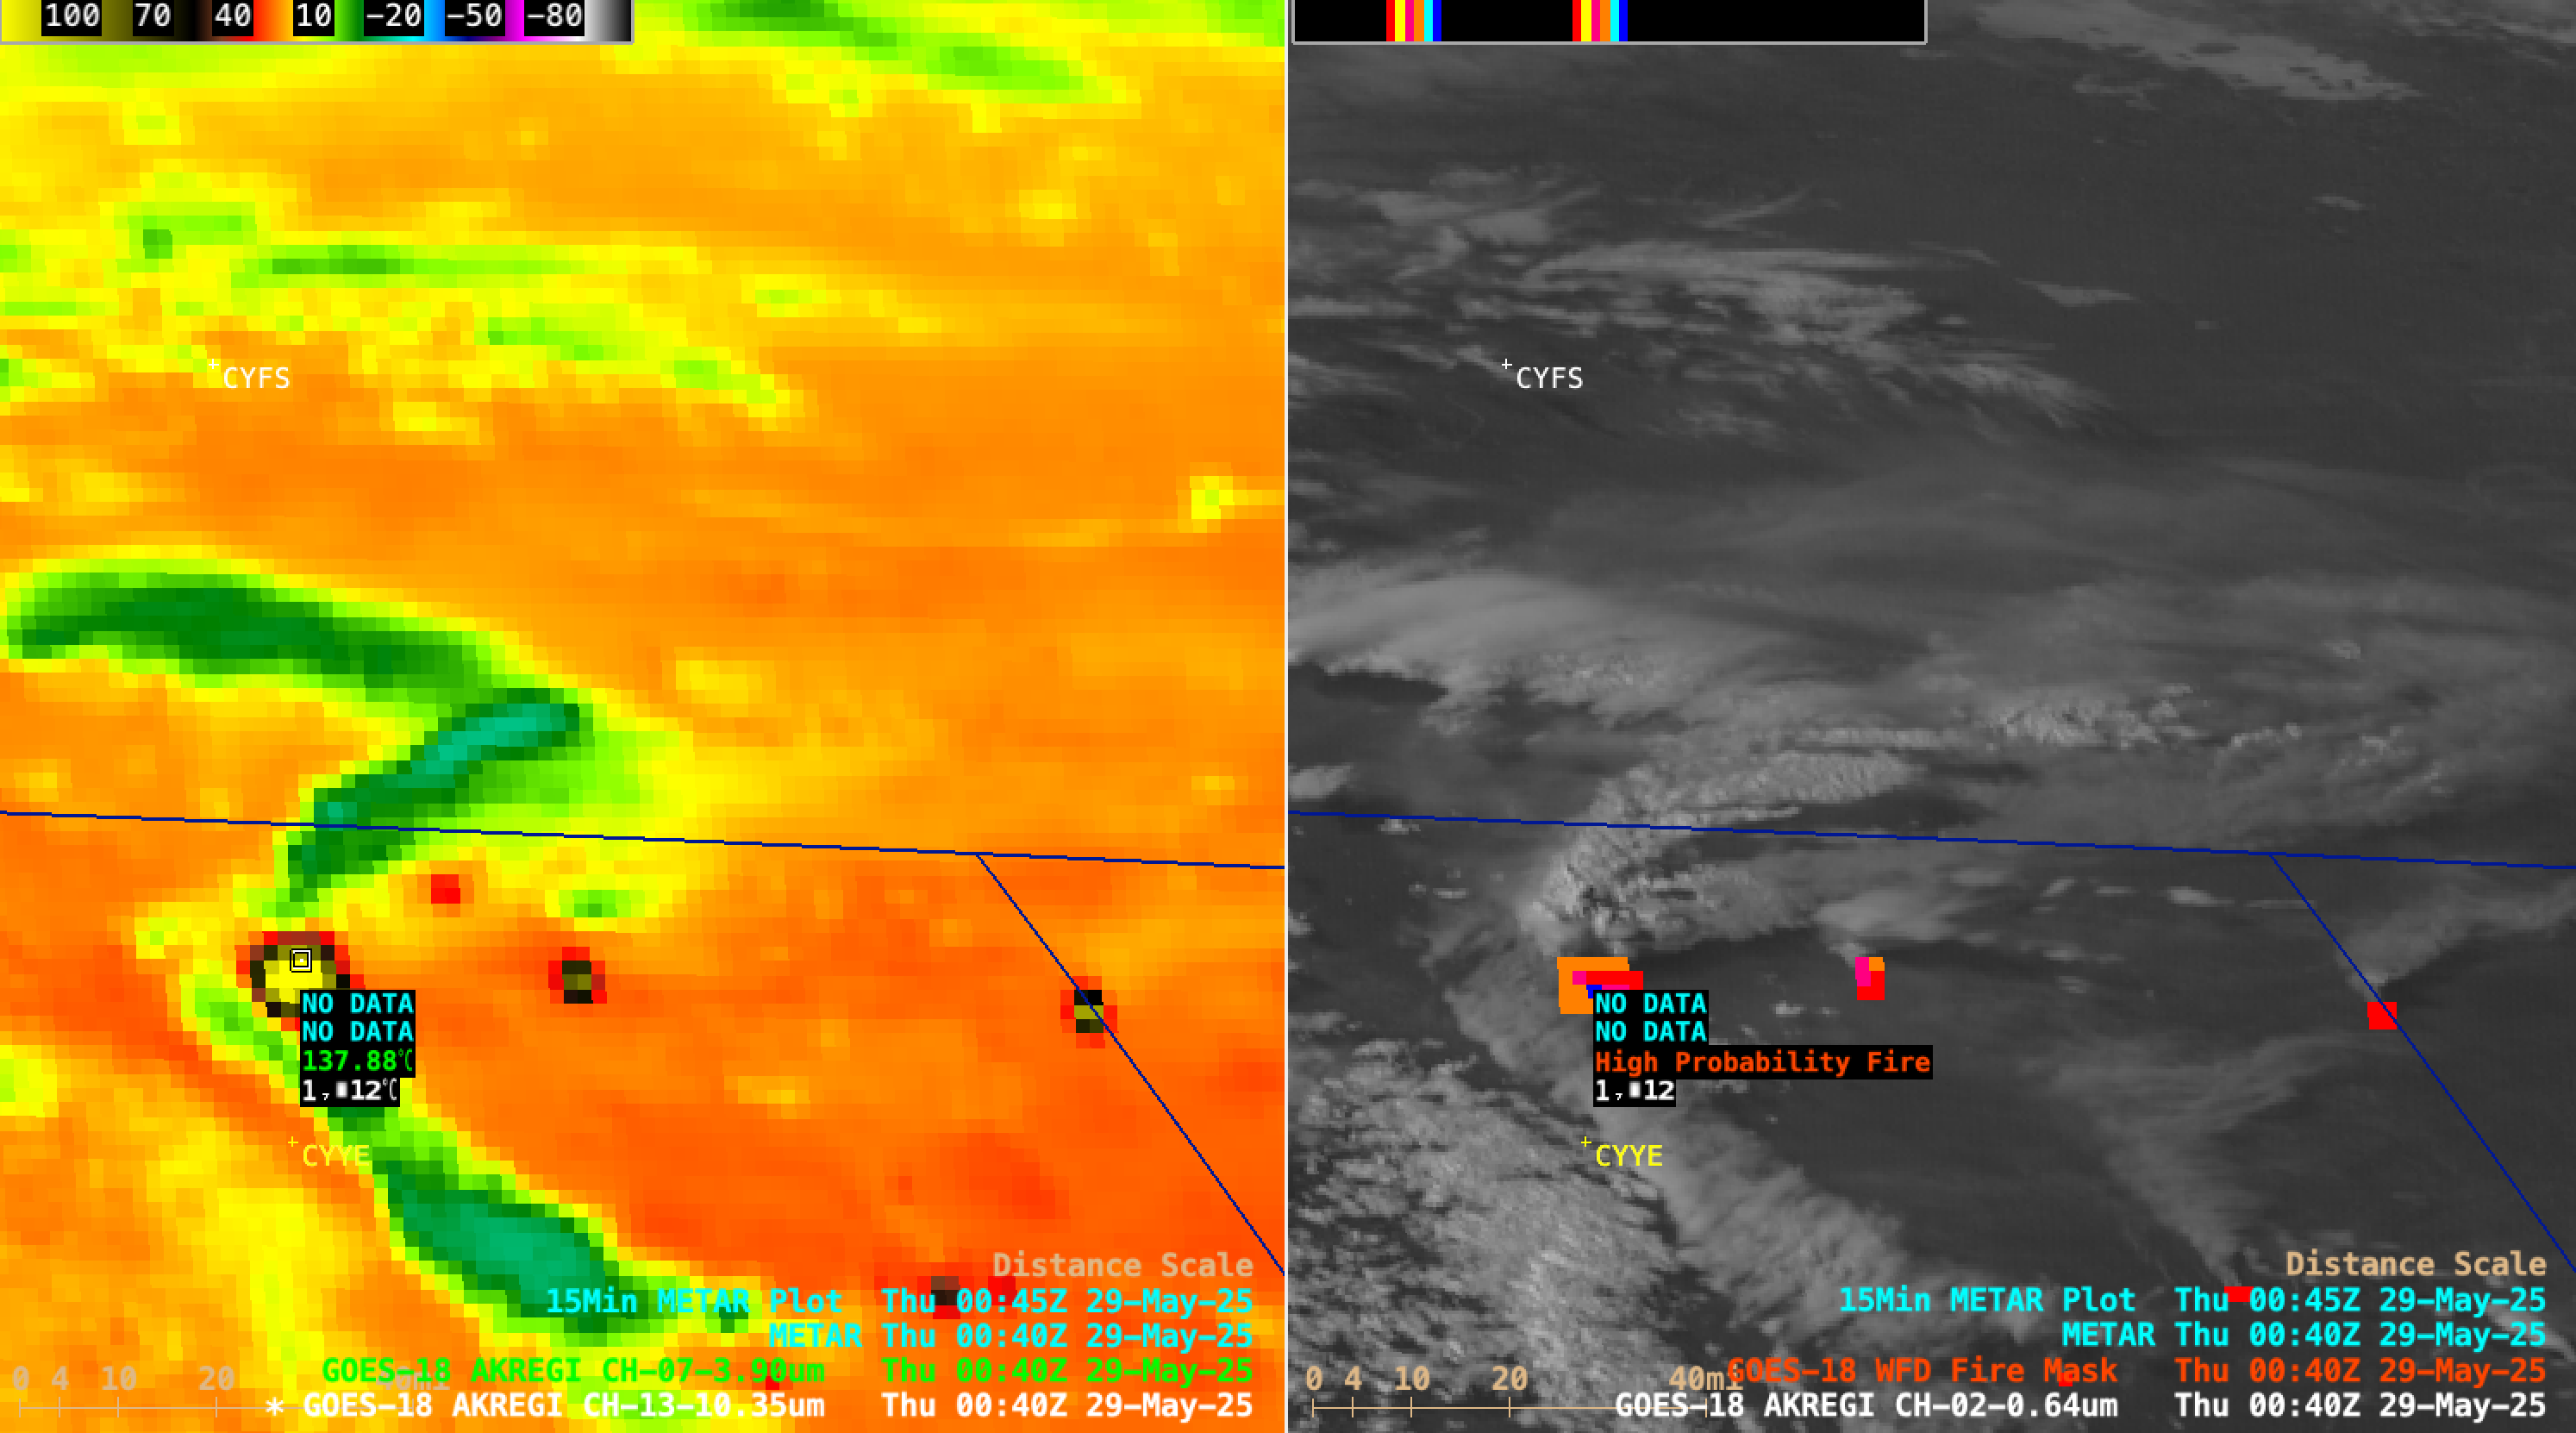
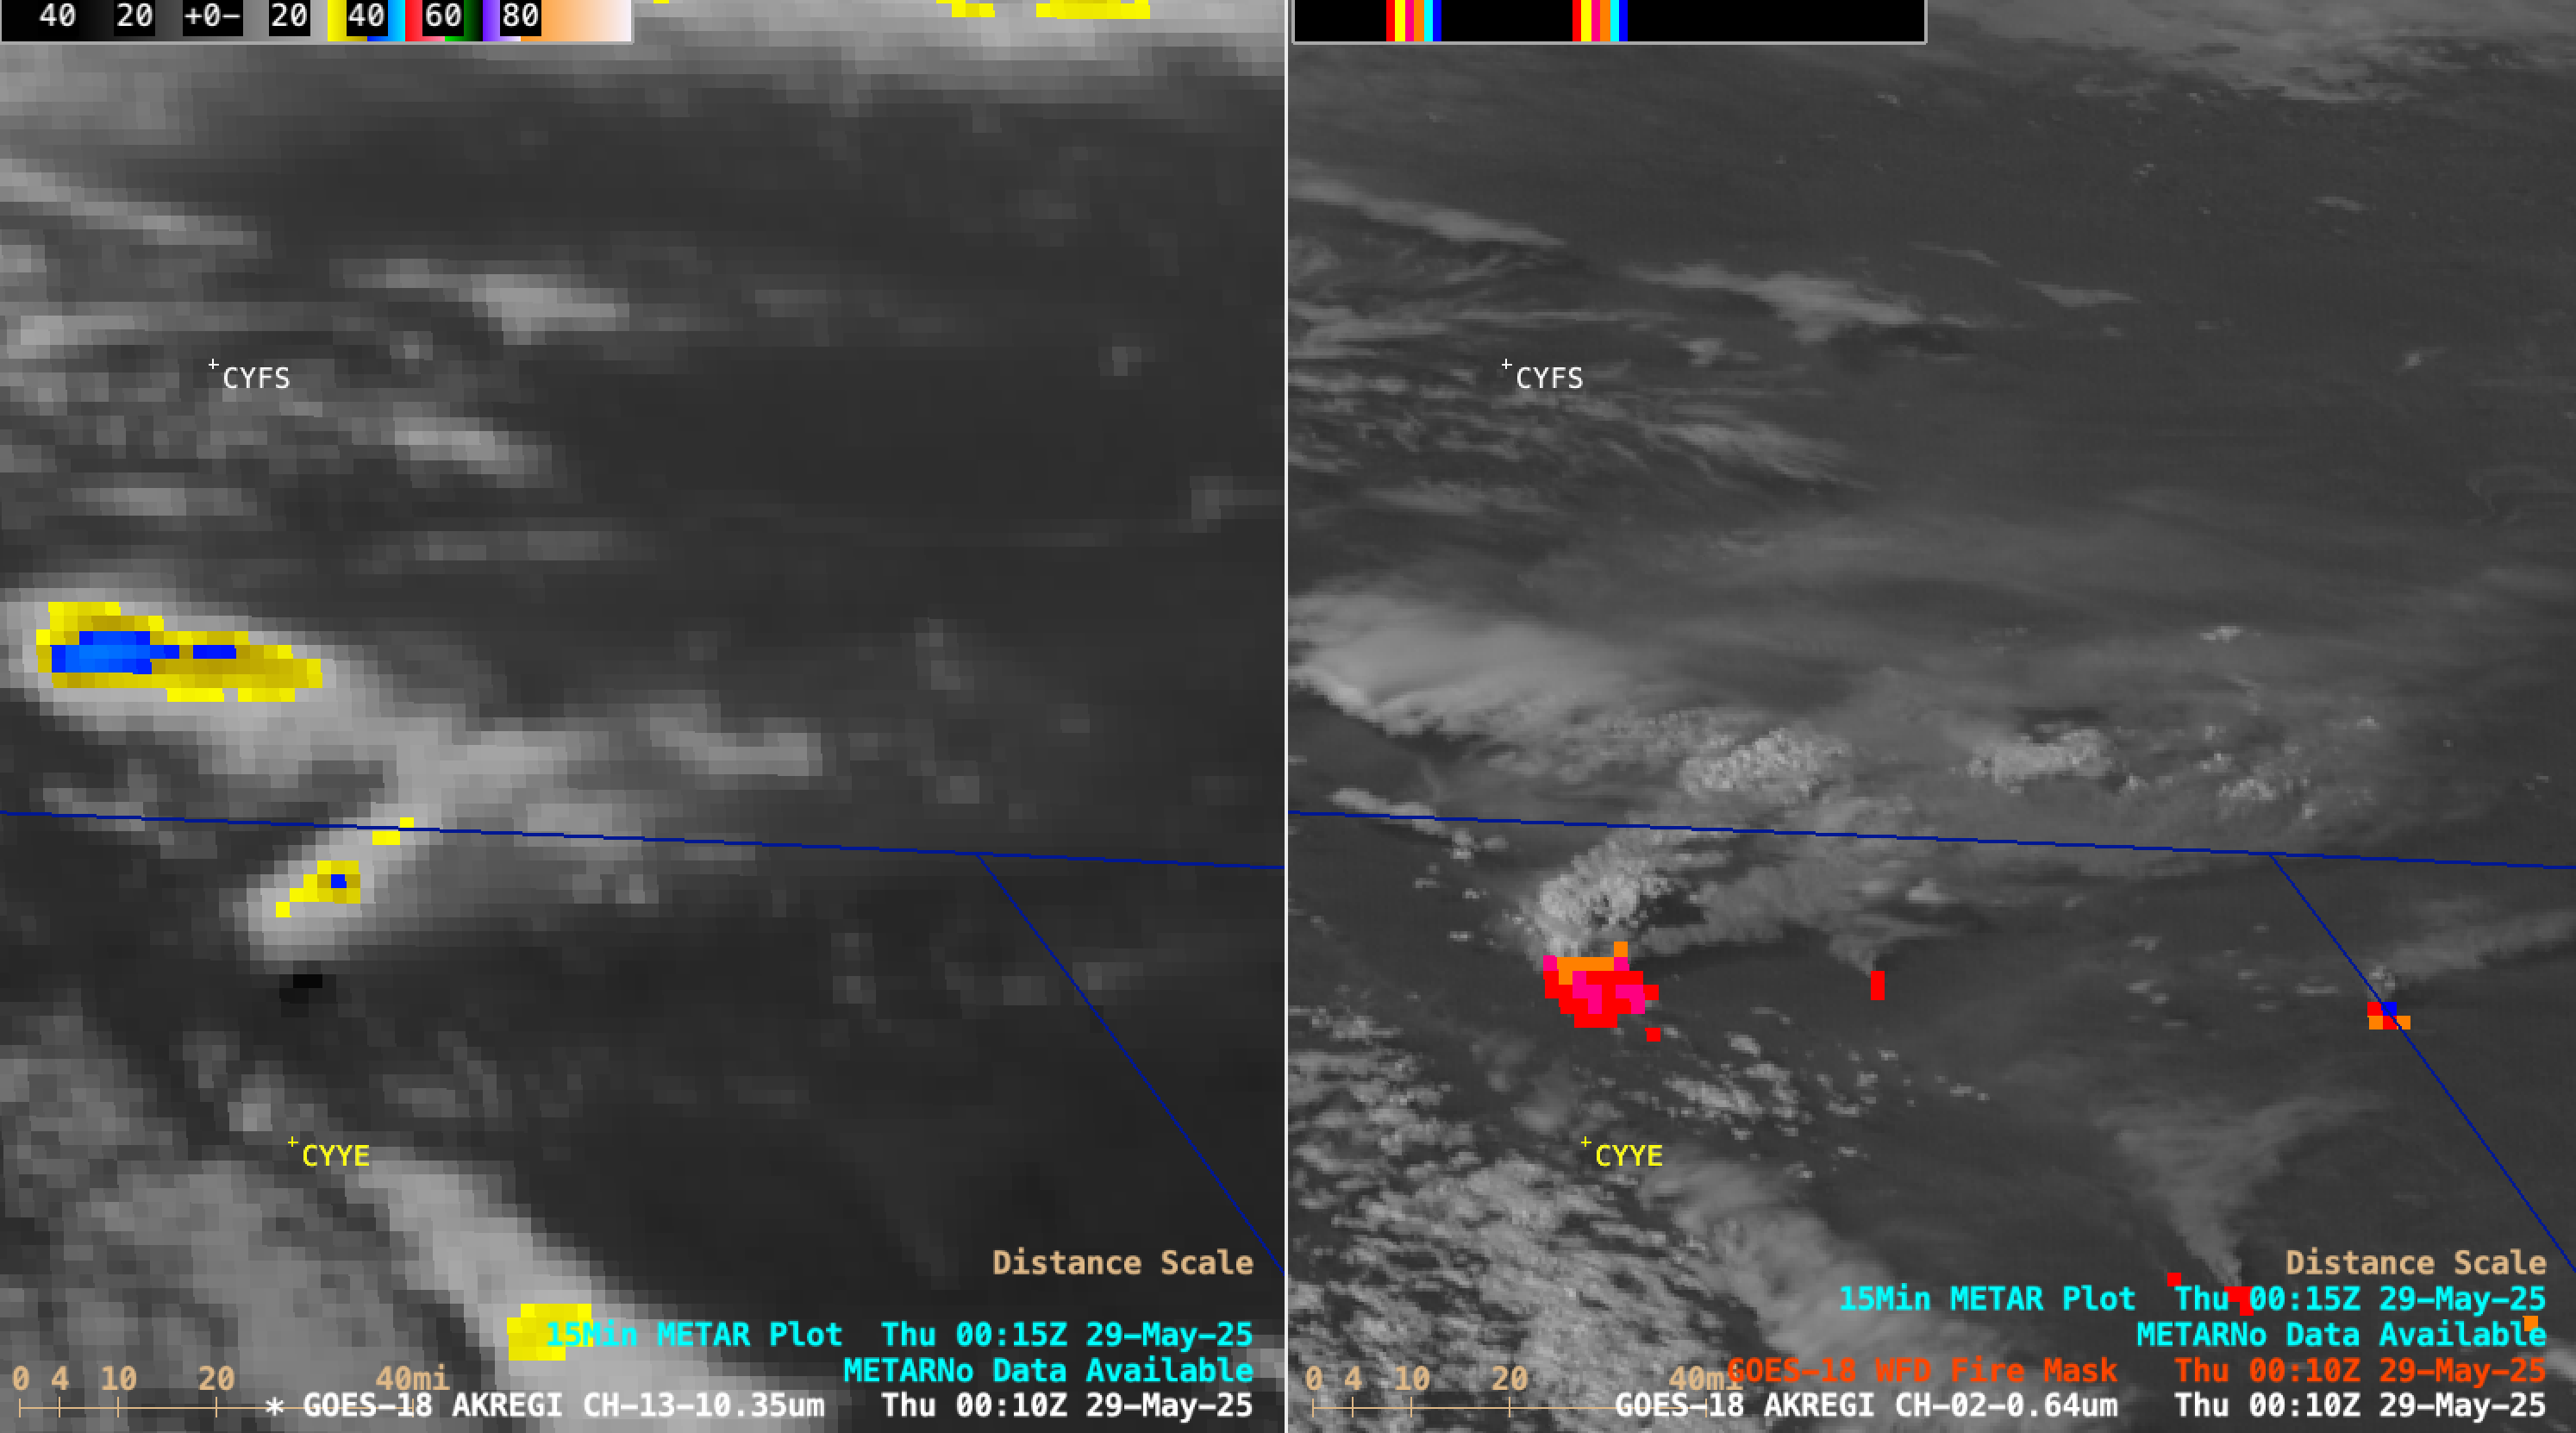
10-minute Full Disk scan GOES-18 (GOES-West) “Clean” Infrared Window (10.3 µm) images and “Red” Visible (0.64 µm) images with an overlay of the FDCA Fire Mask derived product (above) showed that a large wildfire south of La Ronge (station identifier CYVC) in central Saskatchewan produced a pyrocumulonimbus (pyroCb) cloud during... Read More

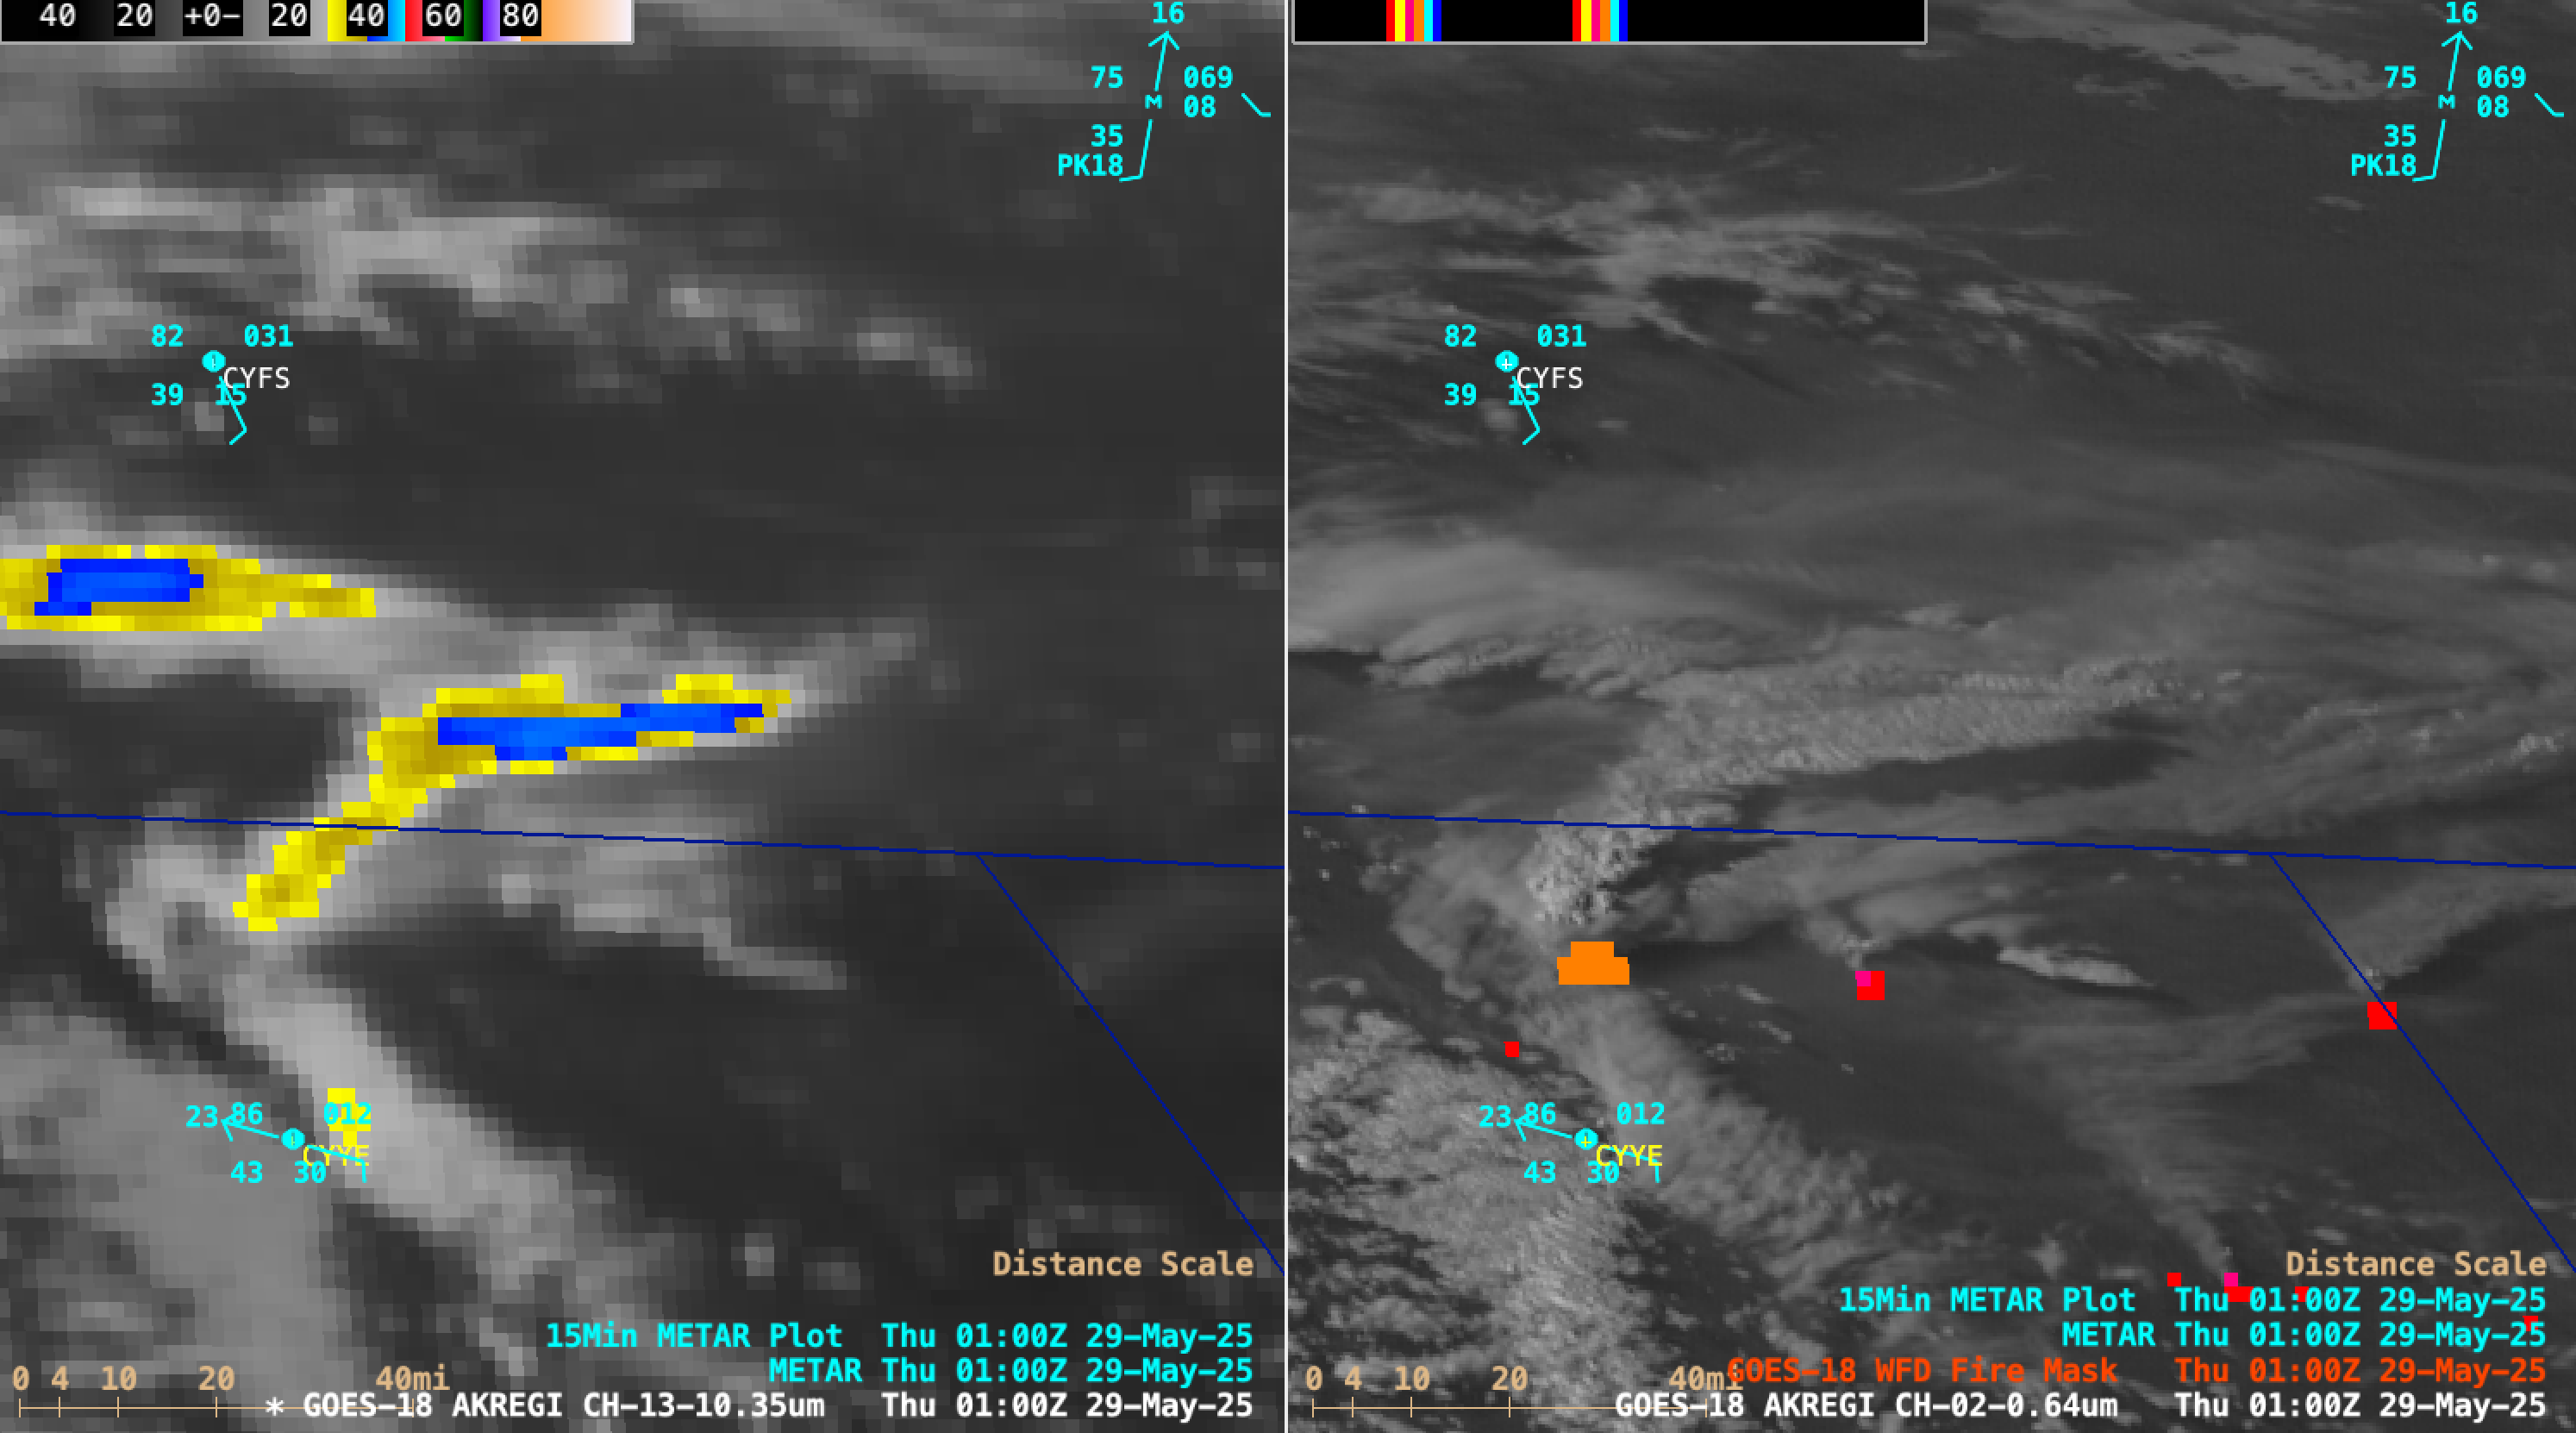
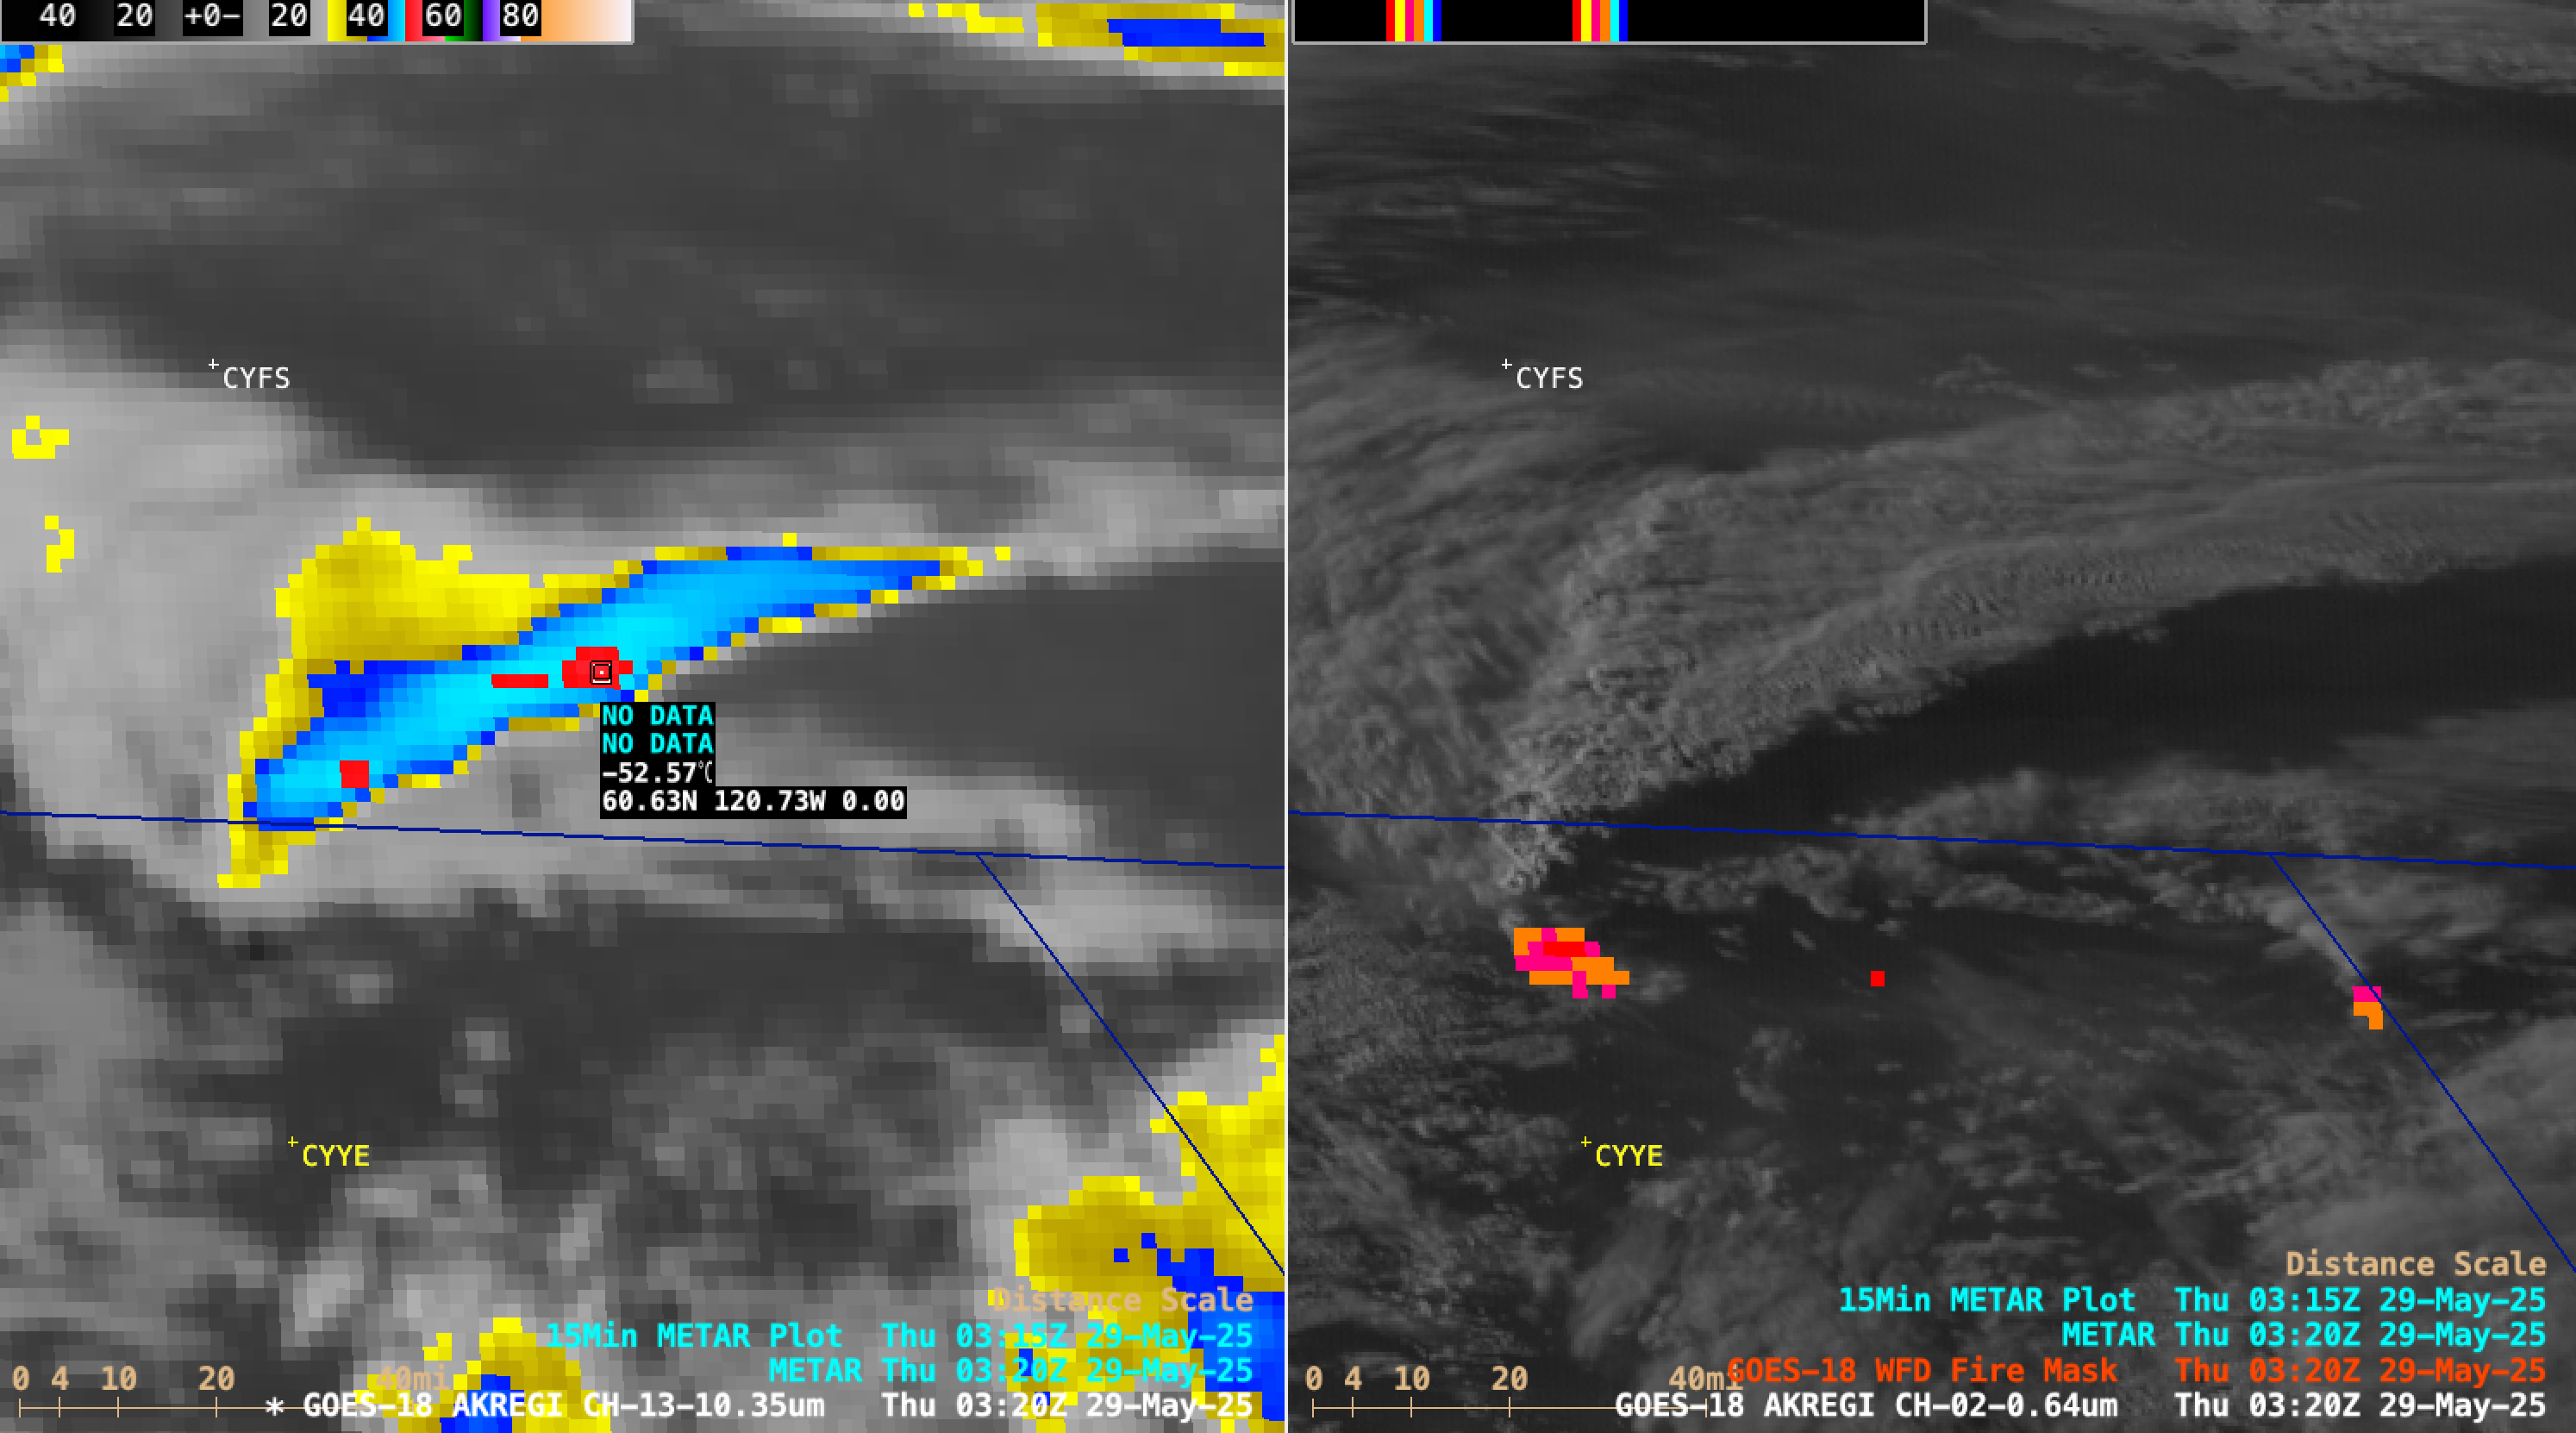
10-minute GOES-18 Clean Infrared Window (10.3 µm, left) images and Red Visible (0.64 µm) images + Fire Mask derived product (right), from 1700 UTC on 02 June to 0300 UTC on 03 June [click to play MP4 animation]
10-minute Full Disk scan GOES-18
(GOES-West) “Clean” Infrared Window (10.3 µm) images and “Red” Visible (0.64 µm) images with an overlay of the
FDCA Fire Mask derived product
(above) showed that a large wildfire south of La Ronge (station identifier CYVC) in central Saskatchewan produced a
pyrocumulonimbus (pyroCb) cloud during the afternoon hours on
02 June 2025. The pyroCb-producing fire was located along the western edge of a cluster of wildfires straddling the Saskatchewan/Manitoba border.
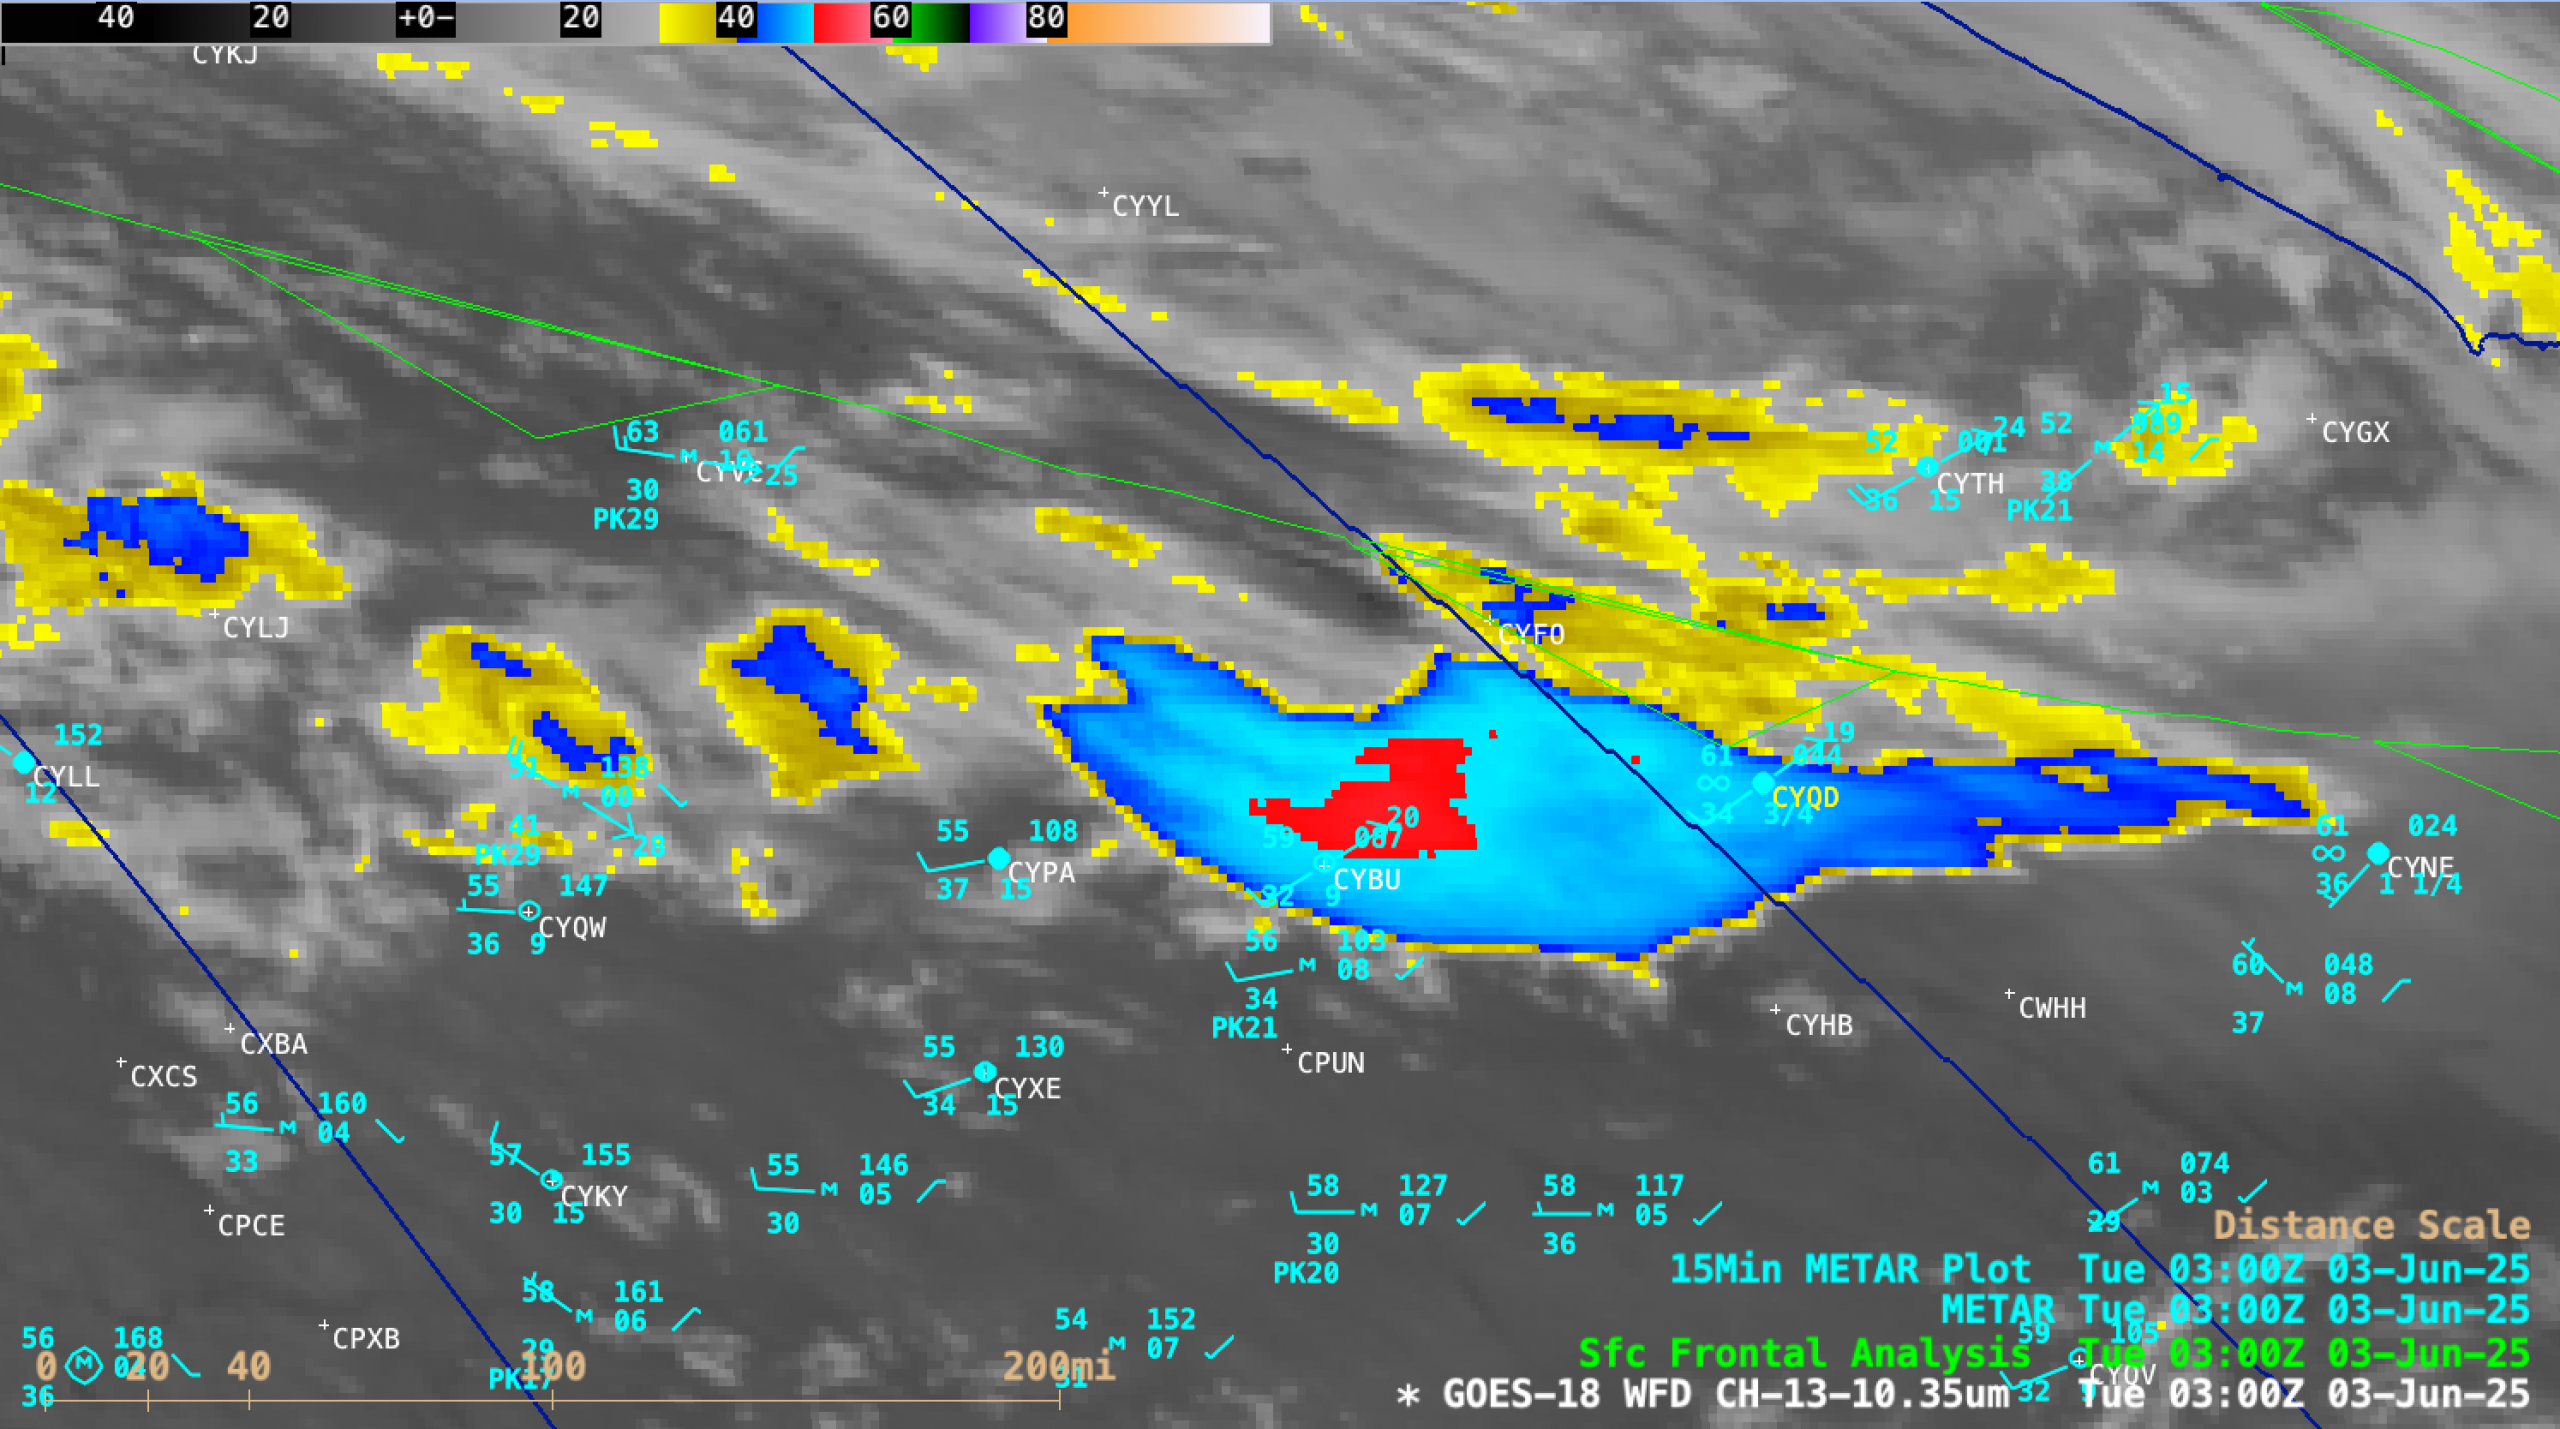
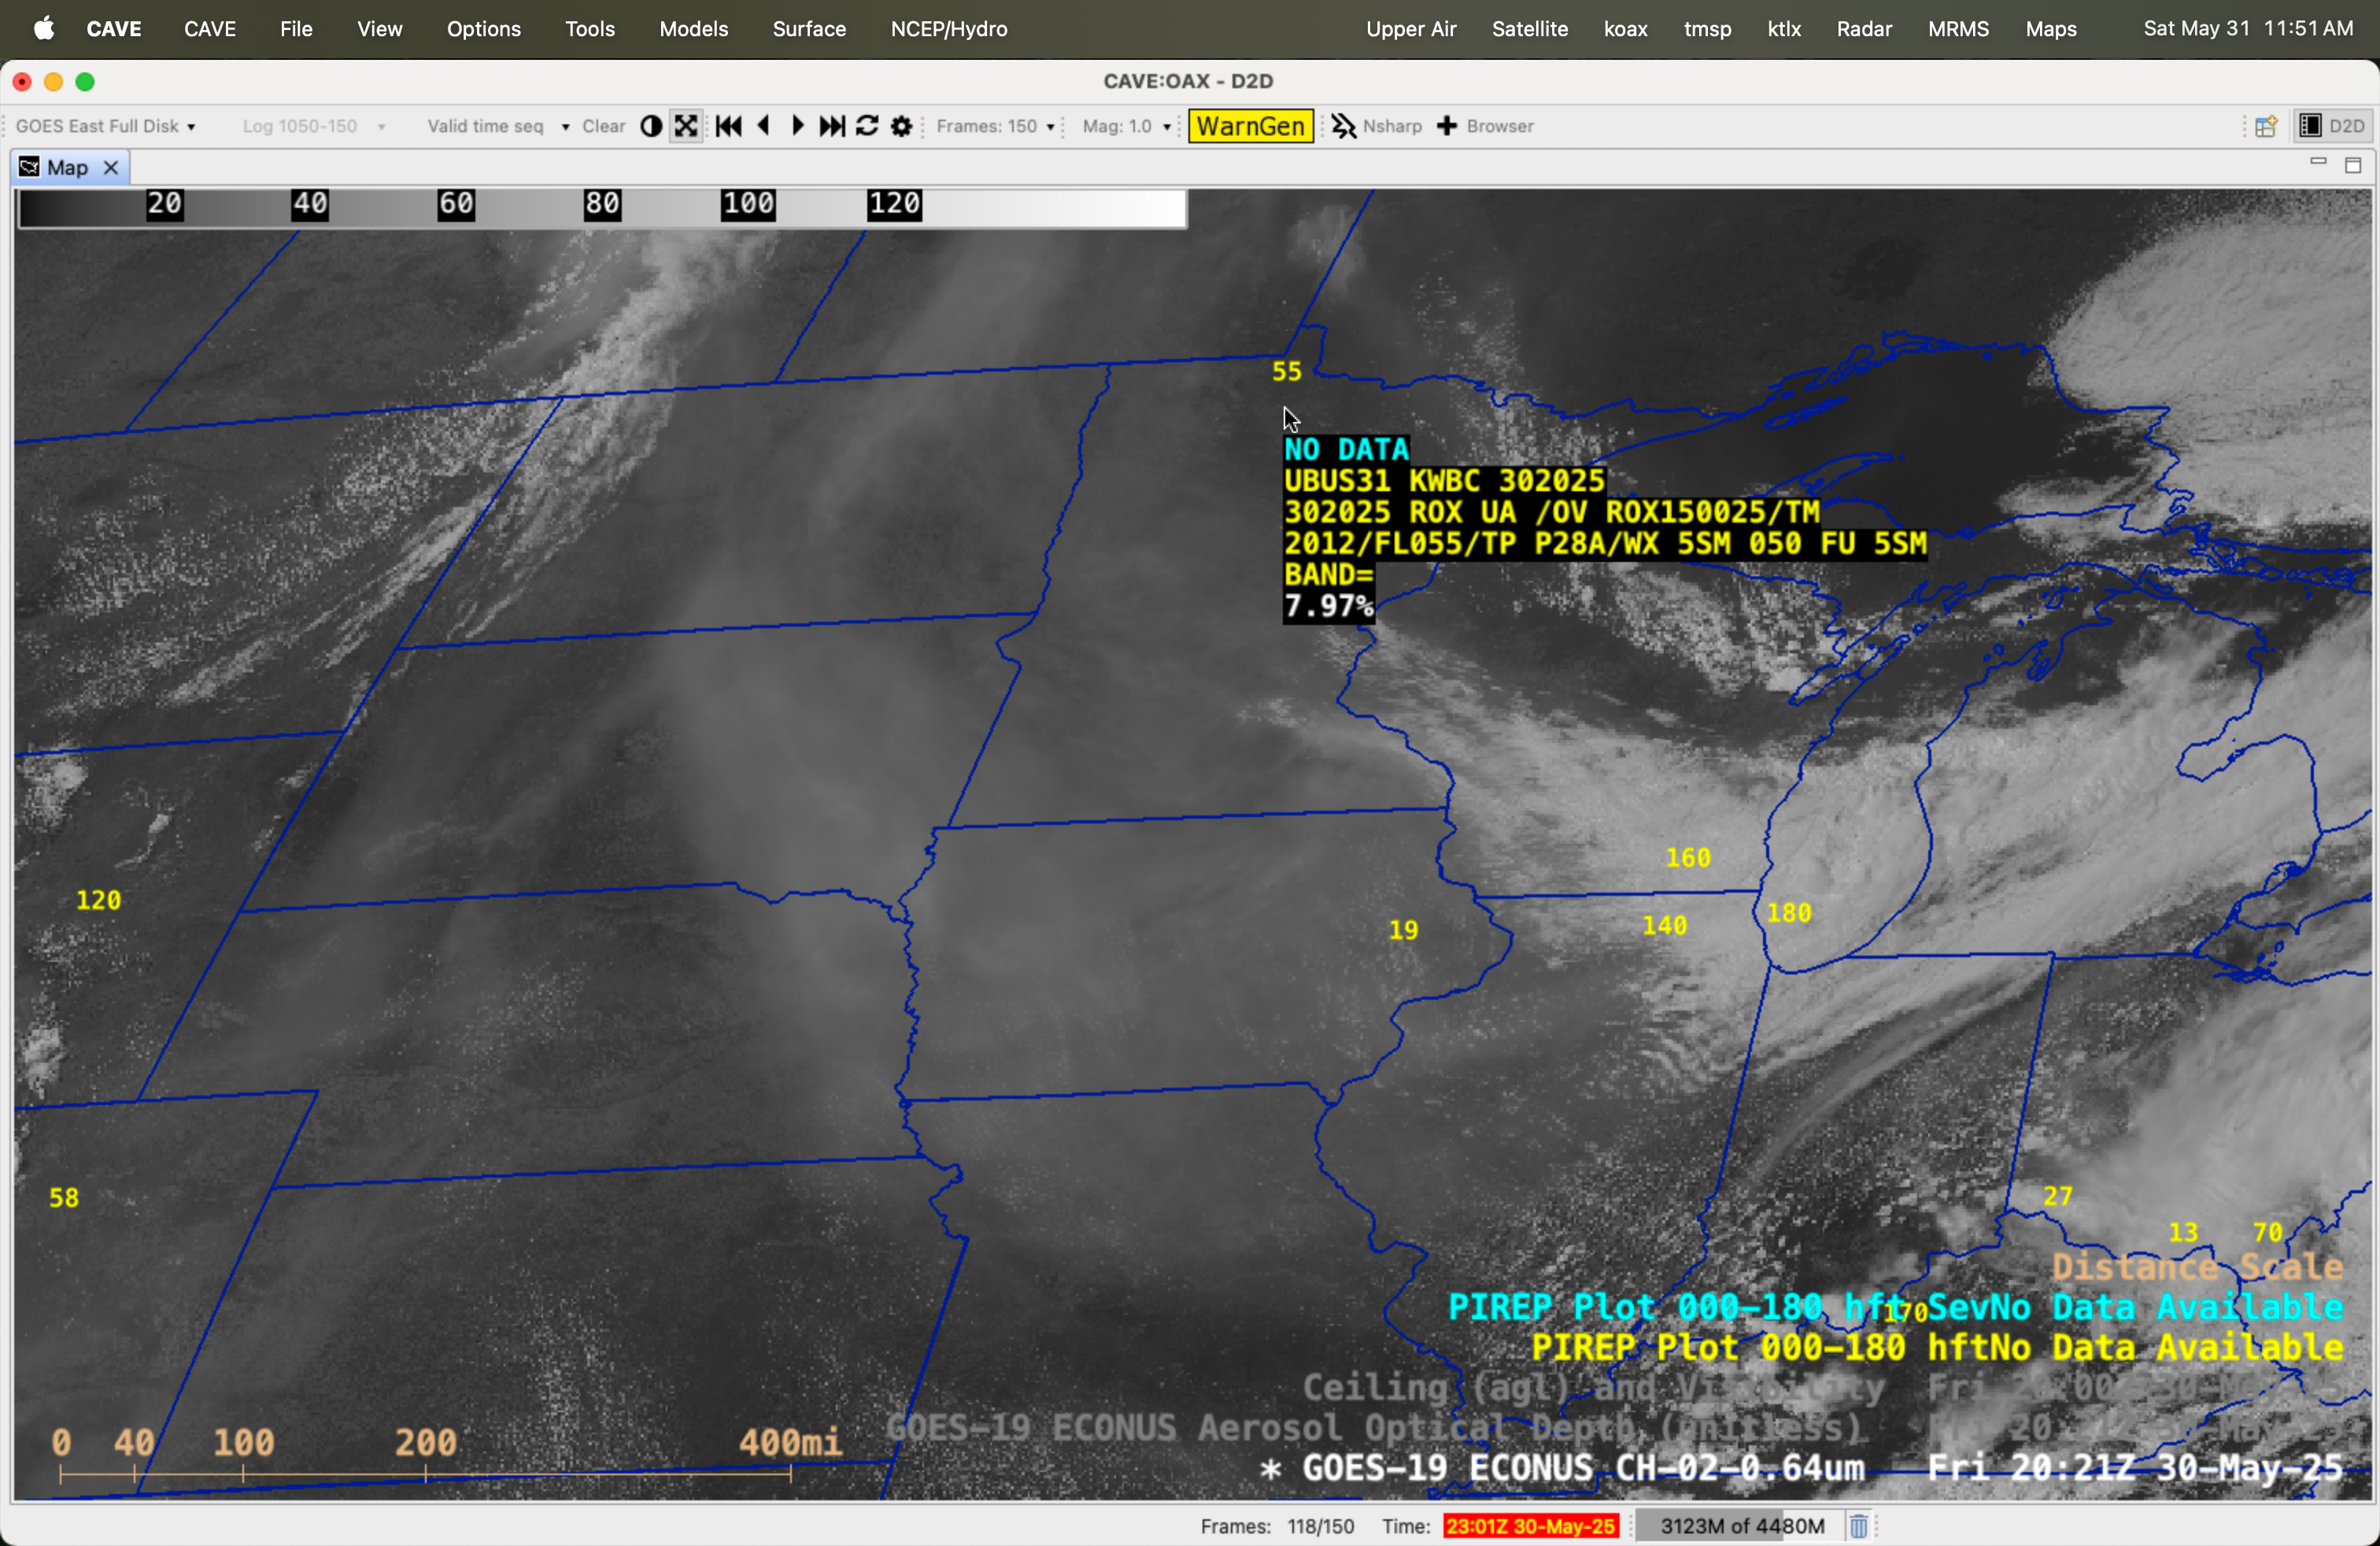
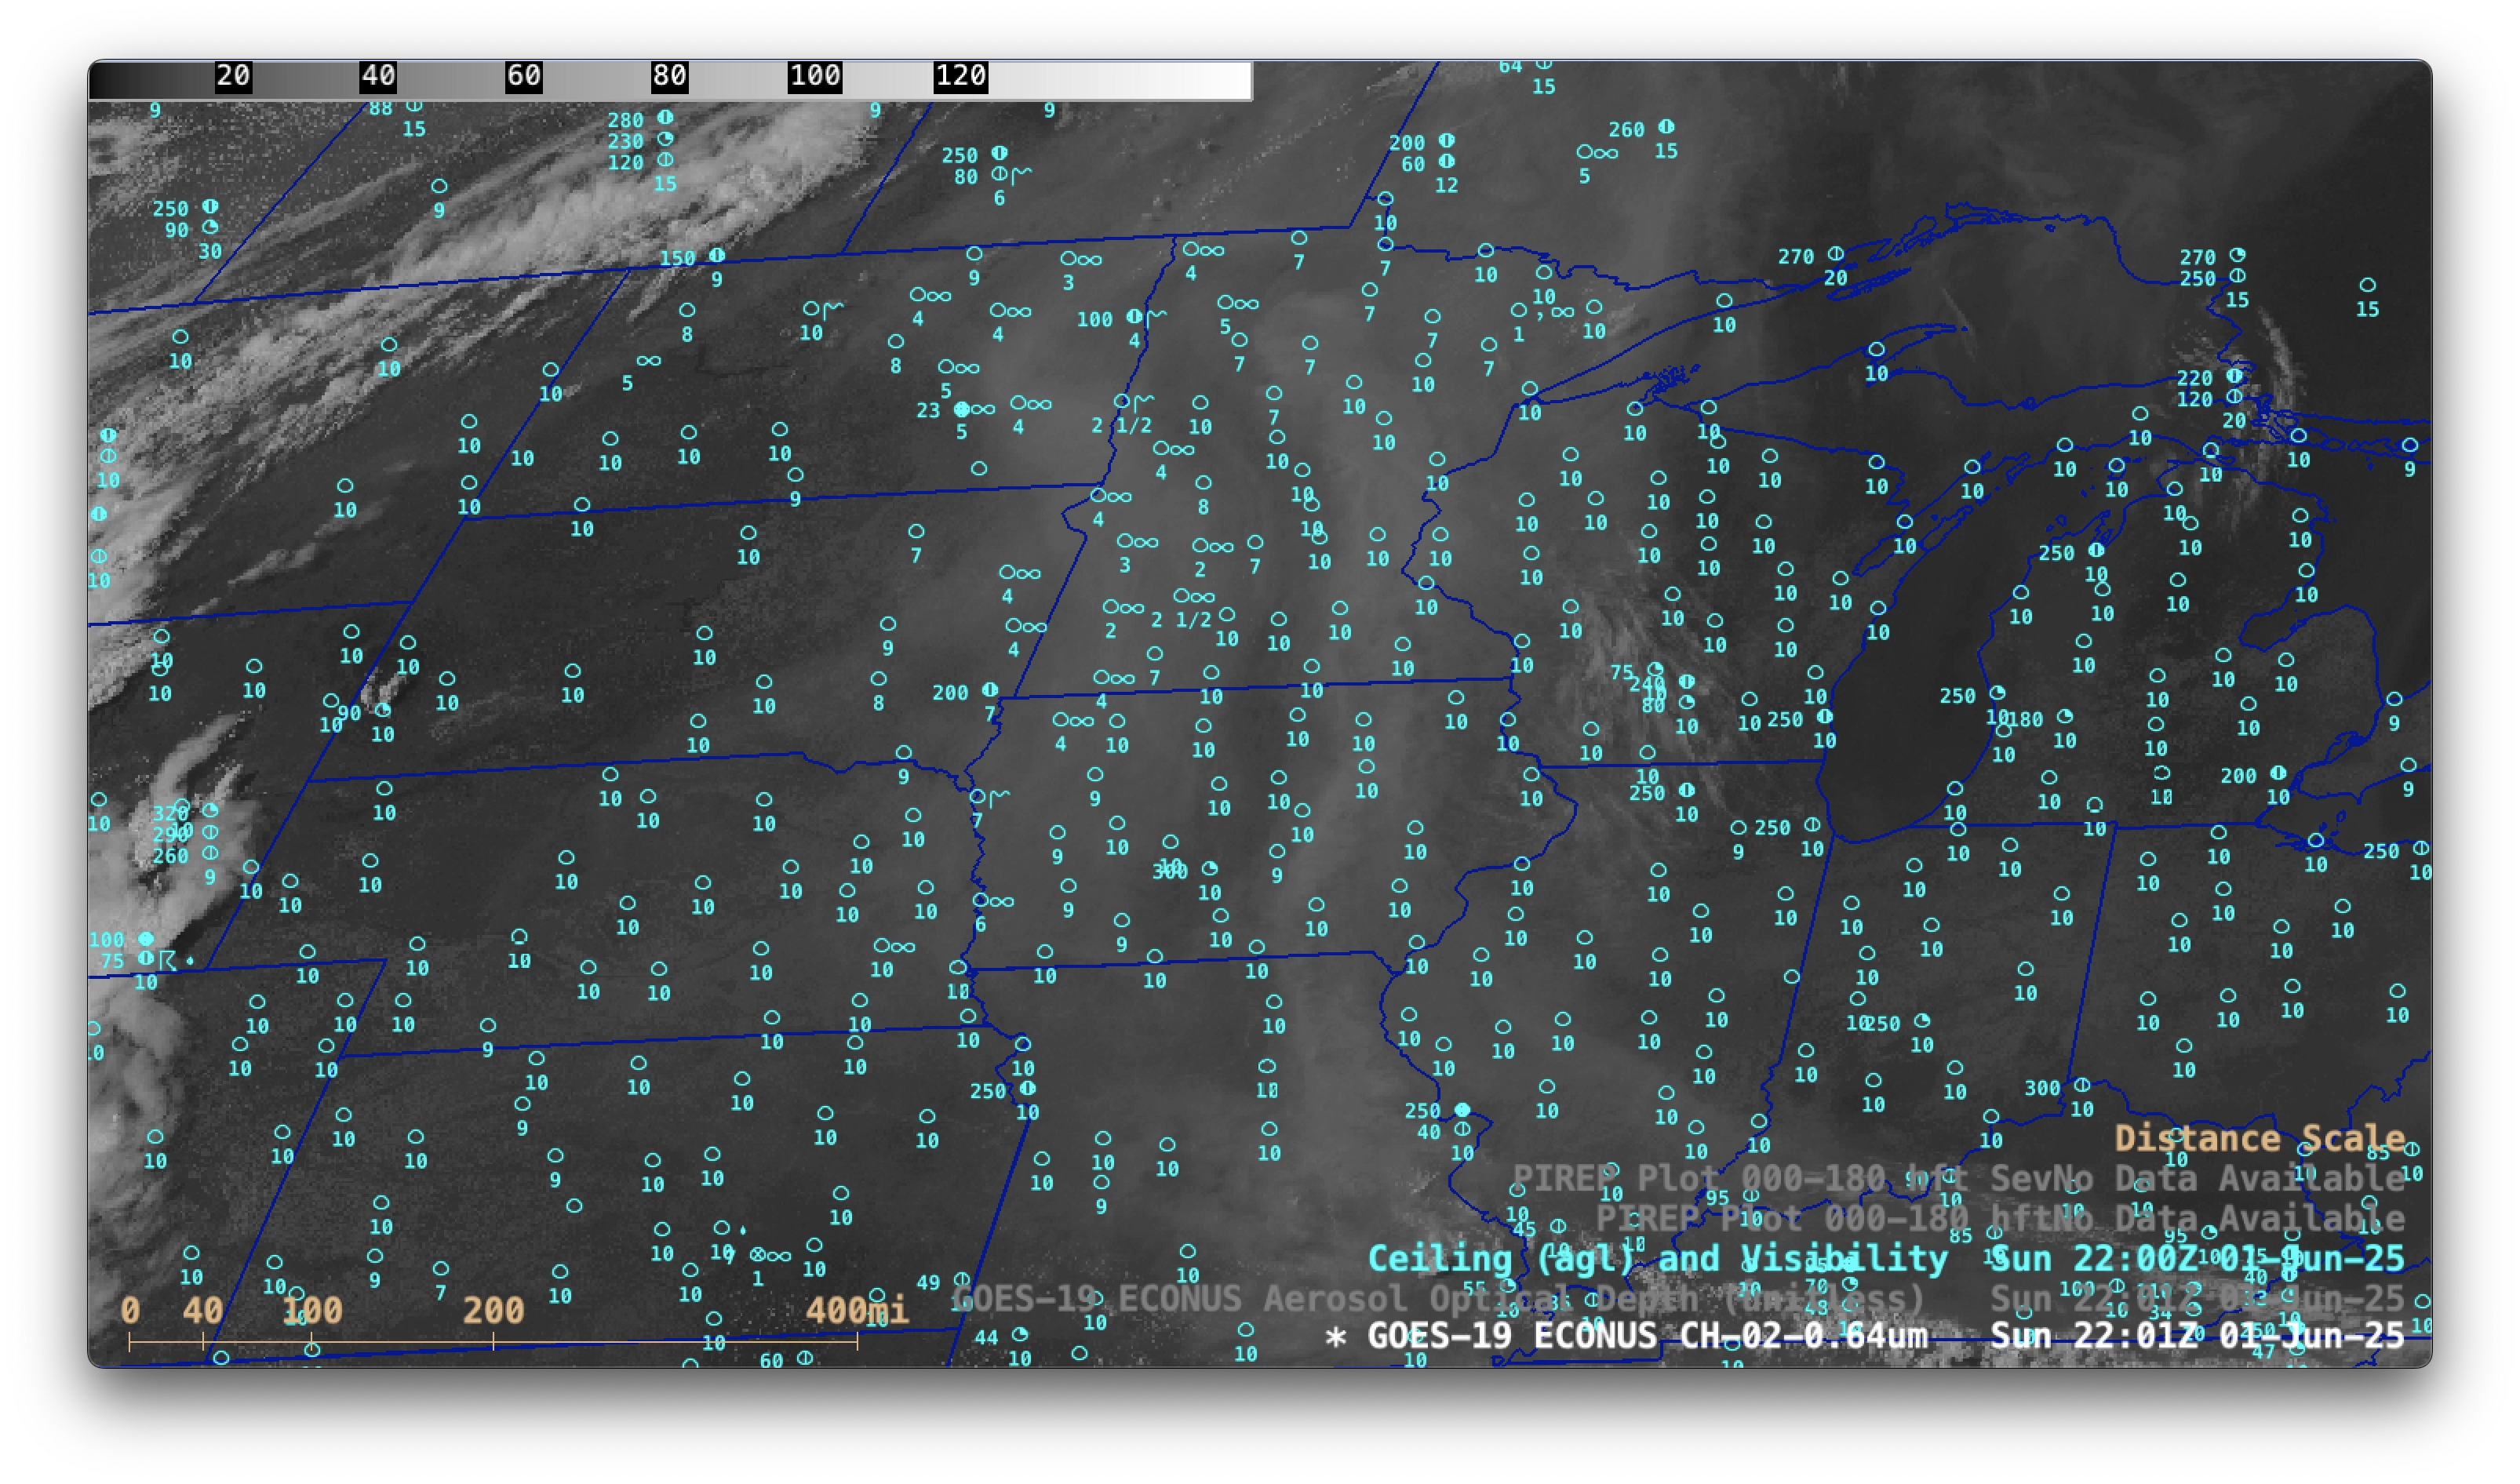
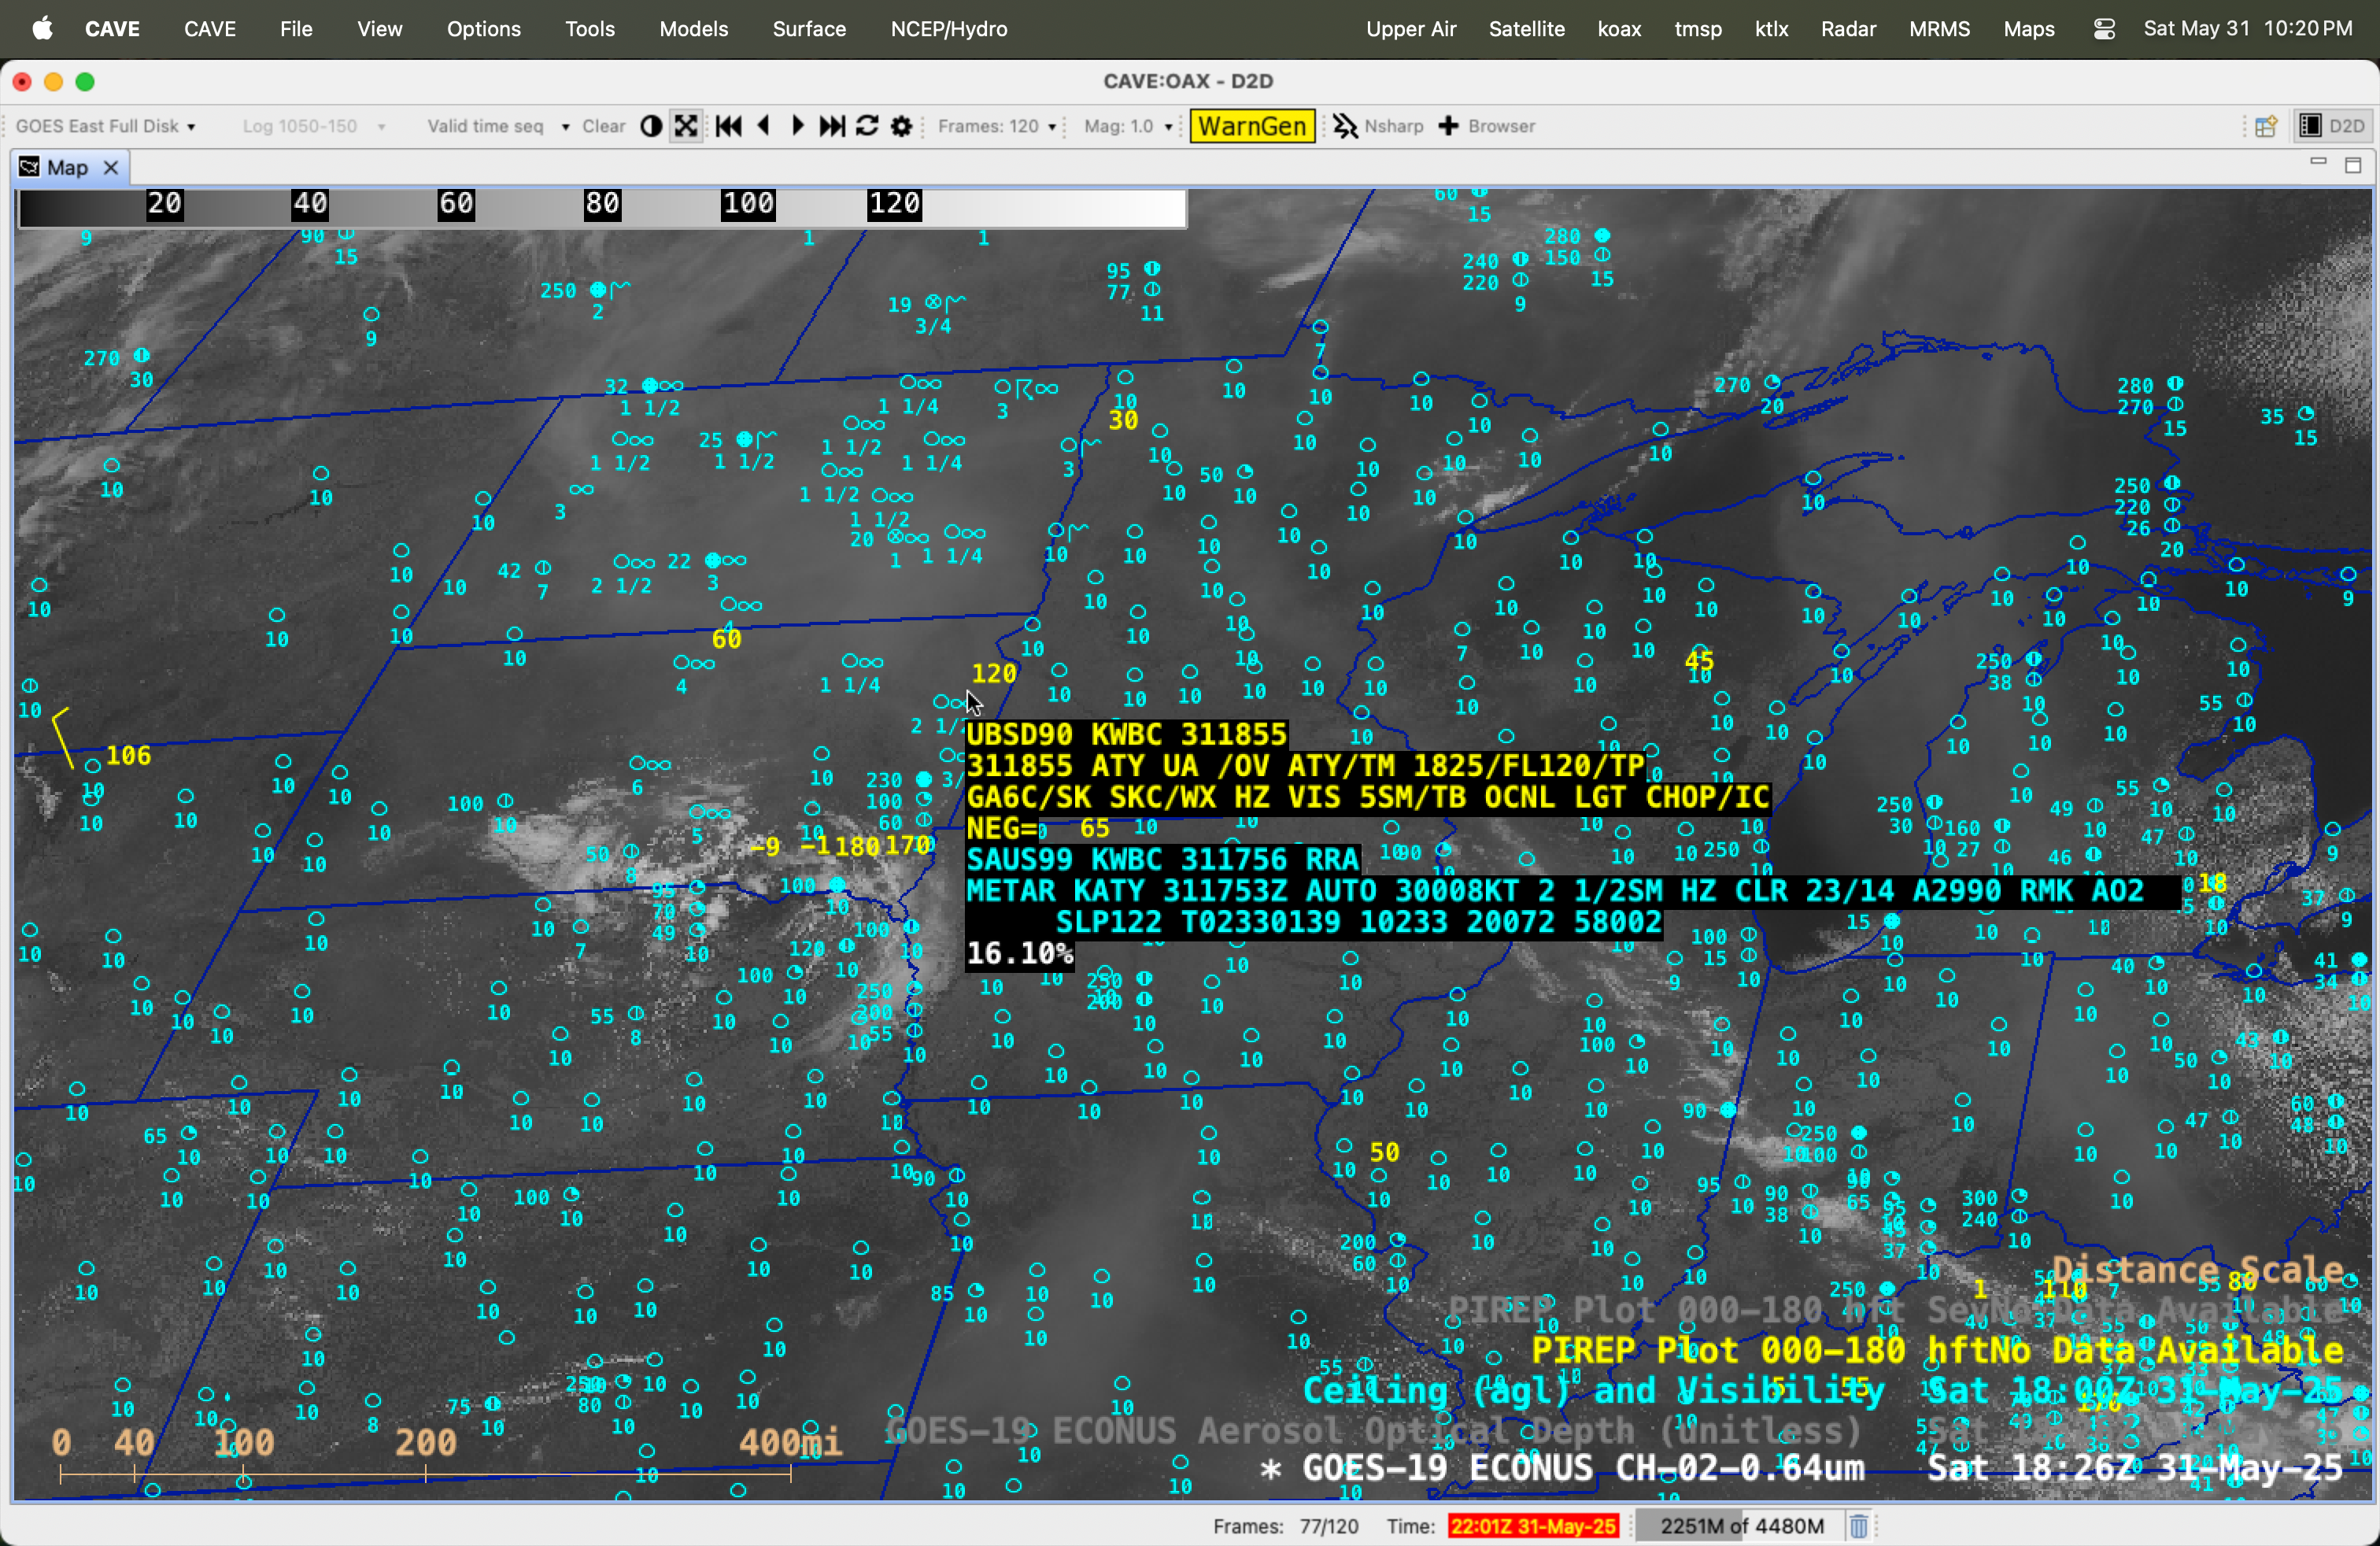
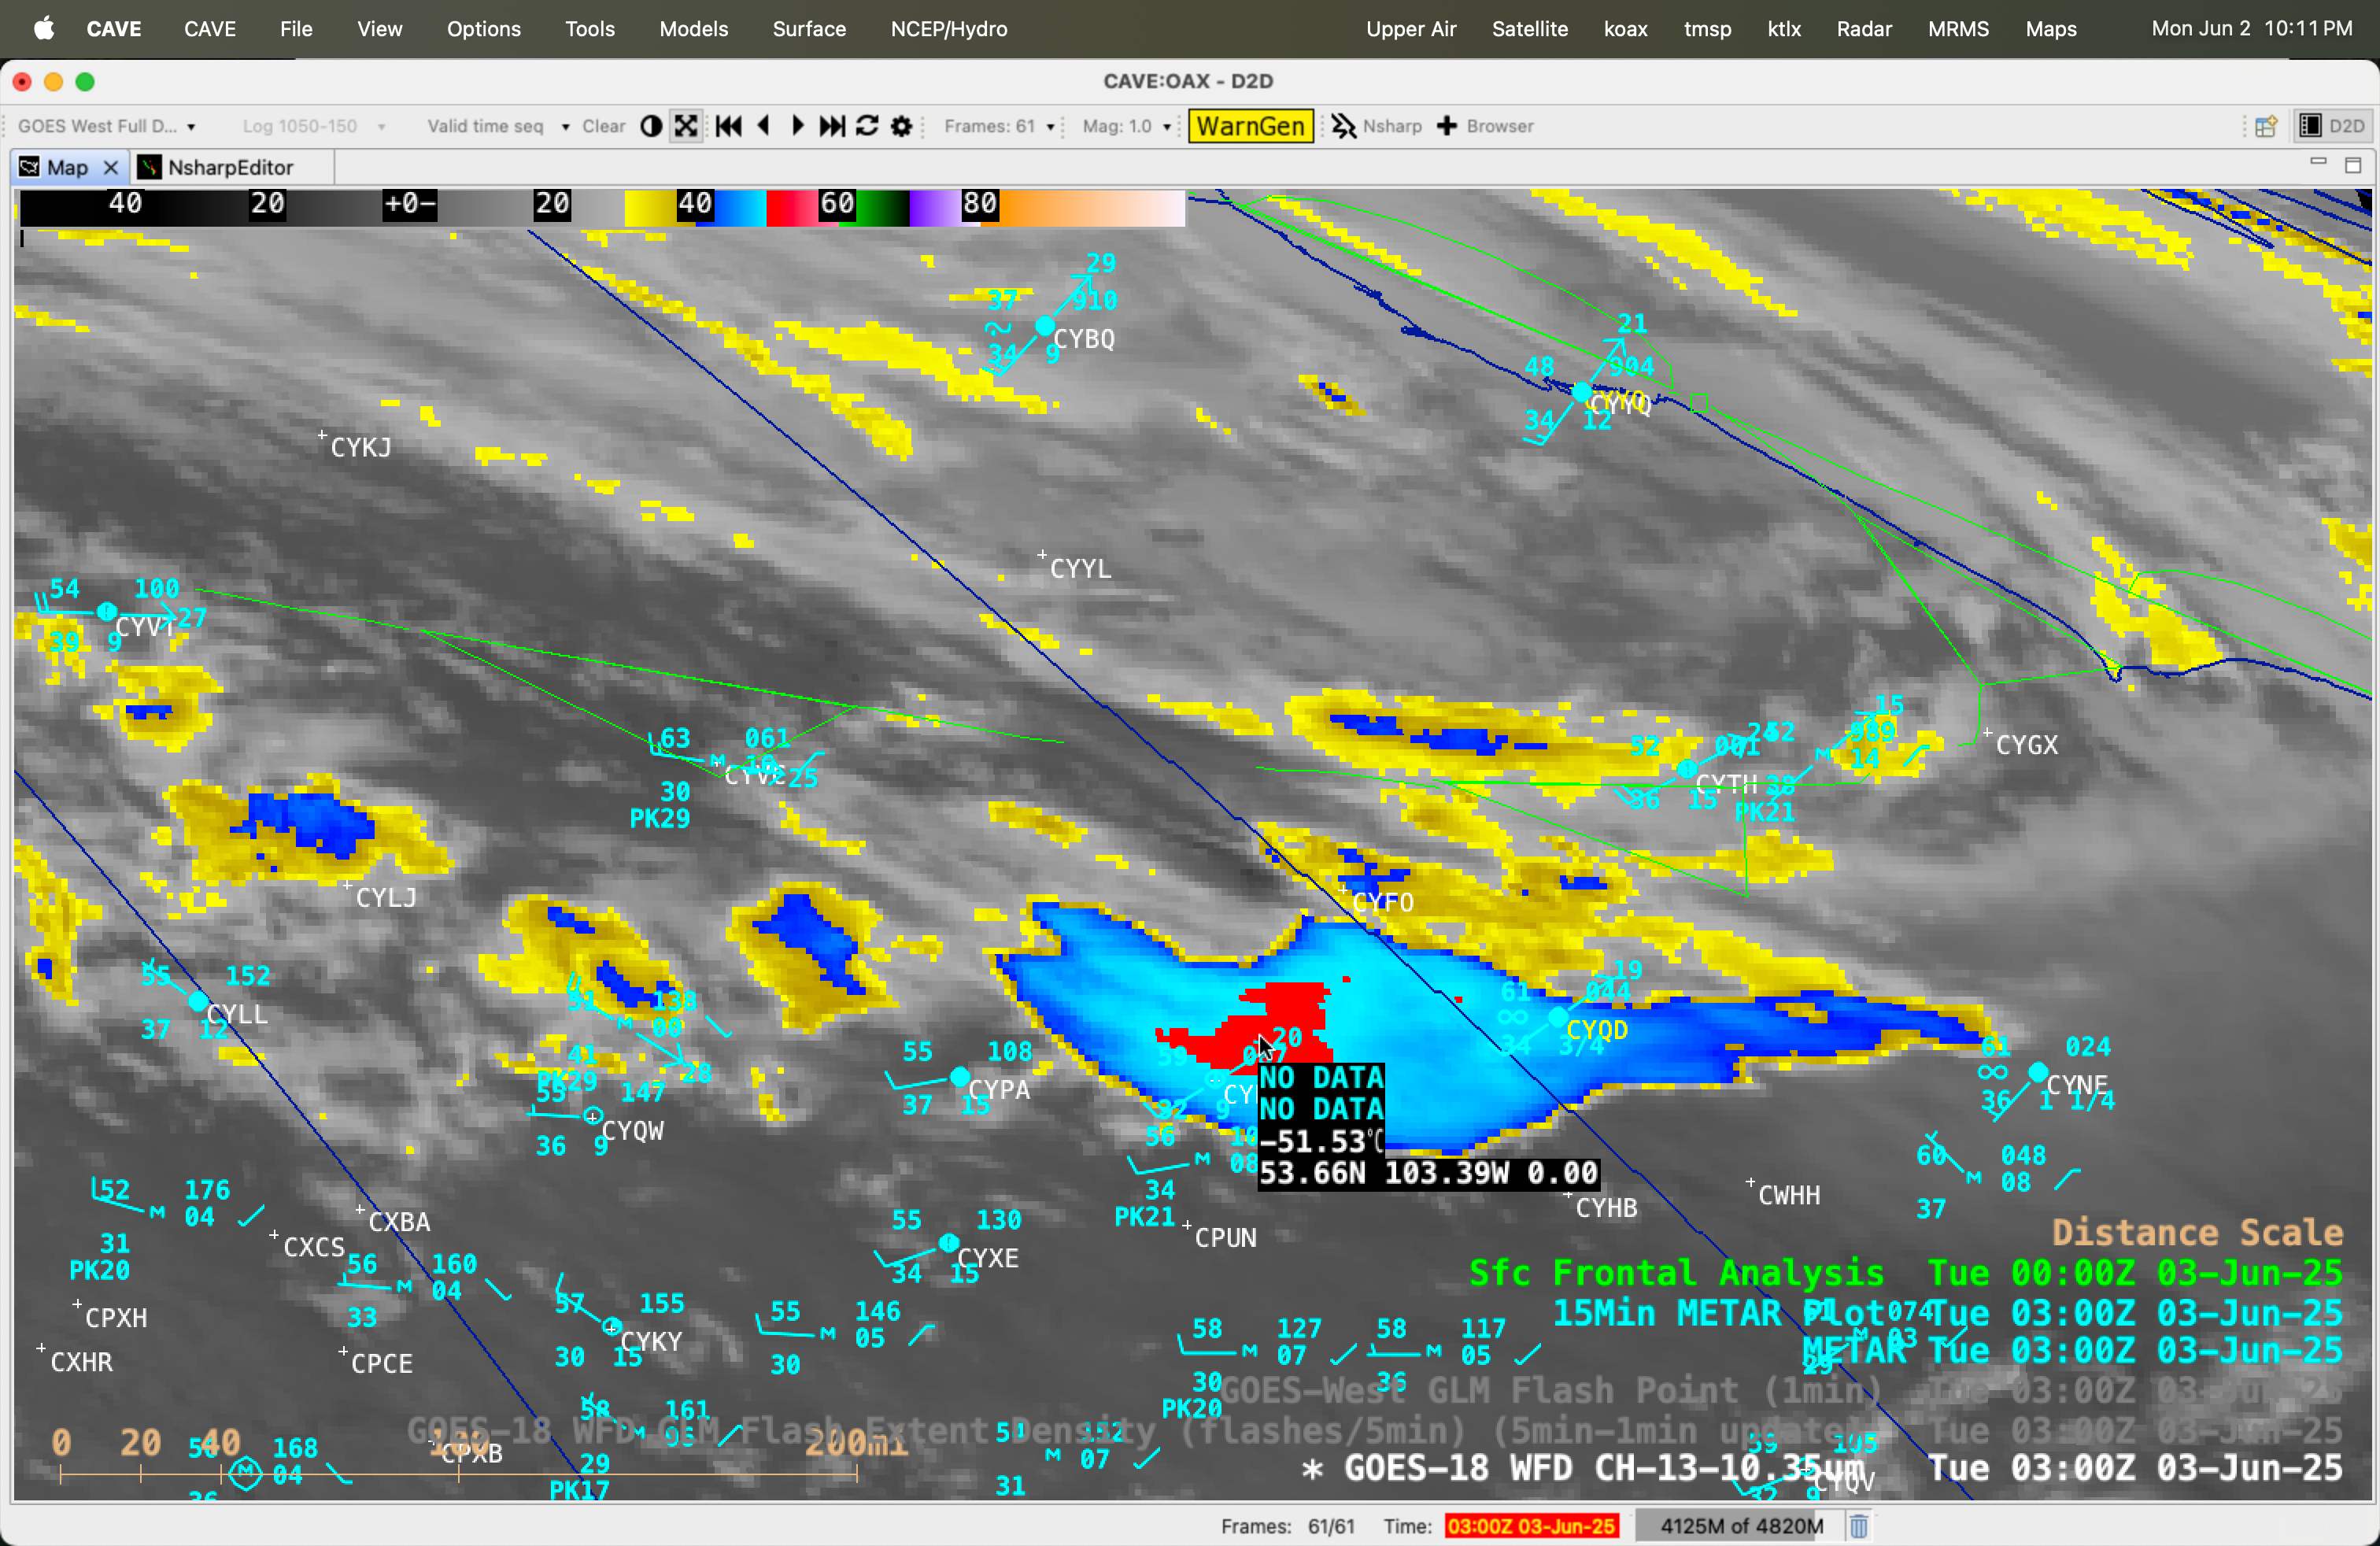
The pyroCb initially exhibited cloud-top 10.3 µm infrared brightness temperatures (IRBTs) in the -40s C (denoted by shades of blue to cyan) — a necessary condition to be classified as a pyroCb — beginning at 2020 UTC (below); nearly 7 hours later, the coldest pyroCb cloud-top IRBT had cooled to -51.53ºC at 0300 UTC on 03 June. The peak wind gust at La Ronge during the time period shown was 43 knots (49 mph). Note that in western Manitoba haze (not smoke) restricted the surface visibility to 3/4 mile at The Pas (CYQD) and 1-1/4 mile at Norway House (CYNE) by 0300 UTC on 03 June — this was due to blowing dust originating in Saskatchewan (more on this blowing dust later in the blog post).
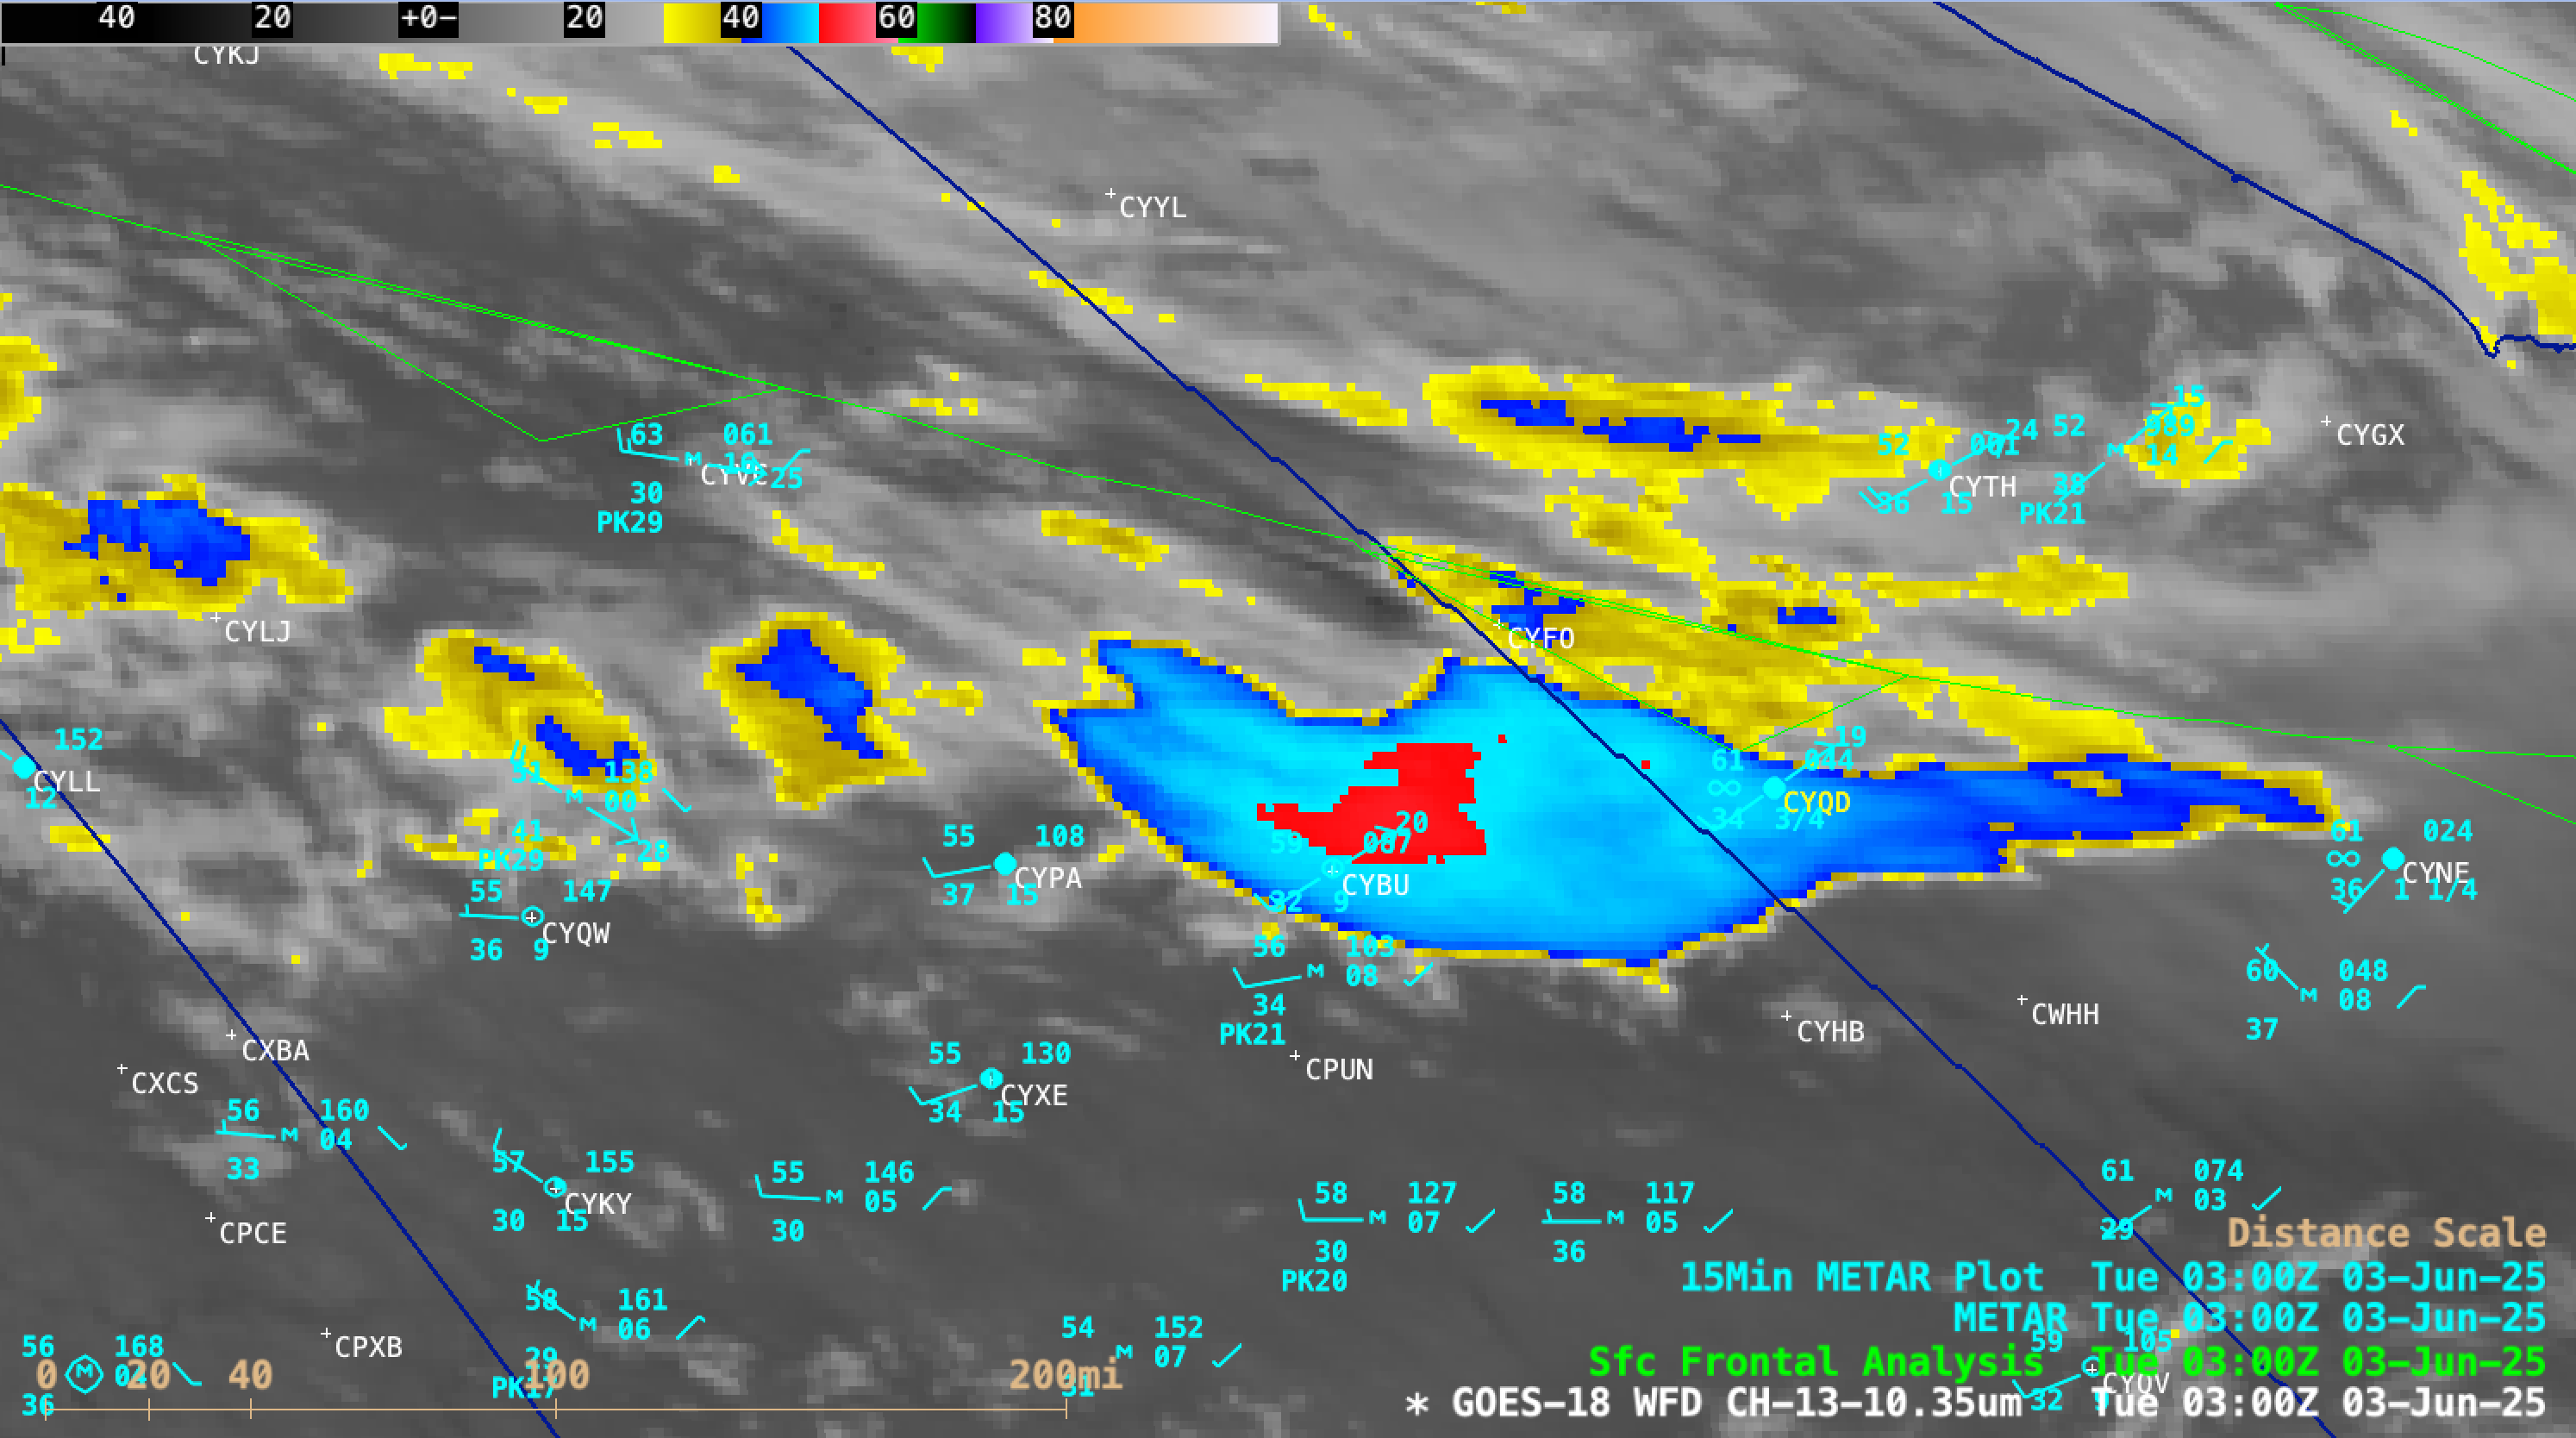
10-minute GOES-18 Clean Infrared Window (10.3 µm) images, from 1700 UTC on 02 June to 0310 UTC on 03 June [click to play MP4 animation]
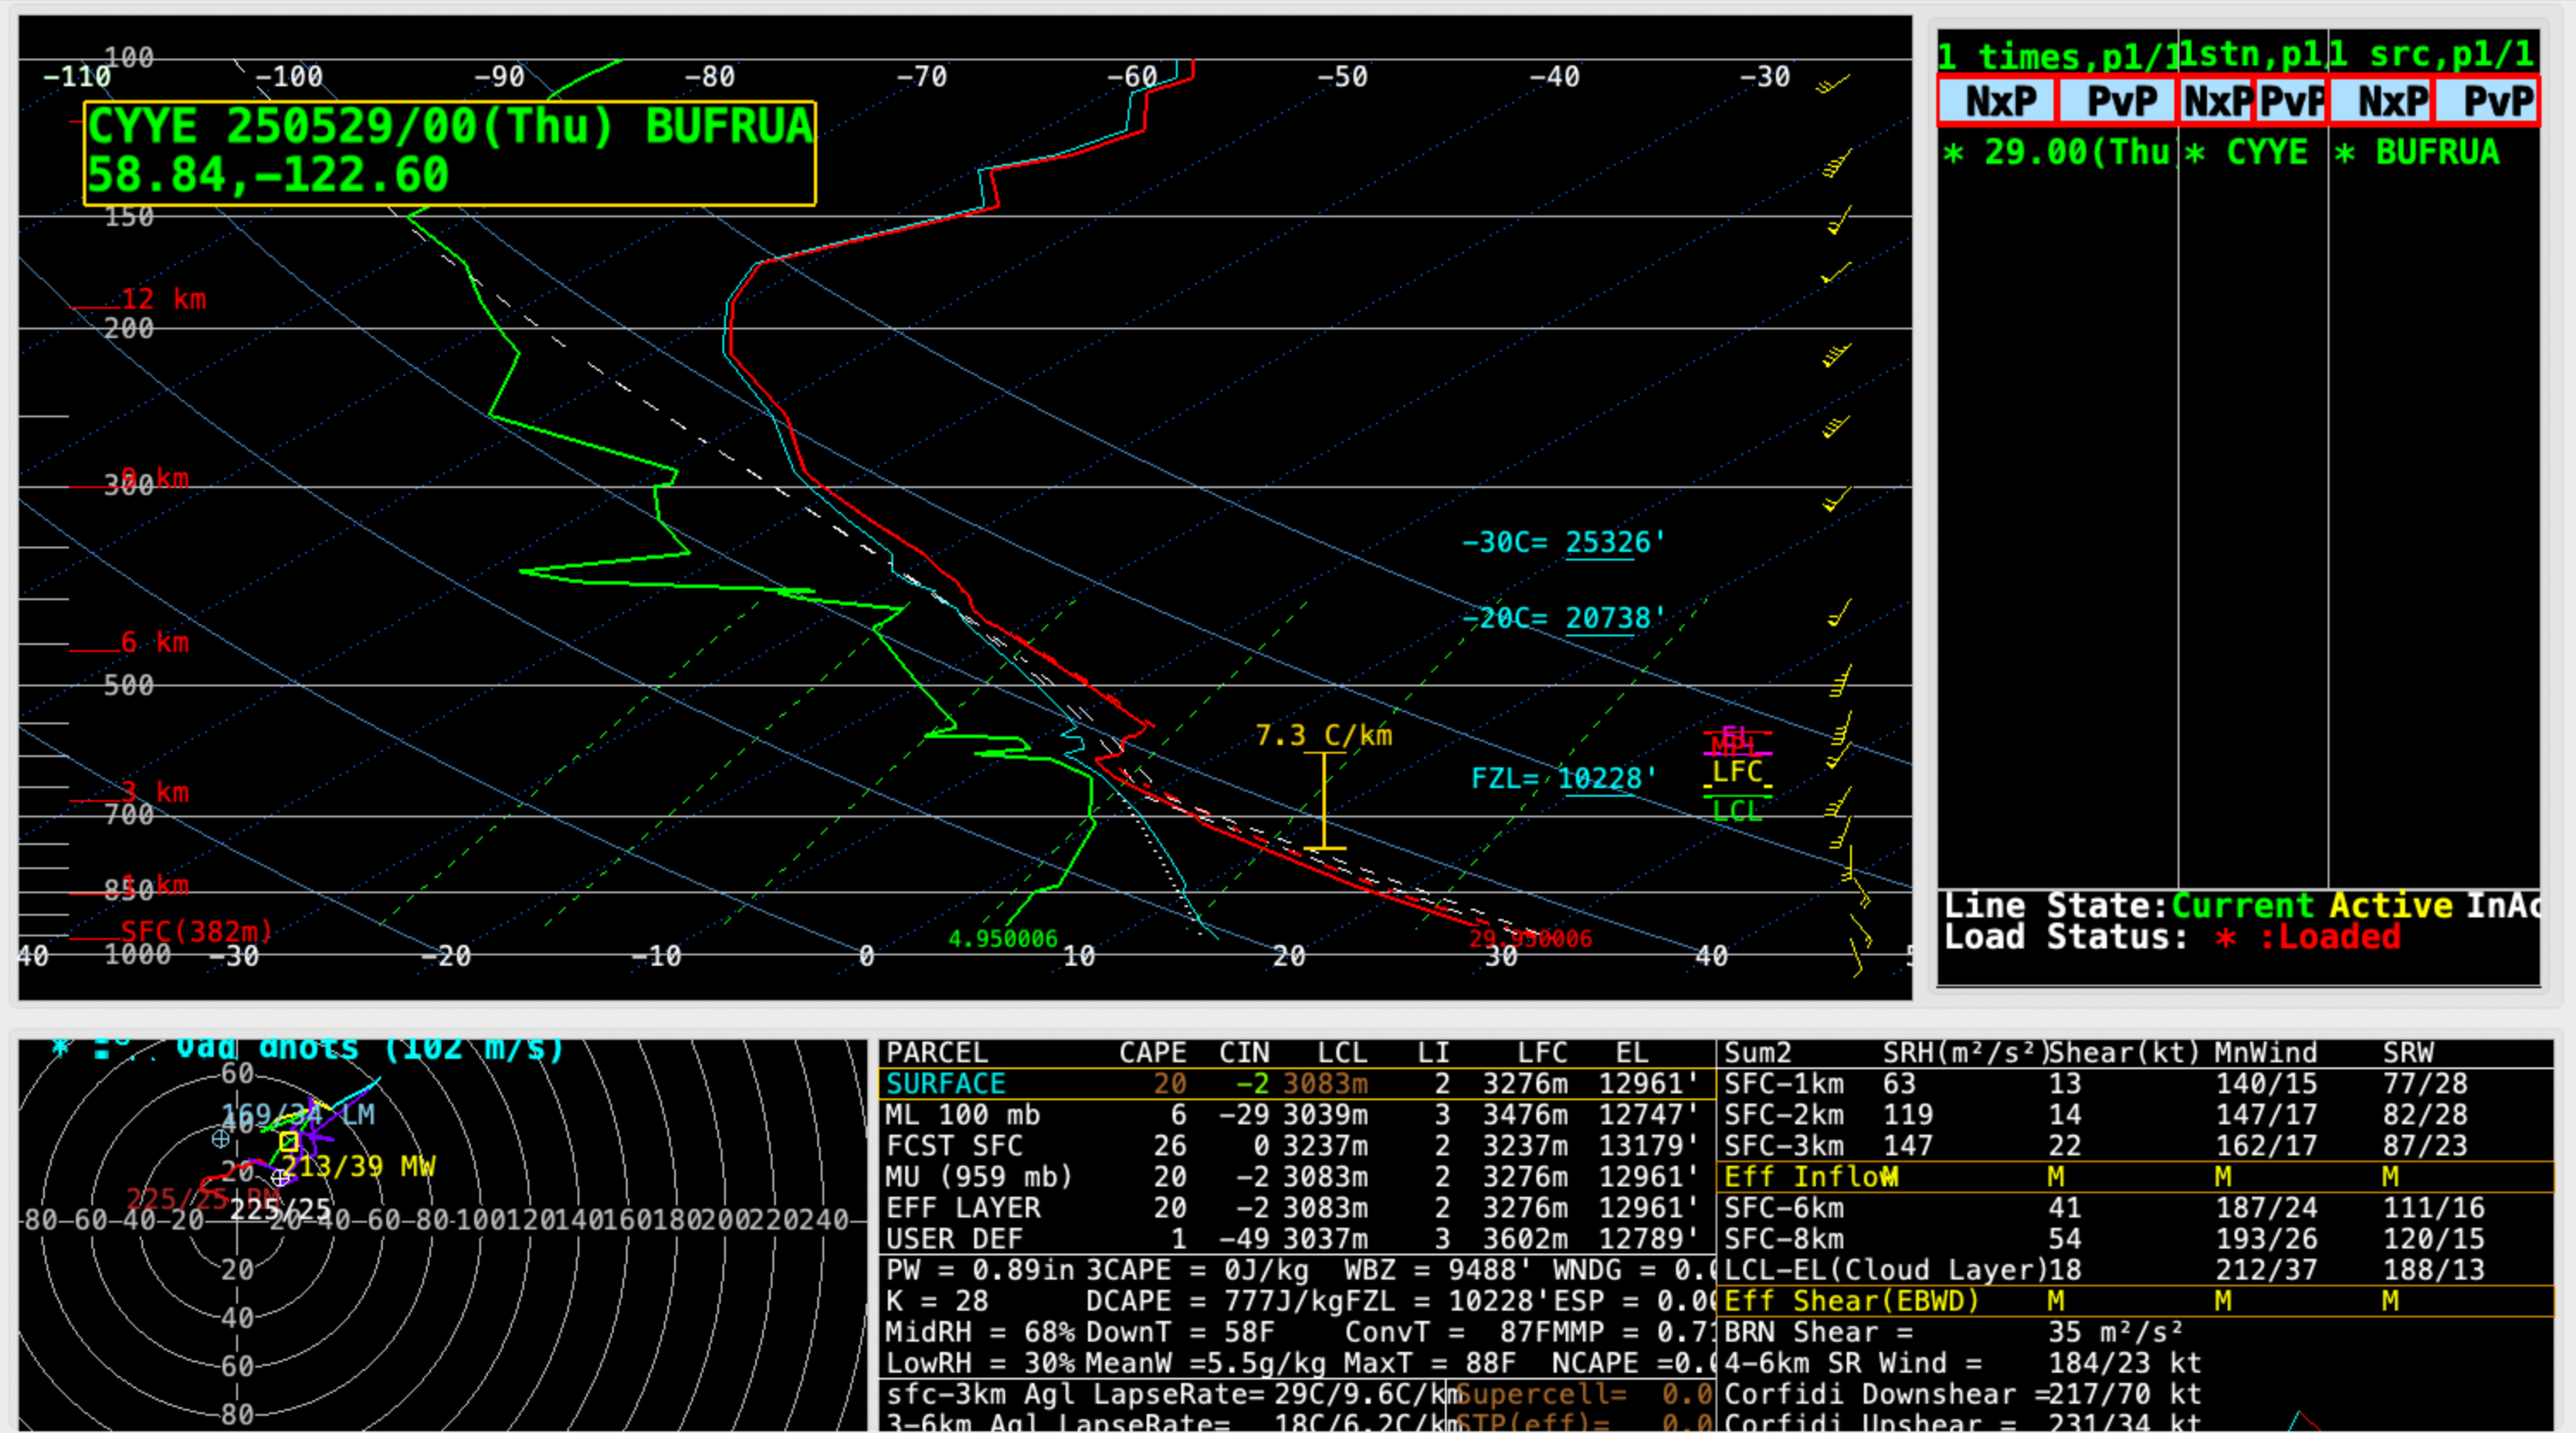
A plot of rawinsonde data from The Pas, Manitoba (CYQD) at 0000 UTC on 03 June
(below) included a cursor sample of the height at which the coldest GOES-18 cloud-top infrared brightness temperature of the pyroCb occurred (sensed over Saskatchewan at
0300 UTC). This air parcel height was around 0.5 km above that of the CYQD tropopause.
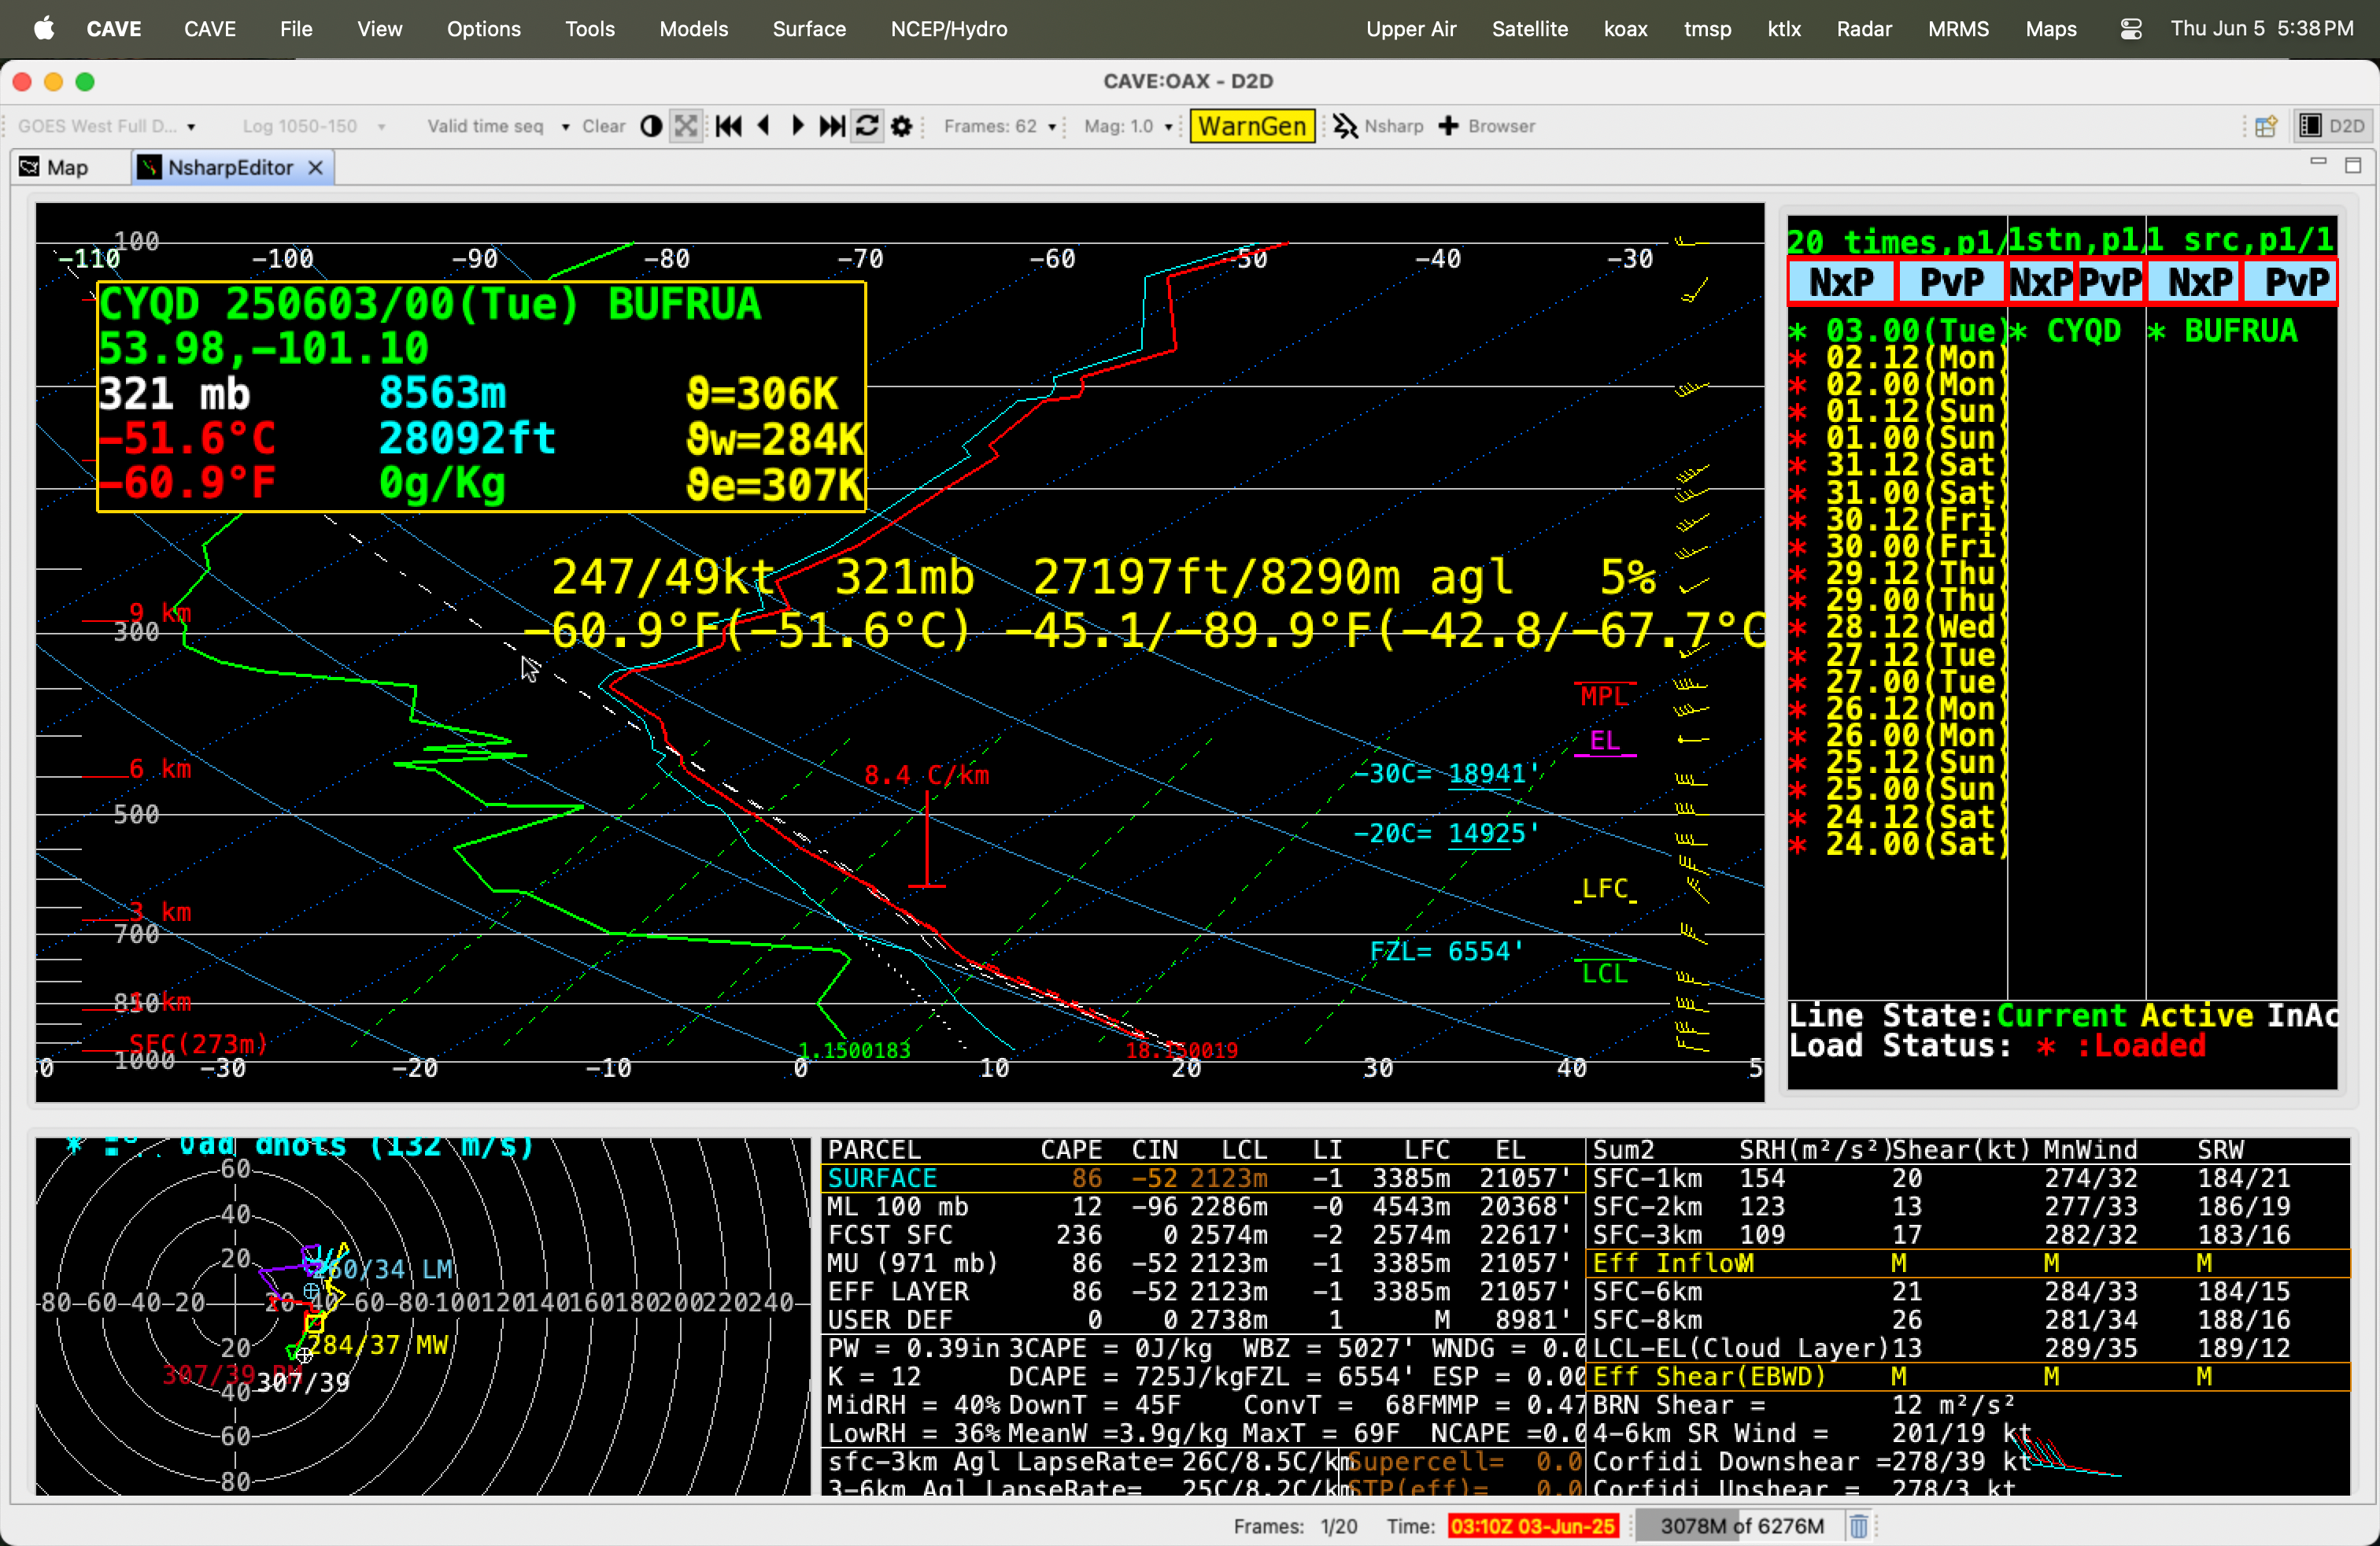
Plot of rawinsonde data from The Pas, Manitoba at 0000 UTC on 03 June — with a cursor sample of the height of the coldest cloud-top infrared brightness temperature of the pyroCb (sensed at 0300 UTC) [click to enlarge]
A toggle between the GOES-18 Infrared image at 2130 UTC — with/without an overlay of
GLM Flash Extent Density (large dark-blue pixels)
(below) showed there was a brief period of satellite-detected lightning activity associated with this pyroCb as it was located southeast of La Ronge CYVC (there was also lightning seen with some of the convection southwest of La Ronge).

GOES-18 Clean Infrared Window (10.3 µm) image at 2130 UTC on 02 June, with/without an overlay of GLM Flash Extent Density (large dark-blue pixels) [click to enlarge]
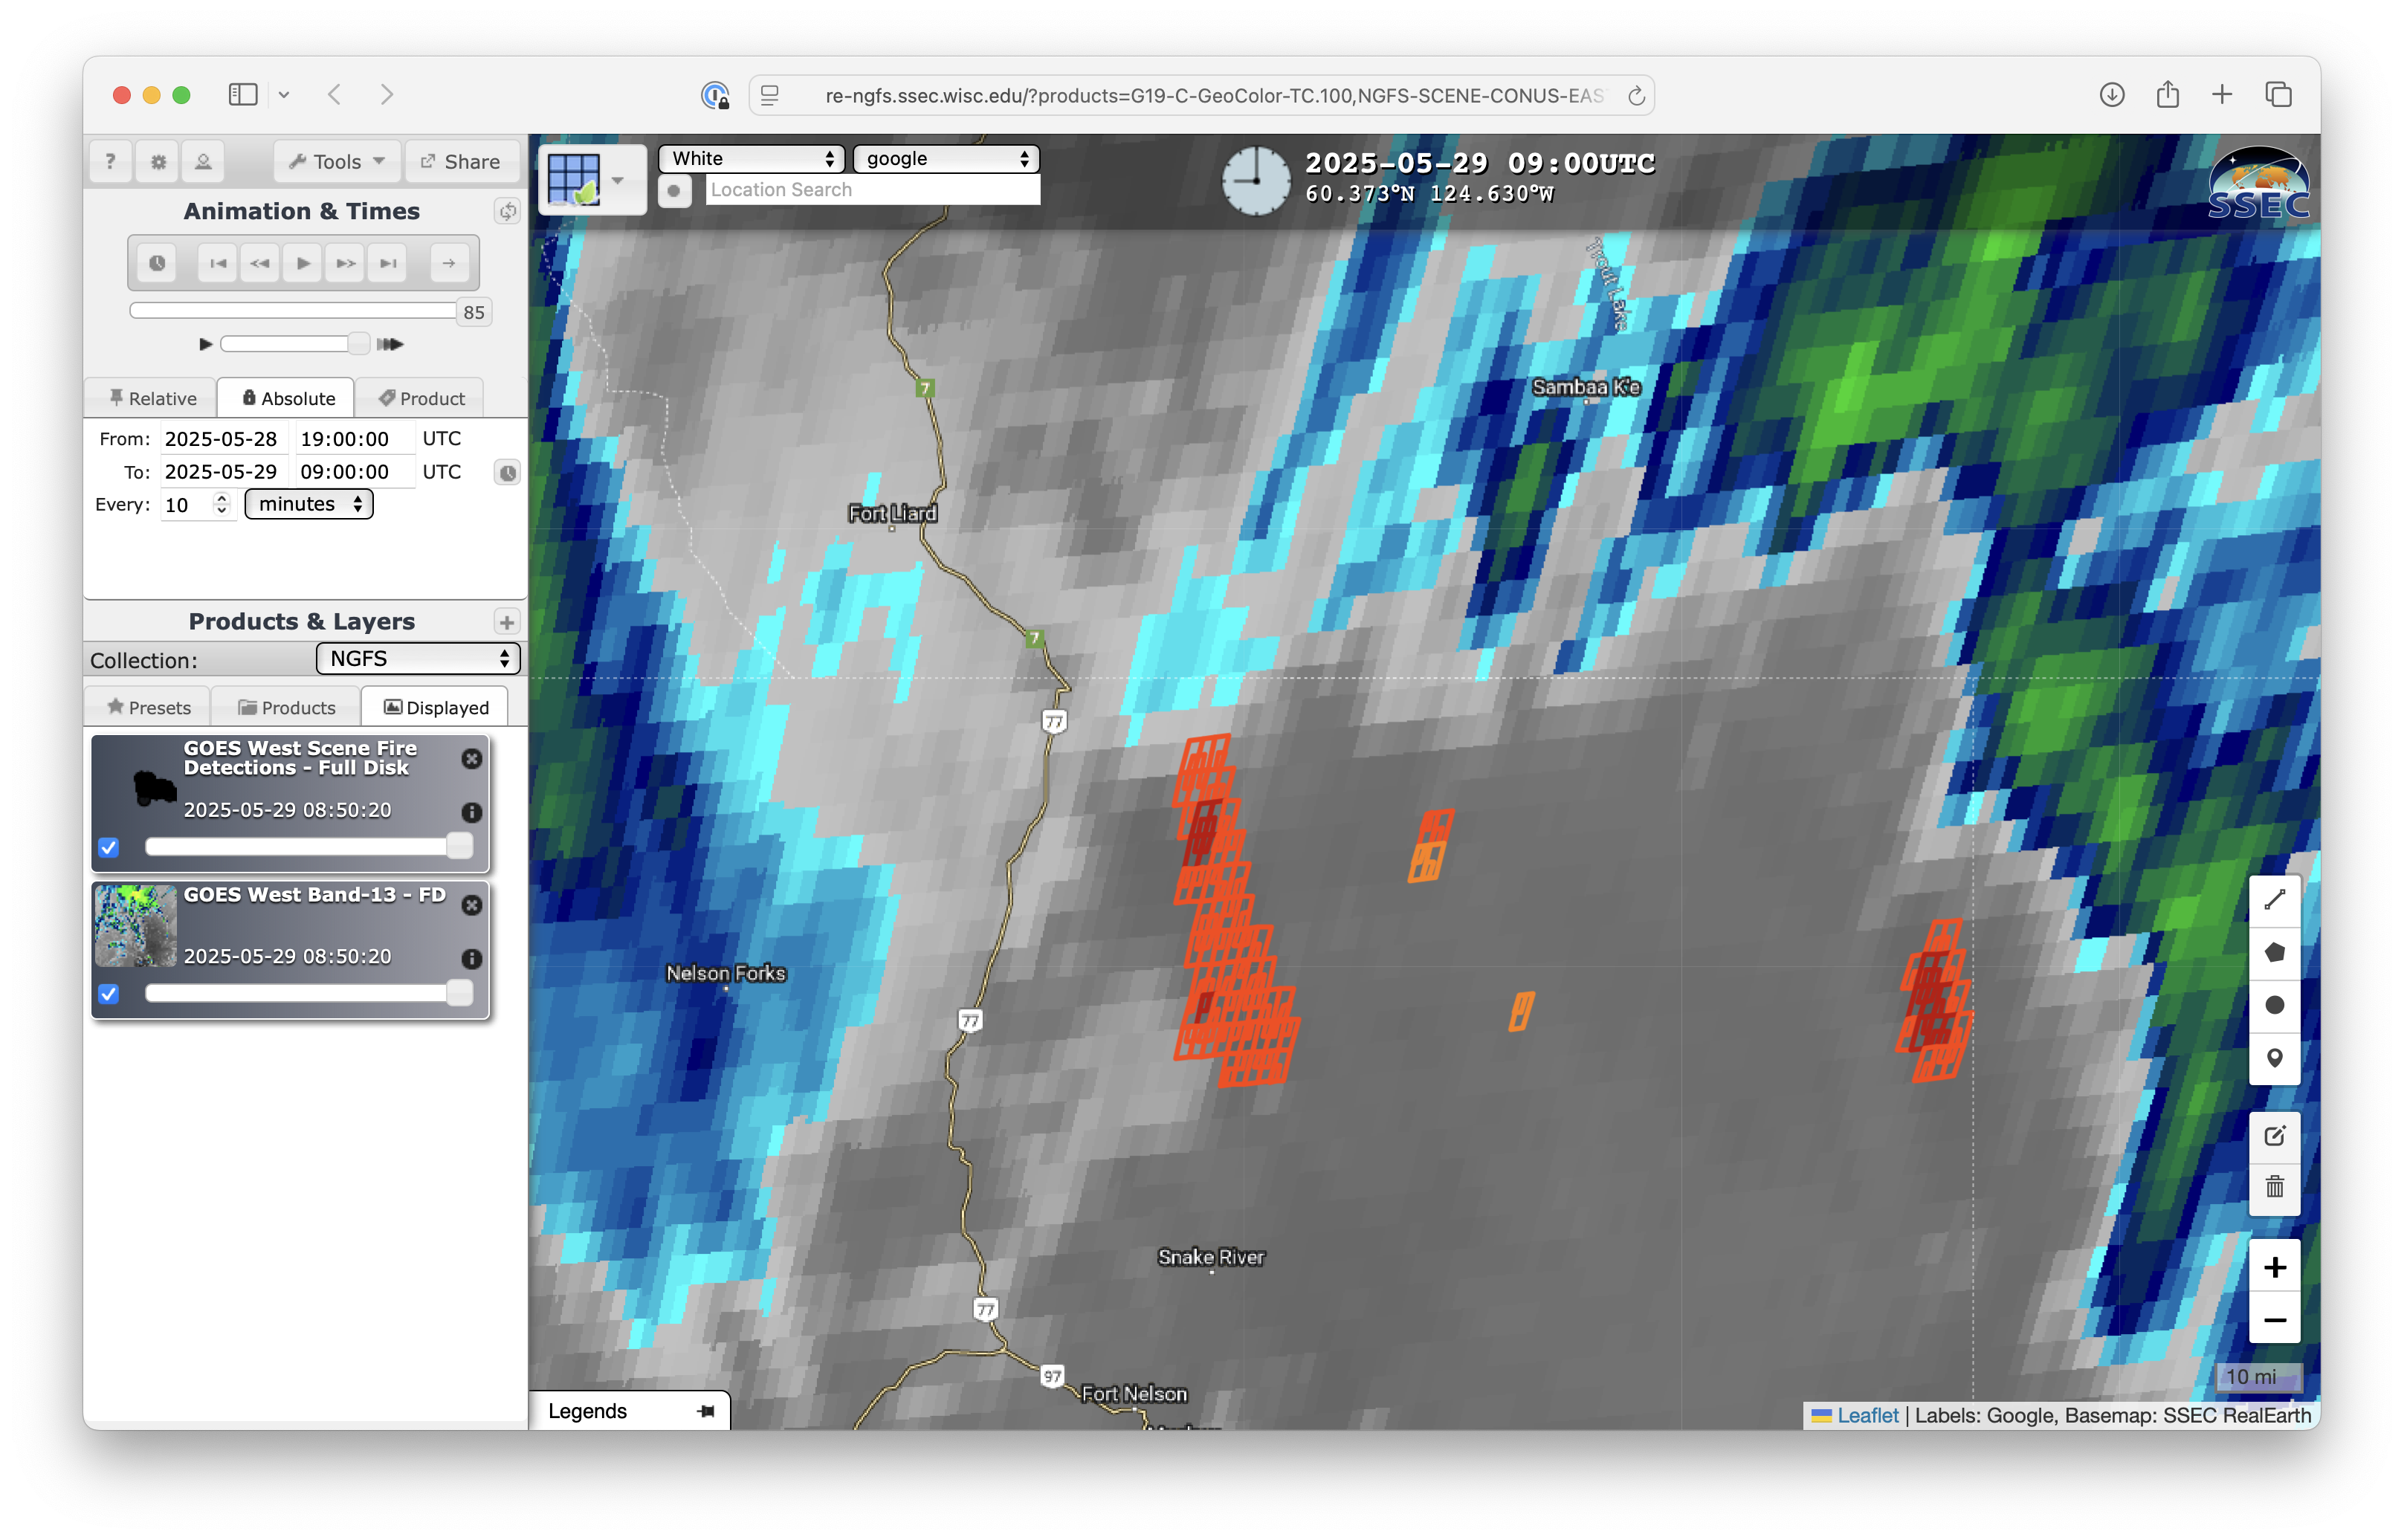
The cluster of wildfires straddling the Saskatchewan/Manitoba border was also depicted by
Next Generation Fire System (NGFS) fire detection polygons
(below), along with the formation and growth of the pyroCb cloud (brighter green enhancement).
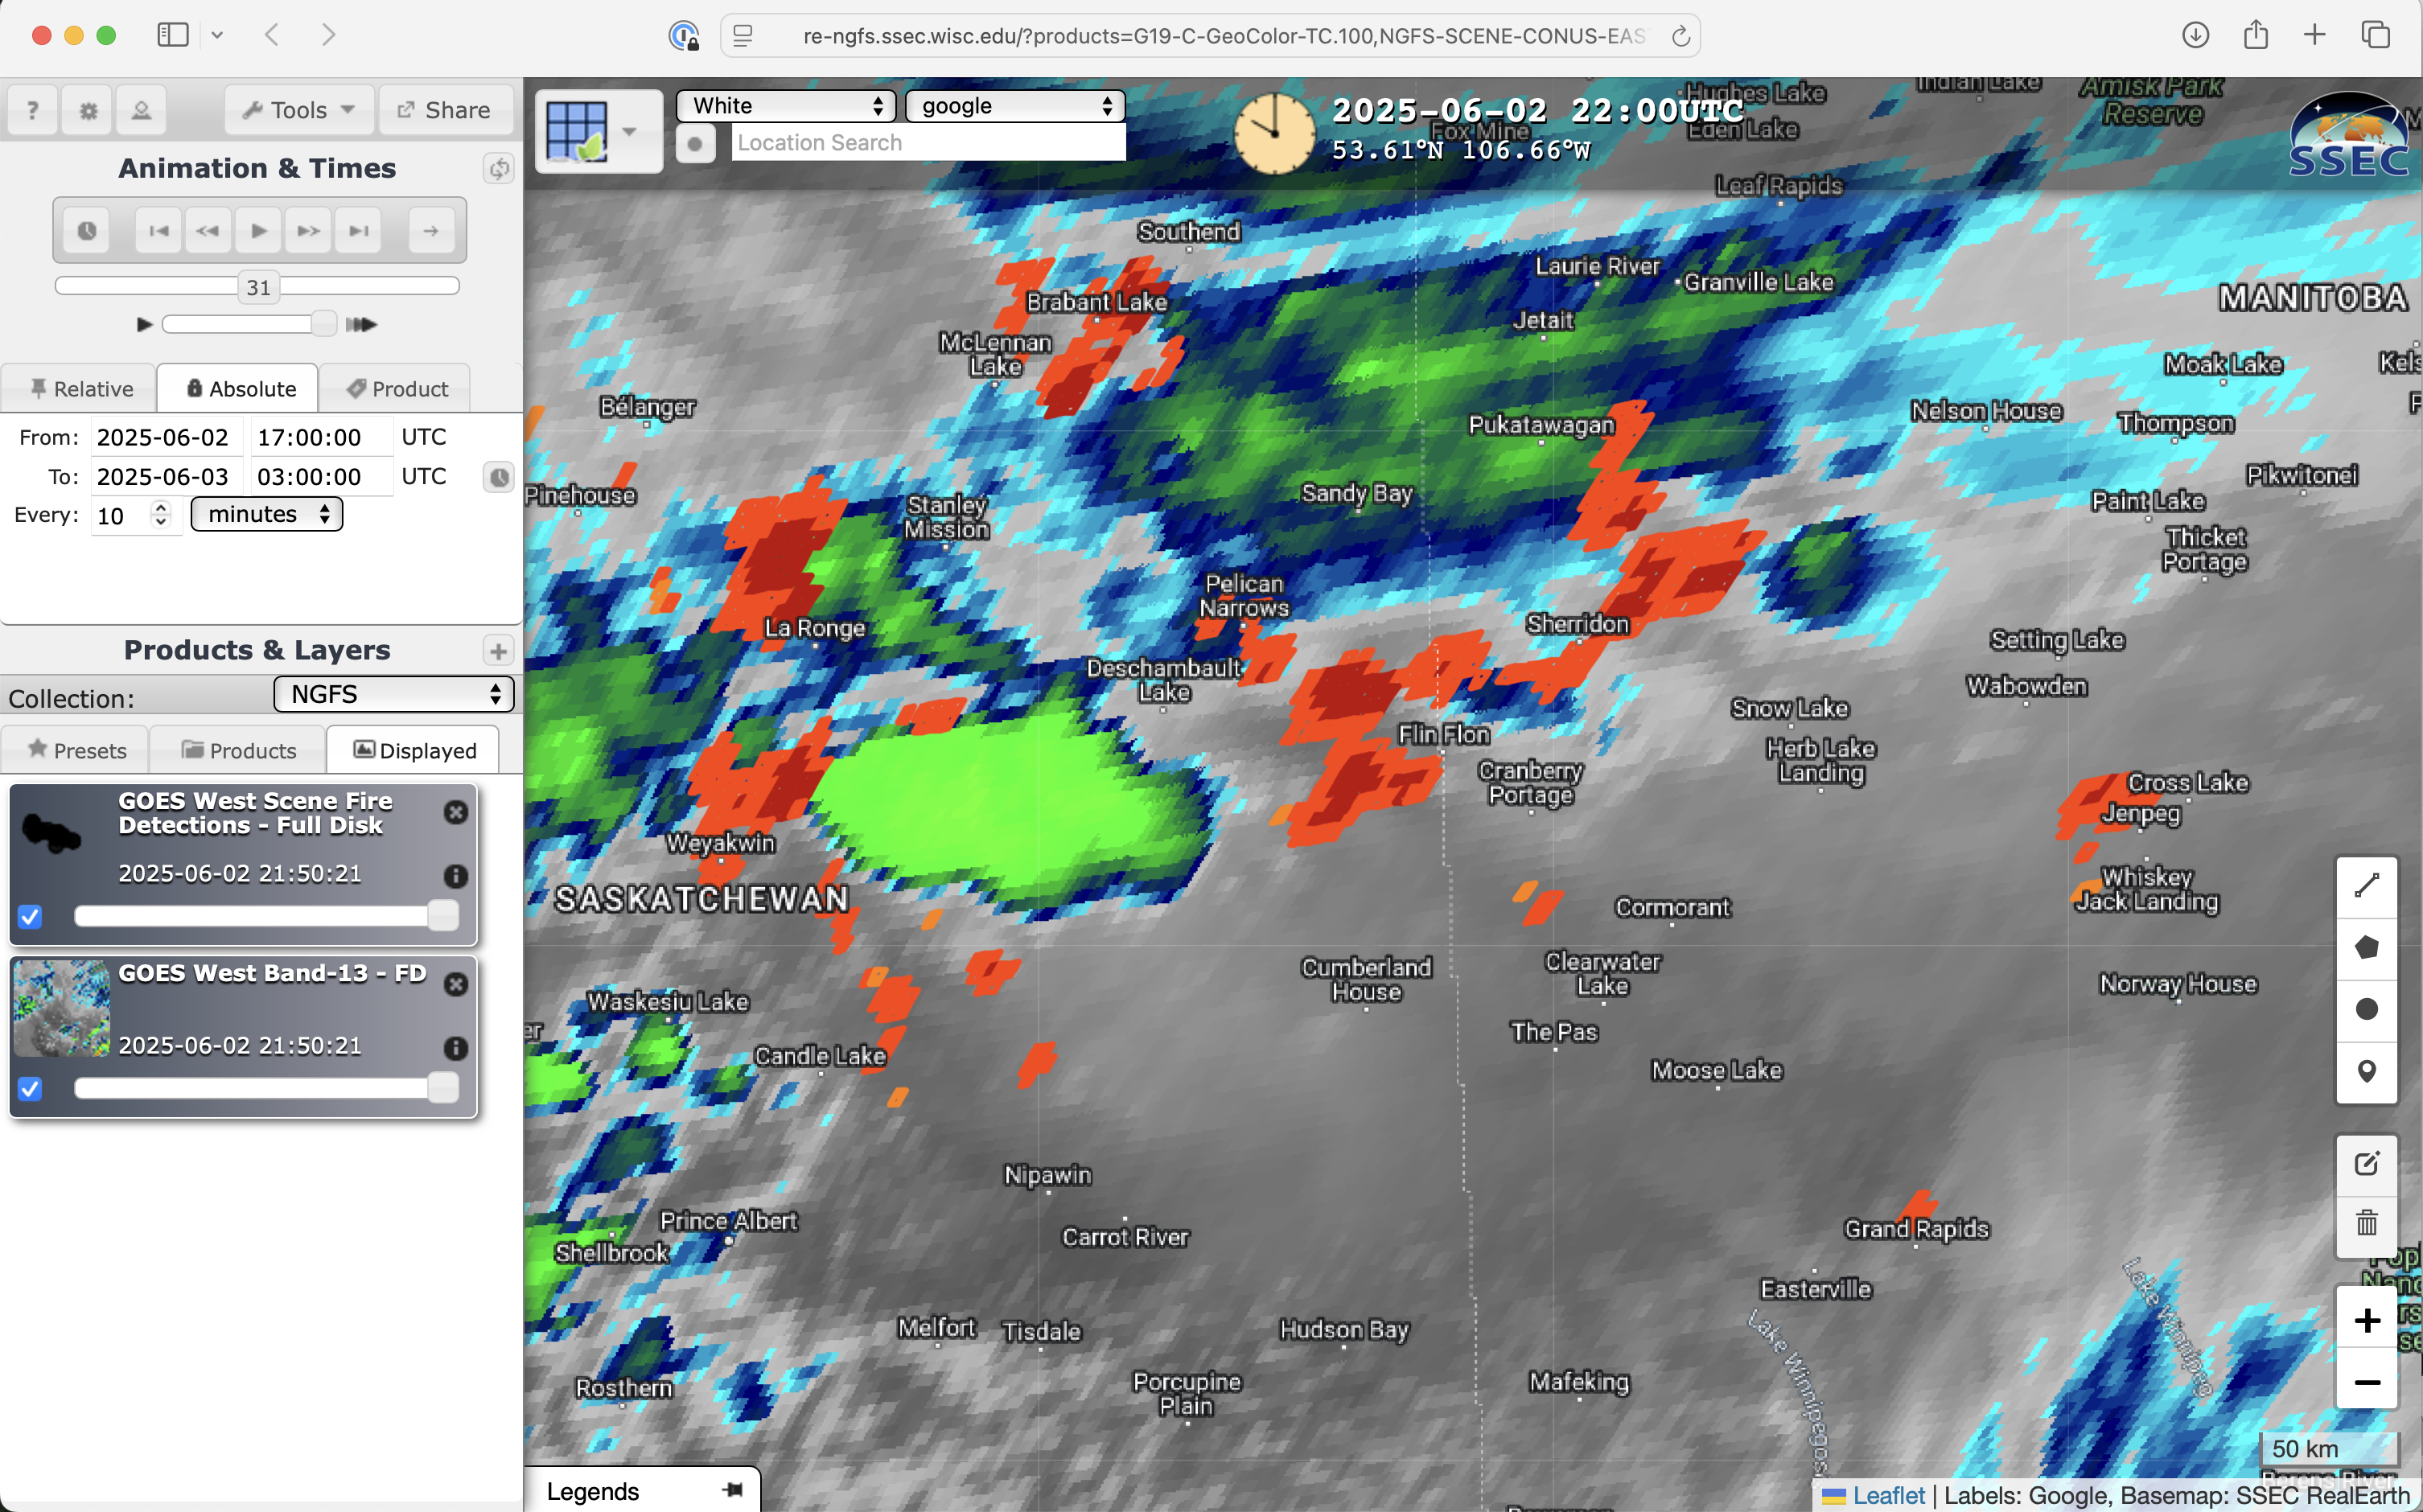
10-minute GOES-18 Infrared Window (10.3 µm) images with an overlay of NGFS Fire Detection polygons, from 1700 UTC on 02 June to 0300 UTC on 03 June [click to play MP4 animation]
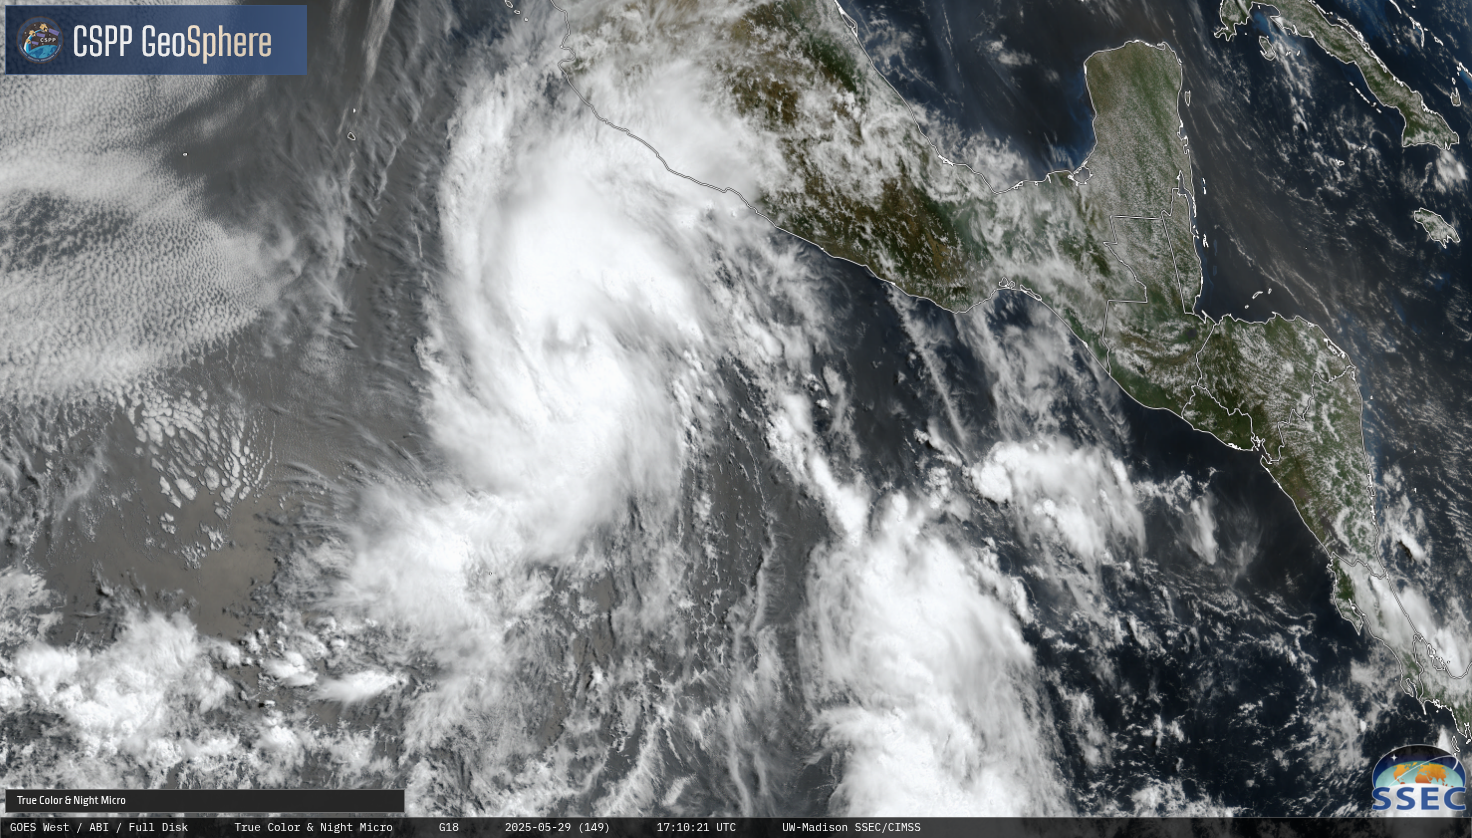
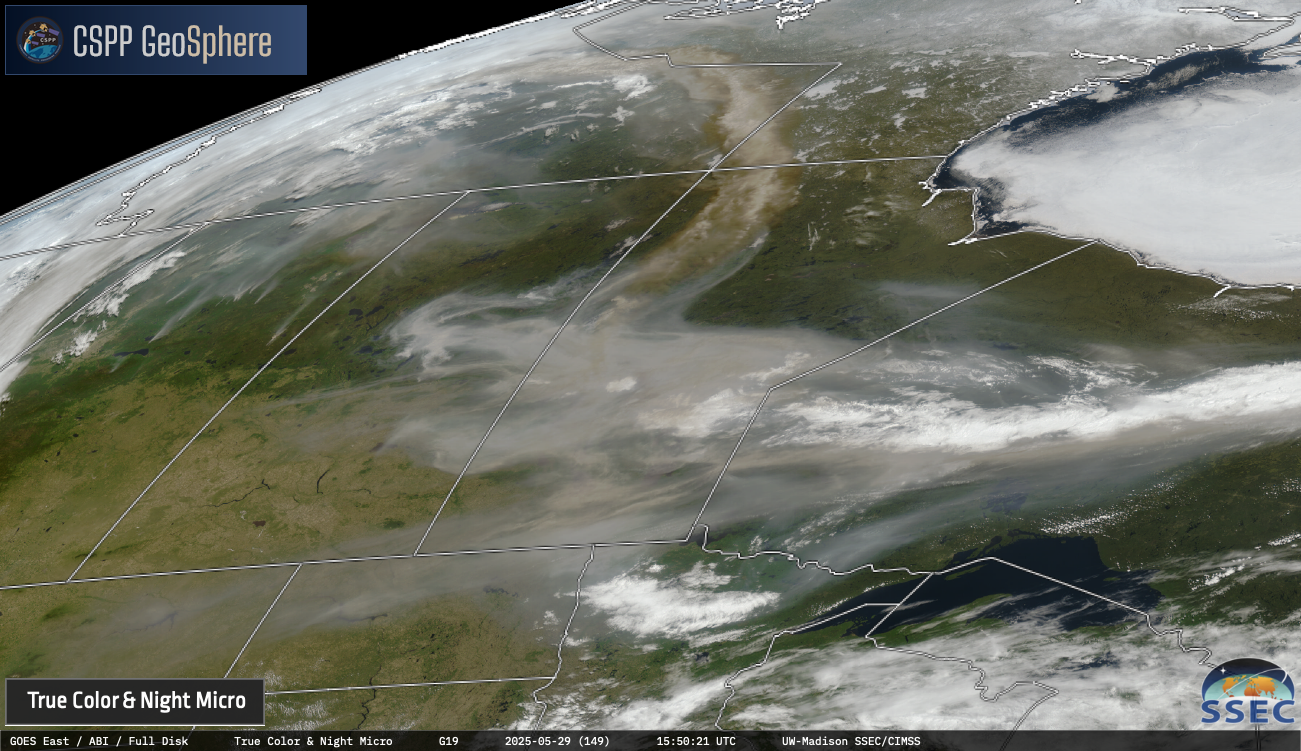
In a 14-hour animation of GOES-18 daytime True Color RGB images and Nighttime Microphysics RGB images from the
CSPP GeoSphere site
(below), after sunset the large plume of blowing dust (brighter shades of magenta) was evident as it was transported eastward across Manitoba and Ontario, just ahead of the cold (darker-red-with-intermittent-yellow-pixels) Saskatchewan pyroCb. This blowing dust was lofted by strong winds blowing across recently-plowed agricultural fields (located in central Saskatchewan, south of the wildfires burning in more northern boreal forest areas of the province).
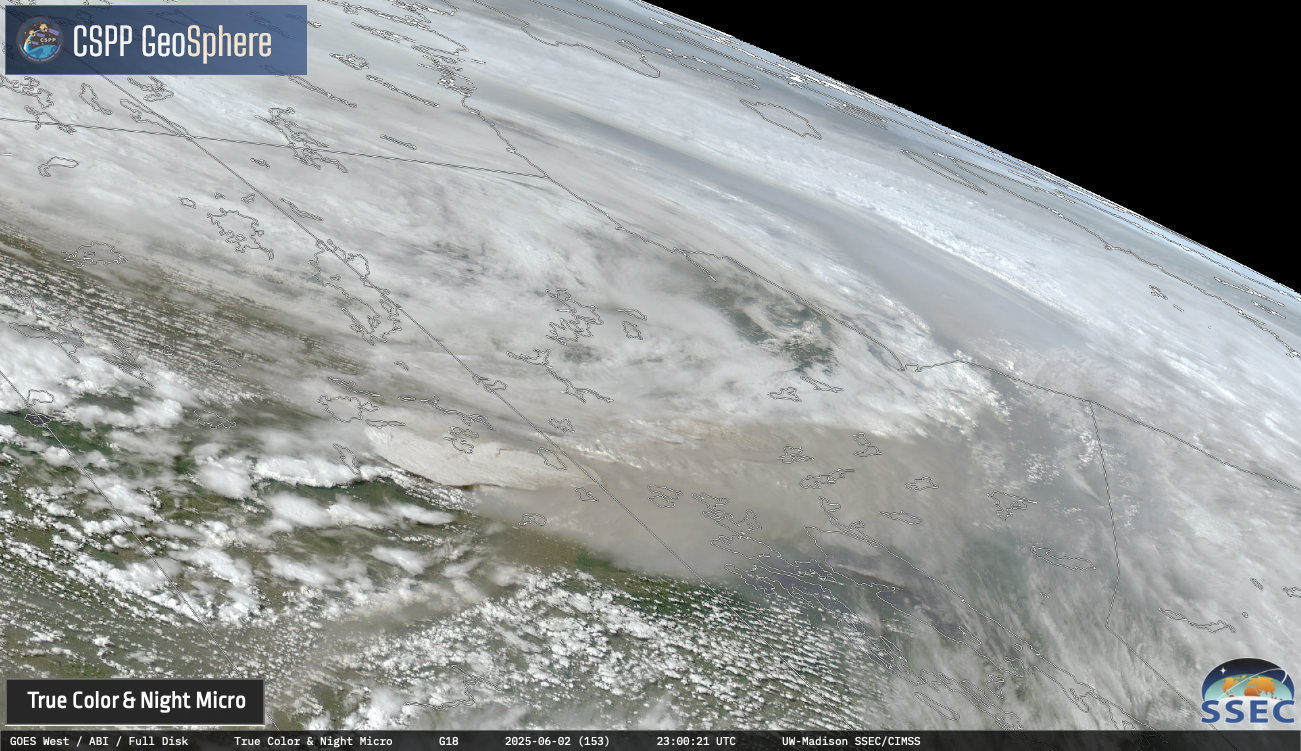
GOES-18 daytime True Color RGB + Nighttime Microphysics RGB images, from 1900 UTC on 02 June to 0850 UTC on 03 June [click to play MP4 animation]
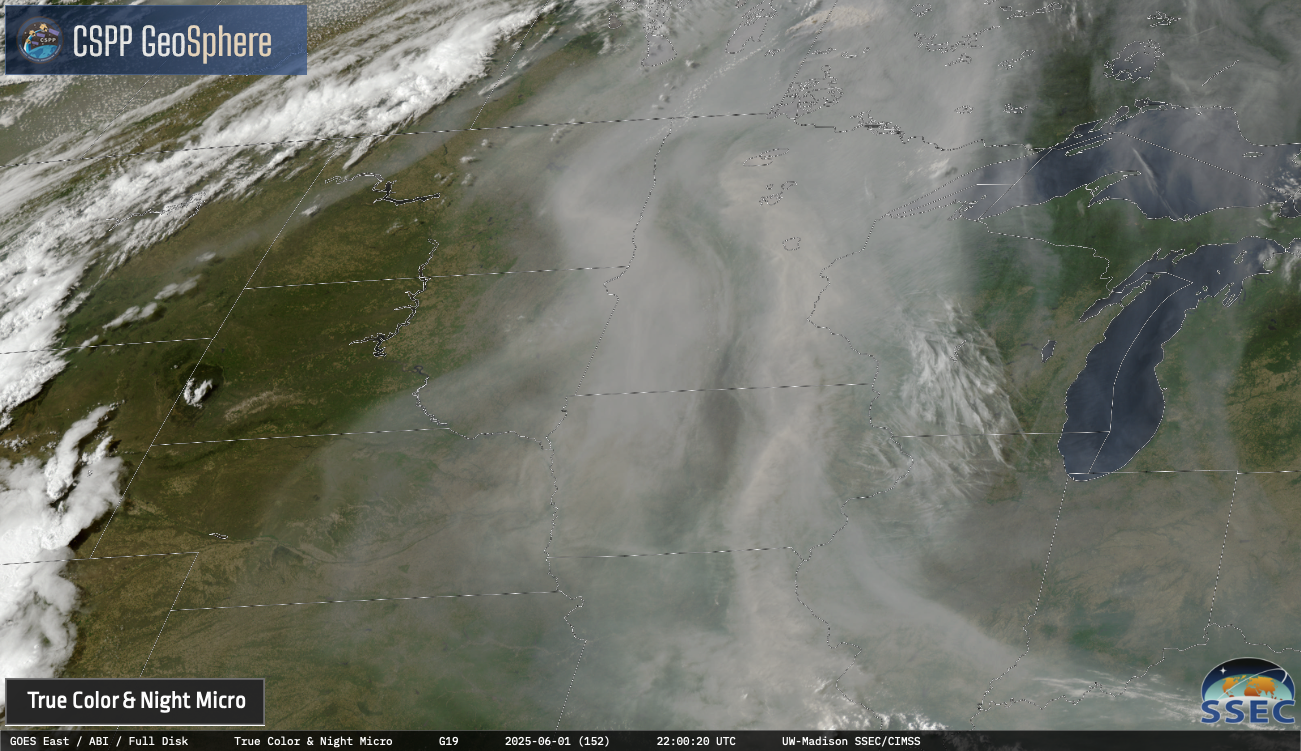
In an animation of GOES-19
(GOES-East) Nighttime Microphysics RGB and daytime True Color RGB images
(below), after sunrise on 03 June the tan-colored mixture of blowing dust and wildfire smoke was seen wrapping northward across eastern Hudson Bay (around the eastern periphery of a large area of low pressure that was centered over the Nunavut/Manitoba border at
12 UTC on 03 June).

GOES-19 daytime True Color RGB + Nighttime Microphysics RGB images, from 0000-2350 UTC on 03 June [click to play MP4 animation]
A toggle between Suomi-NPP and NOAA-20 VIIRS True Color RGB images — visualized using
RealEarth (below) also showed the plume of dust/smoke wrapping cyclonically across Ontario and Hudson Bay on 03 June.
Suomi-NPP and NOAA-20 VIIRS True Color RGB images on 03 June [click to enlarge]
View only this post
Read Less


