Severe weather in Minnesota and Wisconsin
![GOES-16 "Red" Visible (0.64 µm) images, with SPC Storm Reports plotted in red [click to play MP4 animation]](https://cimss.ssec.wisc.edu/satellite-blog/wp-content/uploads/sites/5/2019/07/G16_VIS_MN_WI_19JUL2019_2019200_214215_GOES-16_0001PANEL.GIF)
GOES-16 “Red” Visible (0.64 µm) images, with SPC Storm Reports plotted in red [click to play MP4 animation]
A comparison of GOES-16 “Red” Visible (0.64 µm) and “Clean” Infrared Window (10.35 µm) images (below) revealed cloud-top infrared brightness temperatures as cold as -86ºC over northwestern Wisconsin.
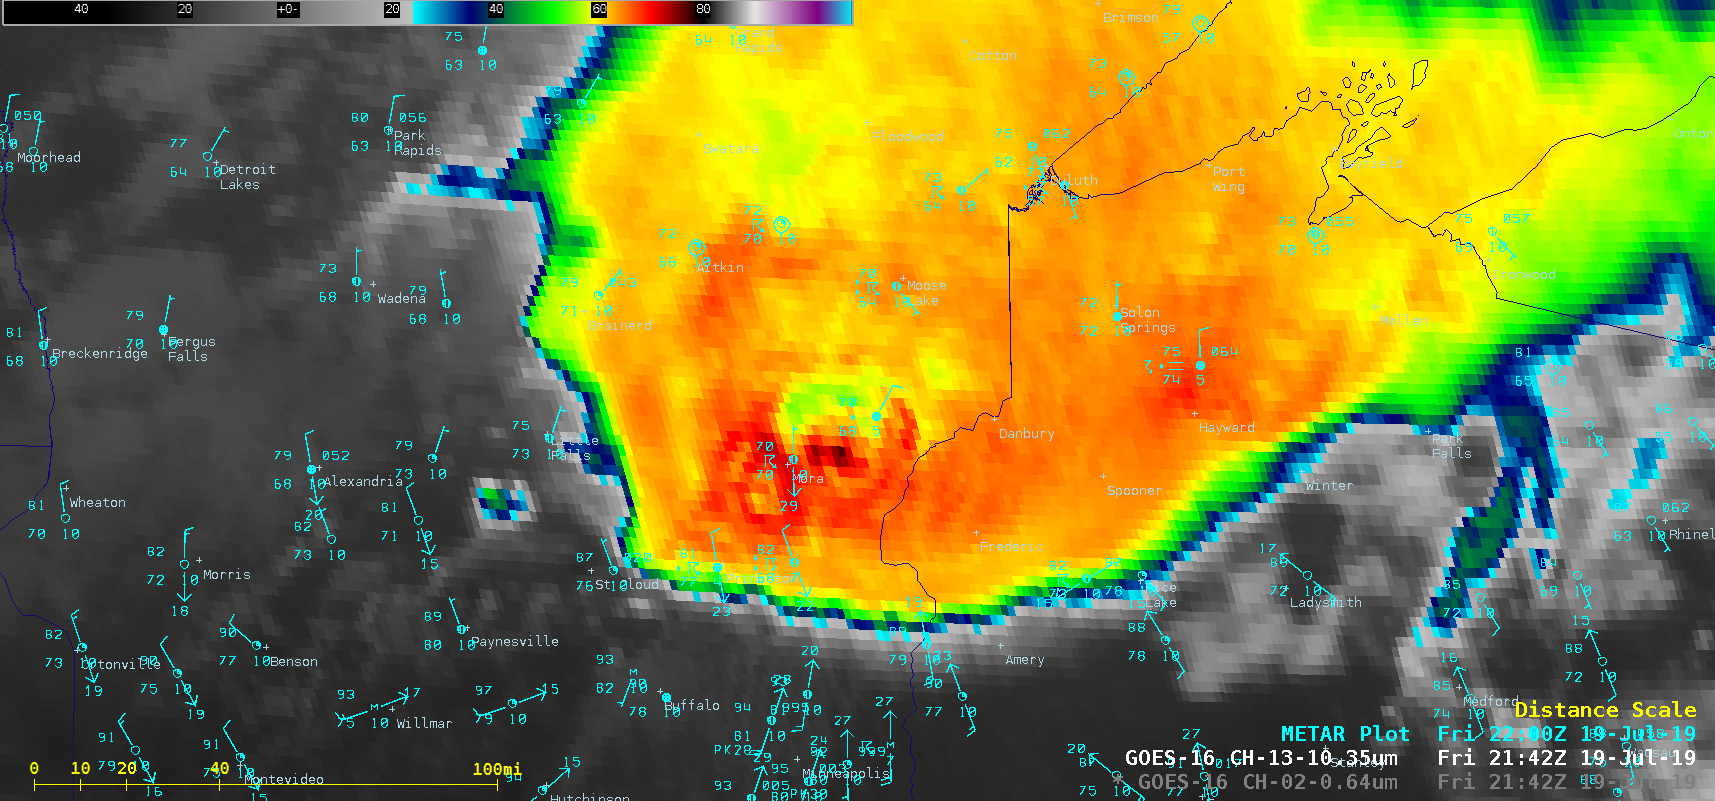
GOES-16 “Red” Visible (0.64 µm) and “Clean” Infrared Window (10.35 µm) images [click to play MP4 animation]

GOES-16 “Clean” Infrared Window (10.35 µm) images, with SPC Storm Reports plotted in cyan [click to play animation | MP4]
===== 22 July Update =====
![Terra MODIS True Color RGB images, 11 July vs 22 July [click to enlarge]](https://cimss.ssec.wisc.edu/satellite-blog/wp-content/uploads/sites/5/2019/07/190711_190722_terra_modis_truecolor_WI_anim.gif)
Terra MODIS True Color RGB images, 11 July vs 22 July [click to enlarge]
![14 July and 22 July Terra MODIS True Color RGB images [click to enlarge]](https://cimss.ssec.wisc.edu/satellite-blog/wp-content/uploads/sites/5/2019/07/190714_190722_modis_truecolor_realearth_anim.gif)
Terra MODIS True Color RGB images, 14 July vs 22 July [click to enlarge]
![Terra MODIS Visible (0.65 µm), Near-Infrared "Snow/Ice" (1.61 µm), Shortwave Infrared (3.7 µm), Land Surface Temperature and Normalized Difference Vegetation Index images on 22 July [click to enlarge]](https://cimss.ssec.wisc.edu/satellite-blog/wp-content/uploads/sites/5/2019/07/190722_1633utc_terra_modis_visible_snowIce_shortwaveInfrared_landSurfaceTemperature_normalizedDifferenceVegetationIndex_WI_anim.gif)
Terra MODIS Visible (0.65 µm), Near-Infrared “Snow/Ice” (1.61 µm), Shortwave Infrared (3.7 µm), Land Surface Temperature and Normalized Difference Vegetation Index images on 22 July [click to enlarge]
![GOES-16 Normalized Difference Vegetation Index images [click to play animation]](https://cimss.ssec.wisc.edu/satellite-blog/wp-content/uploads/sites/5/2019/07/190722_goes16_normalizedDifferenceVegetationIndex_WI_anim.gif)
GOES-16 Normalized Difference Vegetation Index images on 22 July [click to play animation]