Ozone Estimates from NUCAPS
Gridded NUCAPS (from NOAA-20) estimates of total ozone concentration at 1643 and 1653 UTC 11 February 2020 (Click to enlarge)
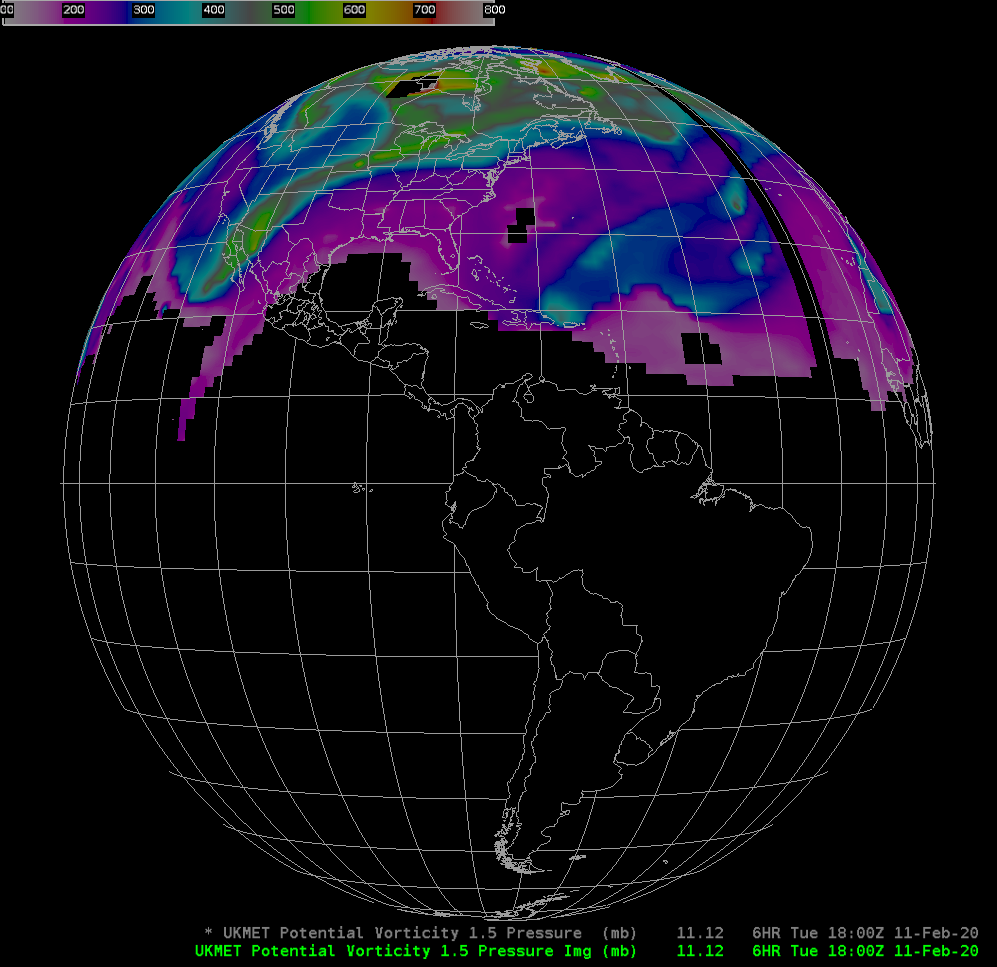
Gridded NOAA-Unique Combined Atmospheric Processing System fields in AWIPS (and elsewhere, such as this excellent site) include retrieved values of ozone (O3), an important gas. In high concentrations in the upper troposphere, O3 is a marker for the presence of stratospheric air. In the animation above, high concentrations of ozone are present over eastern Canada. An earlier pass, shown below in a toggle with GOES-16 ABI Band 13 (10.3 µm, the “clean window”) and with a 6-h forecast of pressure on the 1.5 PVU surface (the forecast from the UK Met Office Global Model) shows a cold enhancement on the poleward side of the cold front draped across the North Atlantic, and a southward tropospheric intrusion of the stratosphere as visualized by the higher pressure on the 1.5 PVU surface. That is to say, there is a dynamic response in the atmosphere to the intrusion of stratospheric air (with higher ozone) into the troposphere.

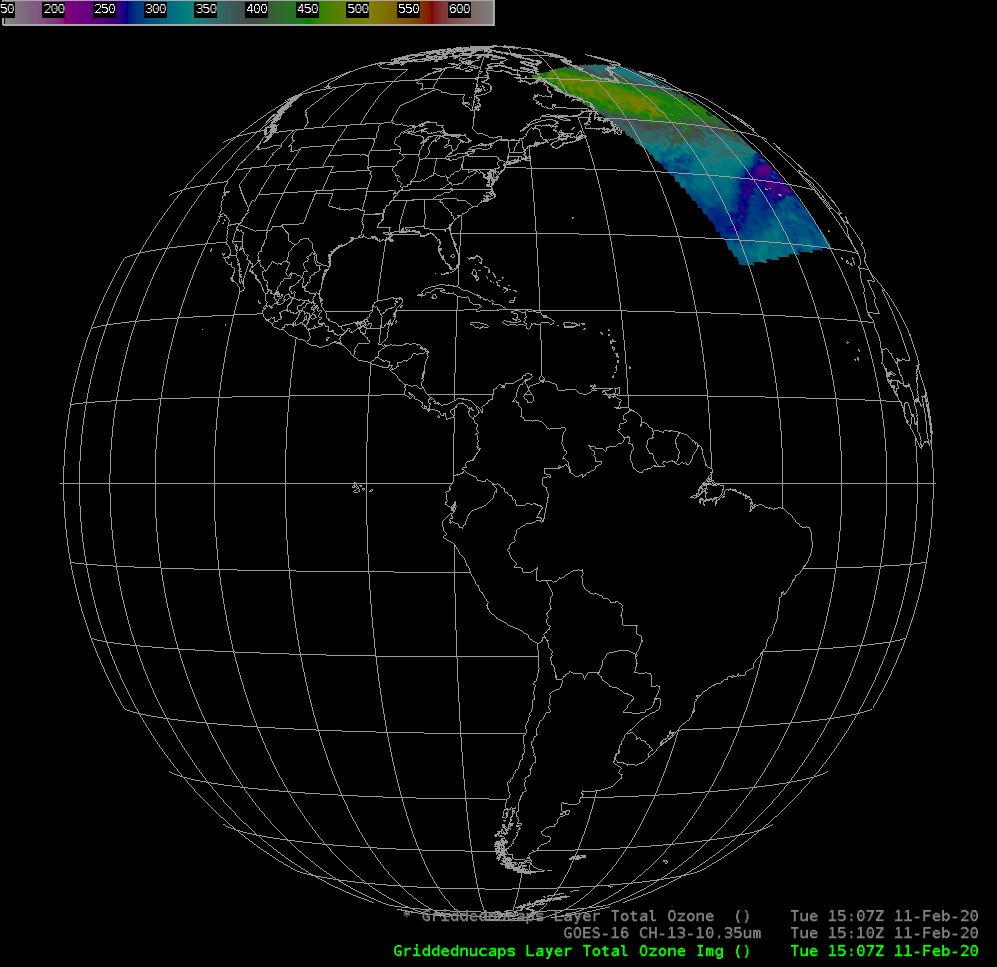
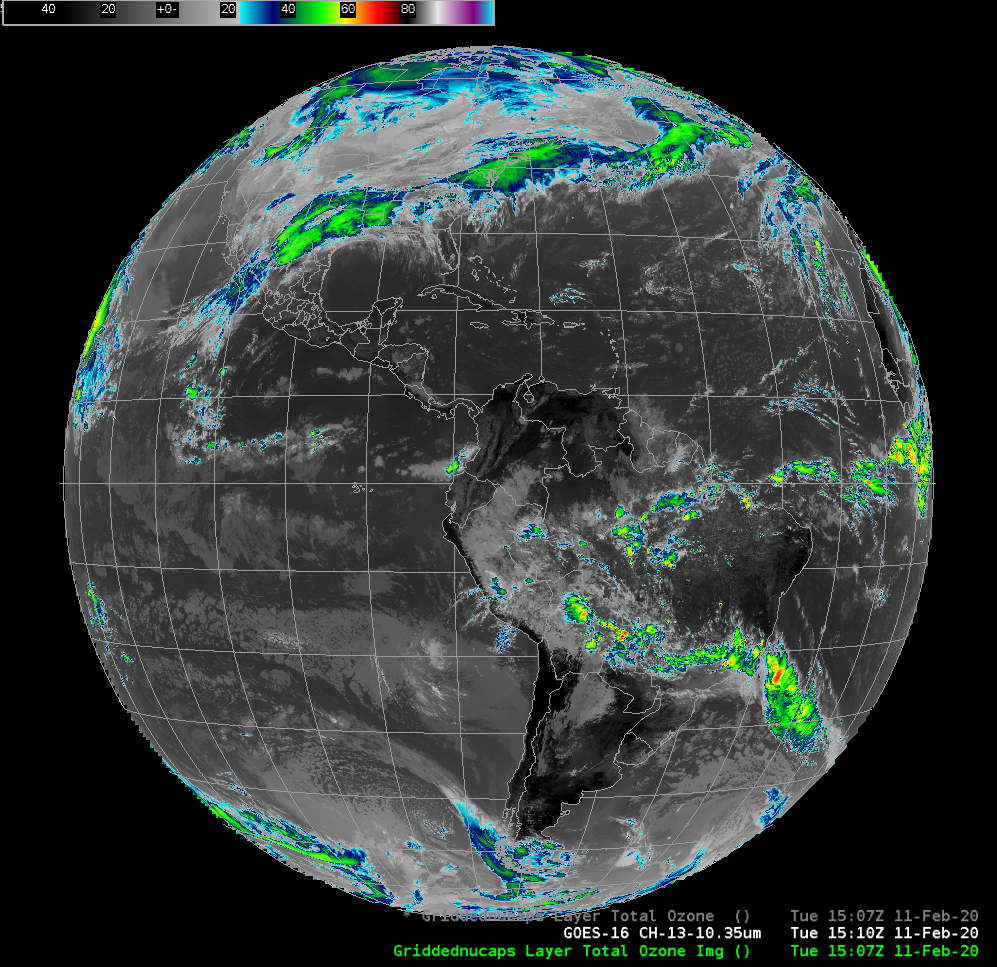
GOES-16 ABI Band 13 (10.3 µm), NUCAPS Ozone (both at 1500 UTC 11 February), and Forecast Temperature on the 1.5 PVU Surface (at 1800 UTC) from the UKMet Office Global Model (Click to enlarge)
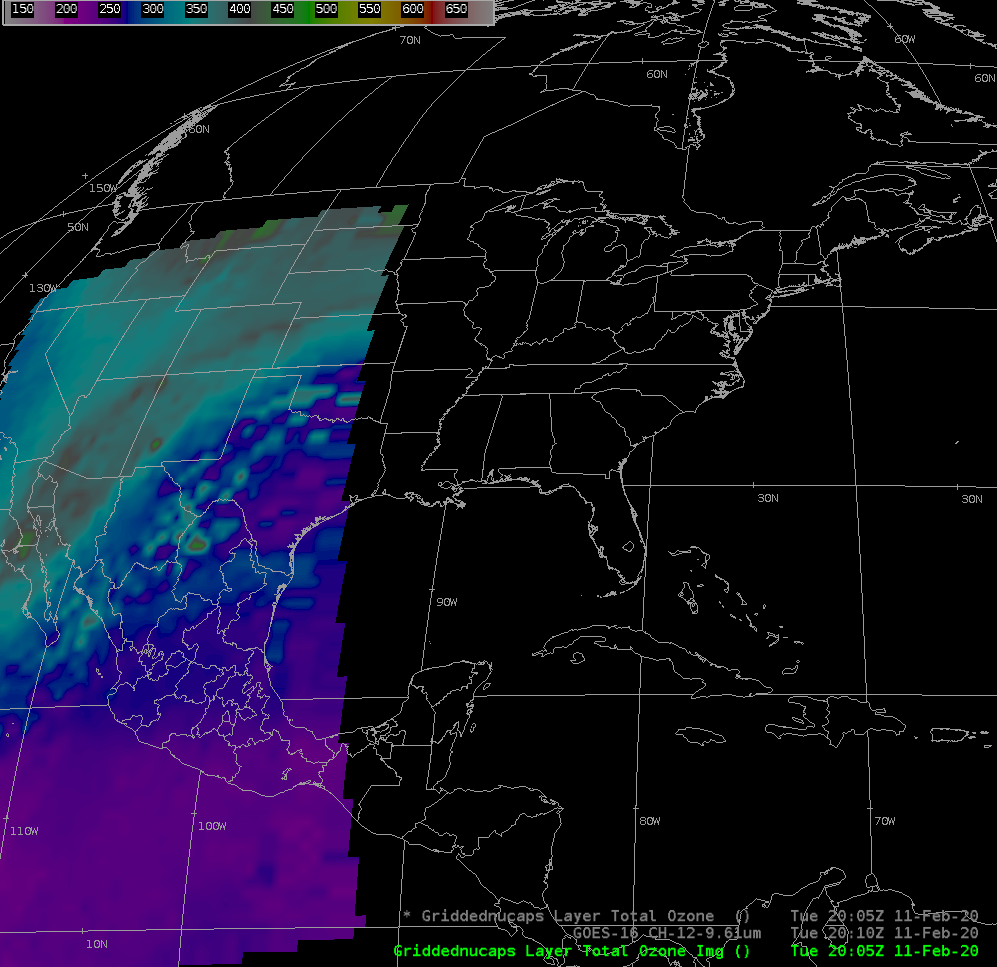
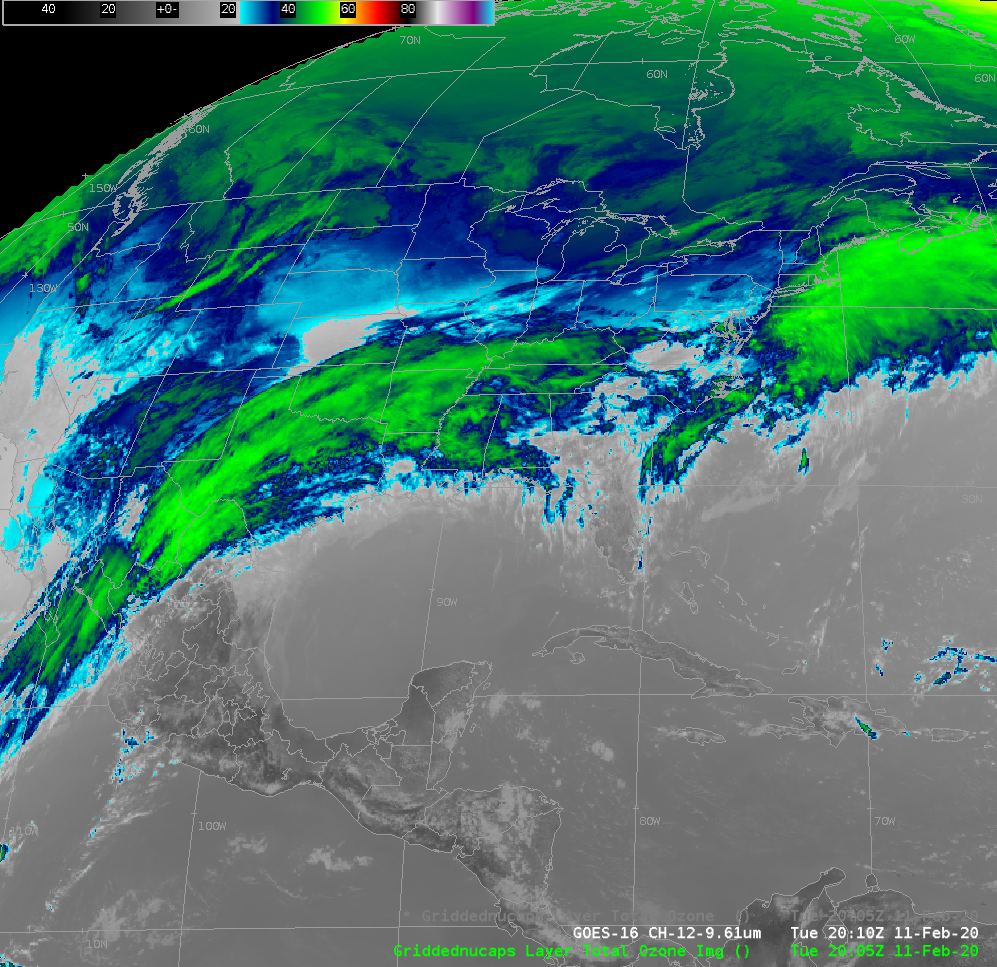
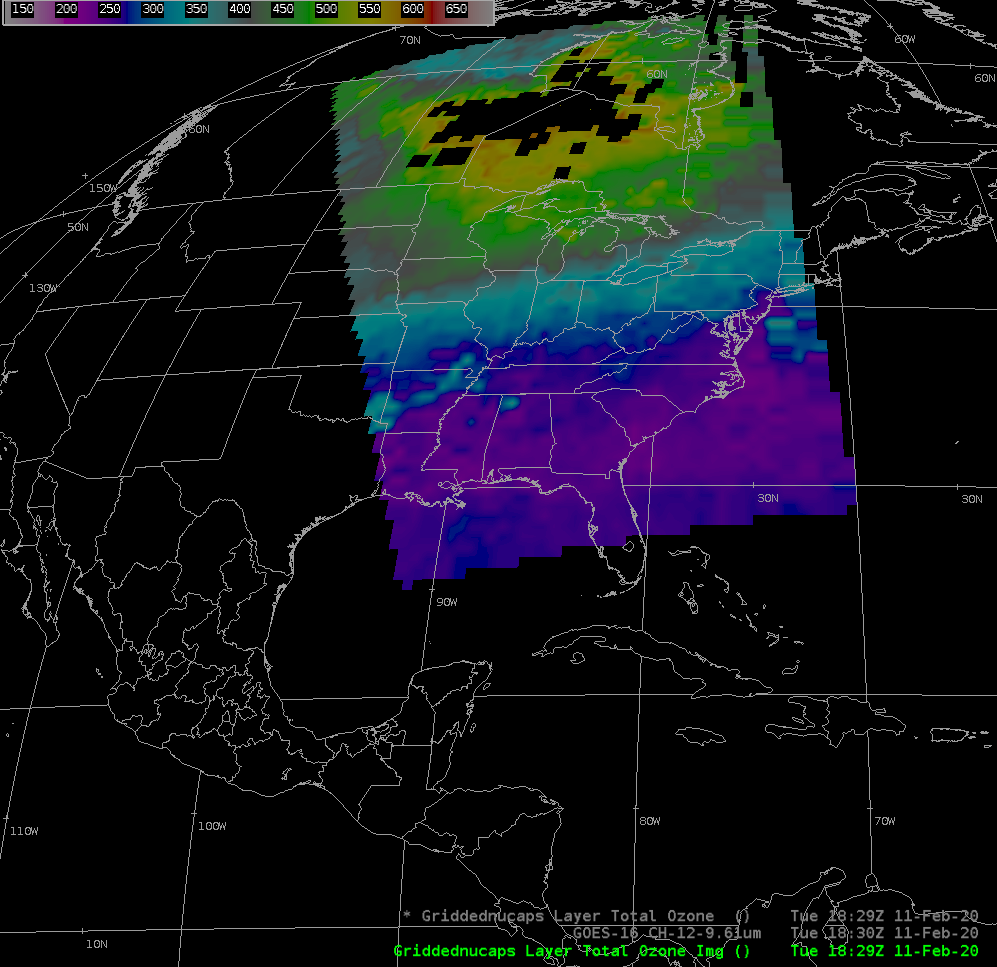
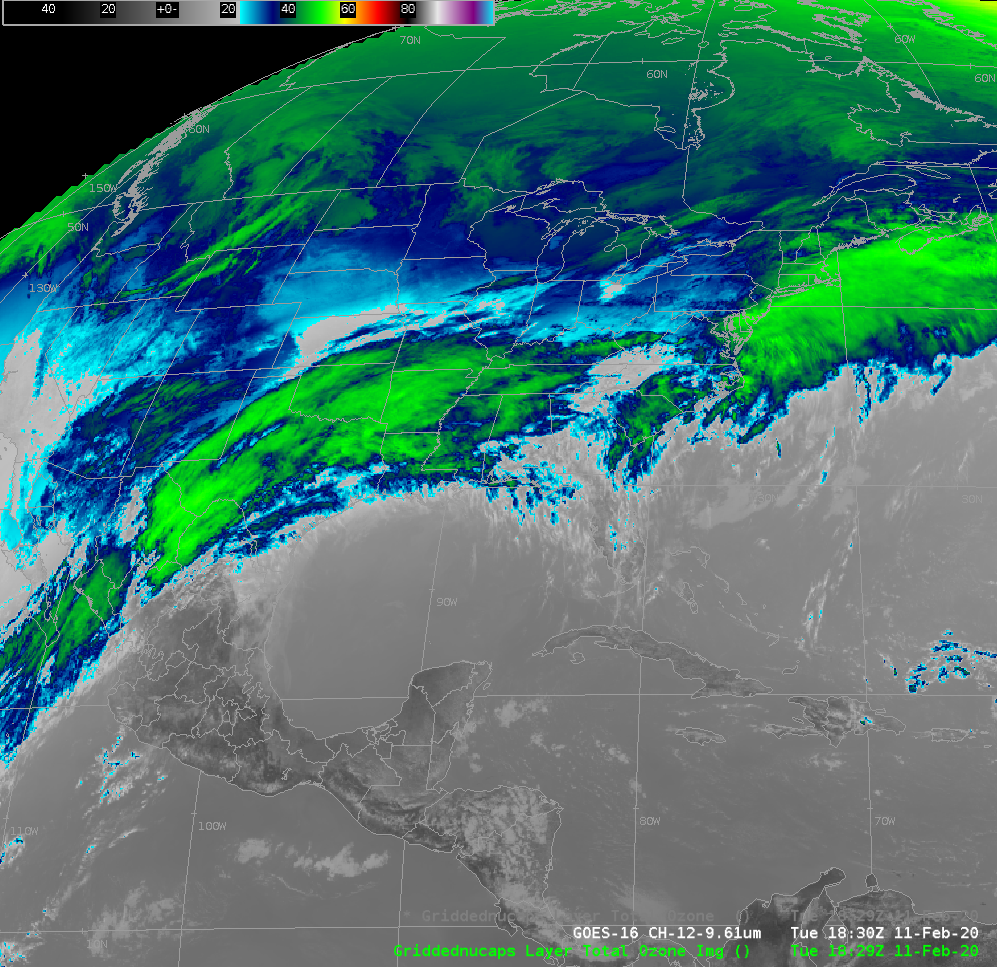
Can you use the Ozone Band — Band 12 on the ABI, at 9.61 µm, to estimate where high ozone concentrations exist in the atmosphere? The short answer to this is “No” — at least if you’re using just the 9.61 µm band. Compare the retrieved and gridded values below from NUCAPS with the Band 12 brightness temperature; it is difficult to make a claim that this single ABI band gives useable information in the detection of ozone.
Gridded NUCAPS estimates of Ozone, and the Band 12 “Ozone” band (9.61 µm) at 1650 UTC on 11 February 2020 (Click to enlarge)
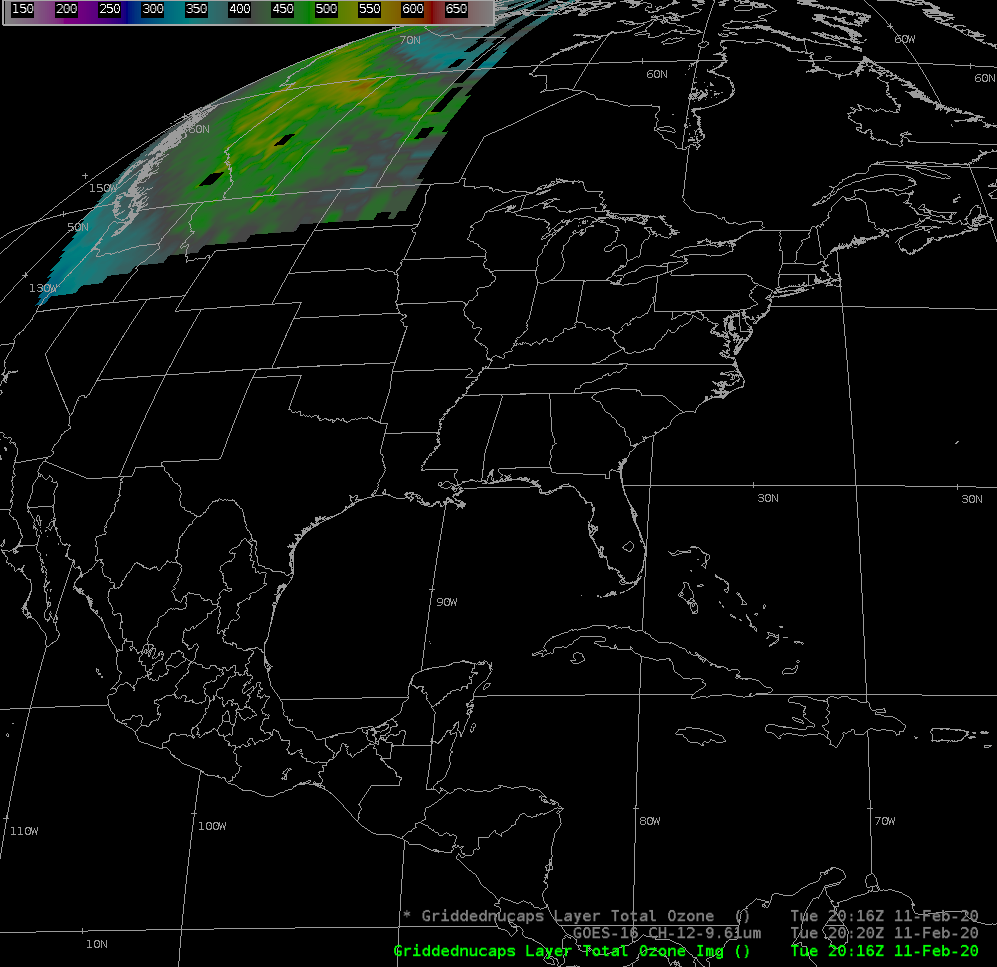
At later overpass, over the western United States, leads to a similar conclusion: Gridded NUCAPS Ozone values can highlight lower tropopauses upstream of developing storms (in this case on 11 February, over the southwestern United States); Band 12 Ozone fields do not highlight stratospheric intrusions.

Gridded NUCAPS estimates of Ozone, and the Band 12 “Ozone” band (9.61 µm) at 2005 UTC on 11 February 2020 (Click to enlarge)
Some other examples from 11 February: over Southwestern Canada (toggle from 2016 UTC, Gridded NUCAPS Ozone, ABI Band 12); over the central United States (toggle from 1829 UTC, Gridded NUCAPS Ozone, ABI Band 12).