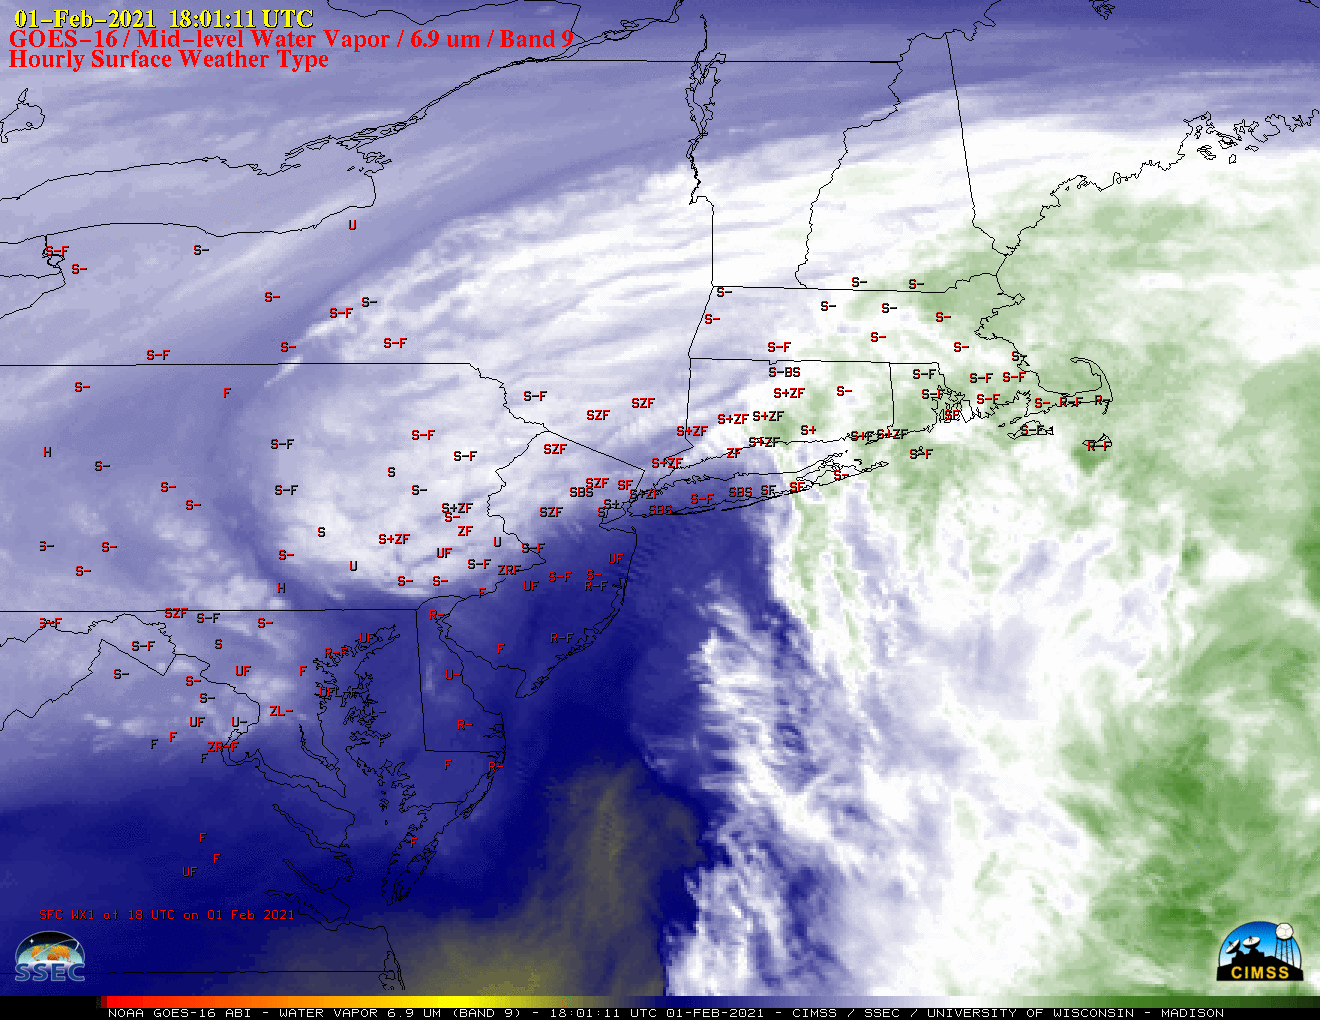
![GOES-16 Mid-level Water Vapor (6.9 µm) images, with plots of hourly surface weather type [click to play animation | MP4]](https://cimss.ssec.wisc.edu/satellite-blog/images/2021/02/210201_goes16_waterVapor_precipType_Northeast_US_anim.gif)
GOES-16 Mid-level Water Vapor (6.9 µm) images, with hourly surface weather type plotted in red [click to play animation | MP4]
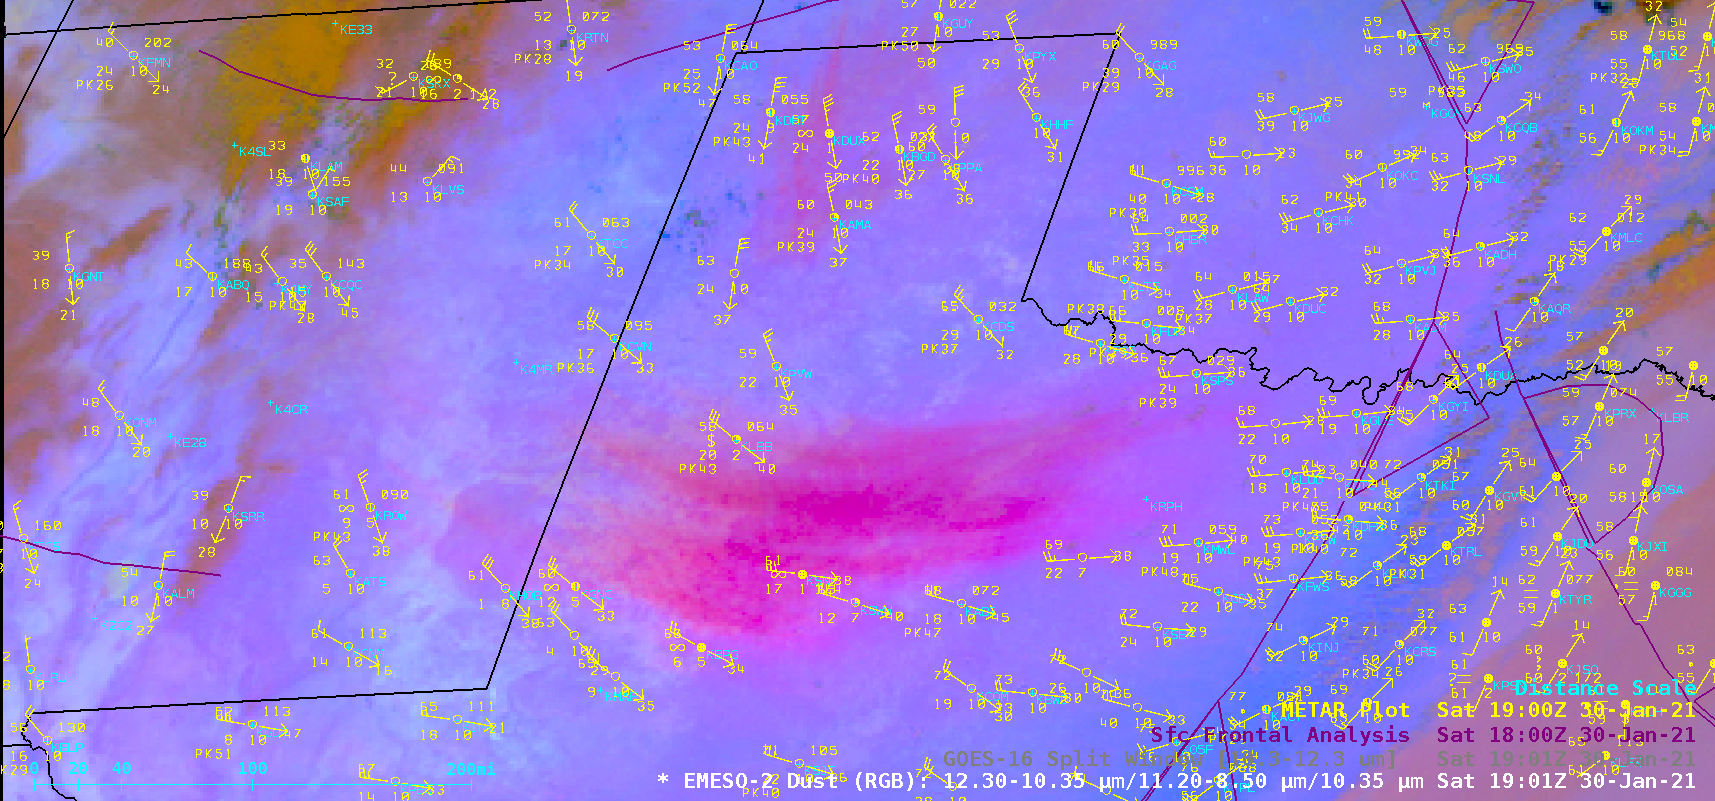
Another feature that played an important role in enhancing/prolonging heavy snowfall rates was a TROWAL — appearing as a tongue of higher Equivalent Potential Temperature within the 850-700 hPa layer, just north of the surface occluded front — moving inland and feeding moisture into the southern edge of the cold conveyor belt seen on GOES-16 Water Vapor imagery (below).
![GOES-16 Mid-level Water Vapor (6.9 µm) images, with contours of 850-700 hPa layer Equivalent Potential Temperature (red) and Surface Fronts (purple) [click to play animation | MP4]](https://cimss.ssec.wisc.edu/satellite-blog/images/2021/02/210201_goes16_waterVapor_trowal_Northeast_US_anim.gif)
GOES-16 Mid-level Water Vapor (6.9 µm) images, with contours of 850-700 hPa layer Equivalent Potential Temperature (red) and Surface Frontal Analysis (purple) [click to play animation | MP4]
Updated January 30-February 2 snowfall reports based on reports received as of 6 pm Tuesday. Here are the latest highest totals in each state (1 of 2).
PA – Nazareth 36.1″
NJ – Mount Arlington 35.5″
NY – Fishkill/Saugerties 25.6″
MA – Lowell 24″
WV – Terra Alta 22.1″ pic.twitter.com/unxodO5ccS— NWS Eastern Region (@NWSEastern) February 2, 2021
1-minute Mesoscale Domain Sector GOES-16 “Red” Visible (0.64 µm) images with 5-minute plots of Derived Motion Winds (below) revealed a mesoscale circulation just south-southwest of the analyzed location of the surface low — the majority of these wind vectors had height assignments within the 900-990 hPa range, indicating that the circulation was located above the surface. The highest DMW speed was 36 knots.
![GOES-16 "Red" Visible (0.6 µm) images, with plots of Derived Motion Winds [click to play animation | MP4]](https://cimss.ssec.wisc.edu/satellite-blog/images/2021/02/210202_goes16_visible_derivedMotionWinds_NortheastUS_low_anim.gif)
GOES-16 “Red” Visible (0.6 µm) images, with plots of Derived Motion Winds [click to play animation | MP4]
View only this post Read Less
![GOES-16 True Color RGB images [click to play animation | MP4]](https://cimss.ssec.wisc.edu/satellite-blog/images/2021/01/210130_goes16_trueColorRGB_NM_TX_anim.gif)
![GOES-16 Dust RGB and Split Window Difference (10.3 µm – 12.3 µm) images [click to play animation | MP4]](https://cimss.ssec.wisc.edu/satellite-blog/images/2021/01/210130_goes16_dustRGB_splitWindowDifference_NM_TX_blowing_dust_anim.gif)

![GOES-16 Mid-level Water Vapor (6.9 µm) images, with plots of hourly surface weather type [click to play animation | MP4]](https://cimss.ssec.wisc.edu/satellite-blog/images/2021/01/210128_goes16_waterVapor_precipitationType_VA_NC_anim.gif)
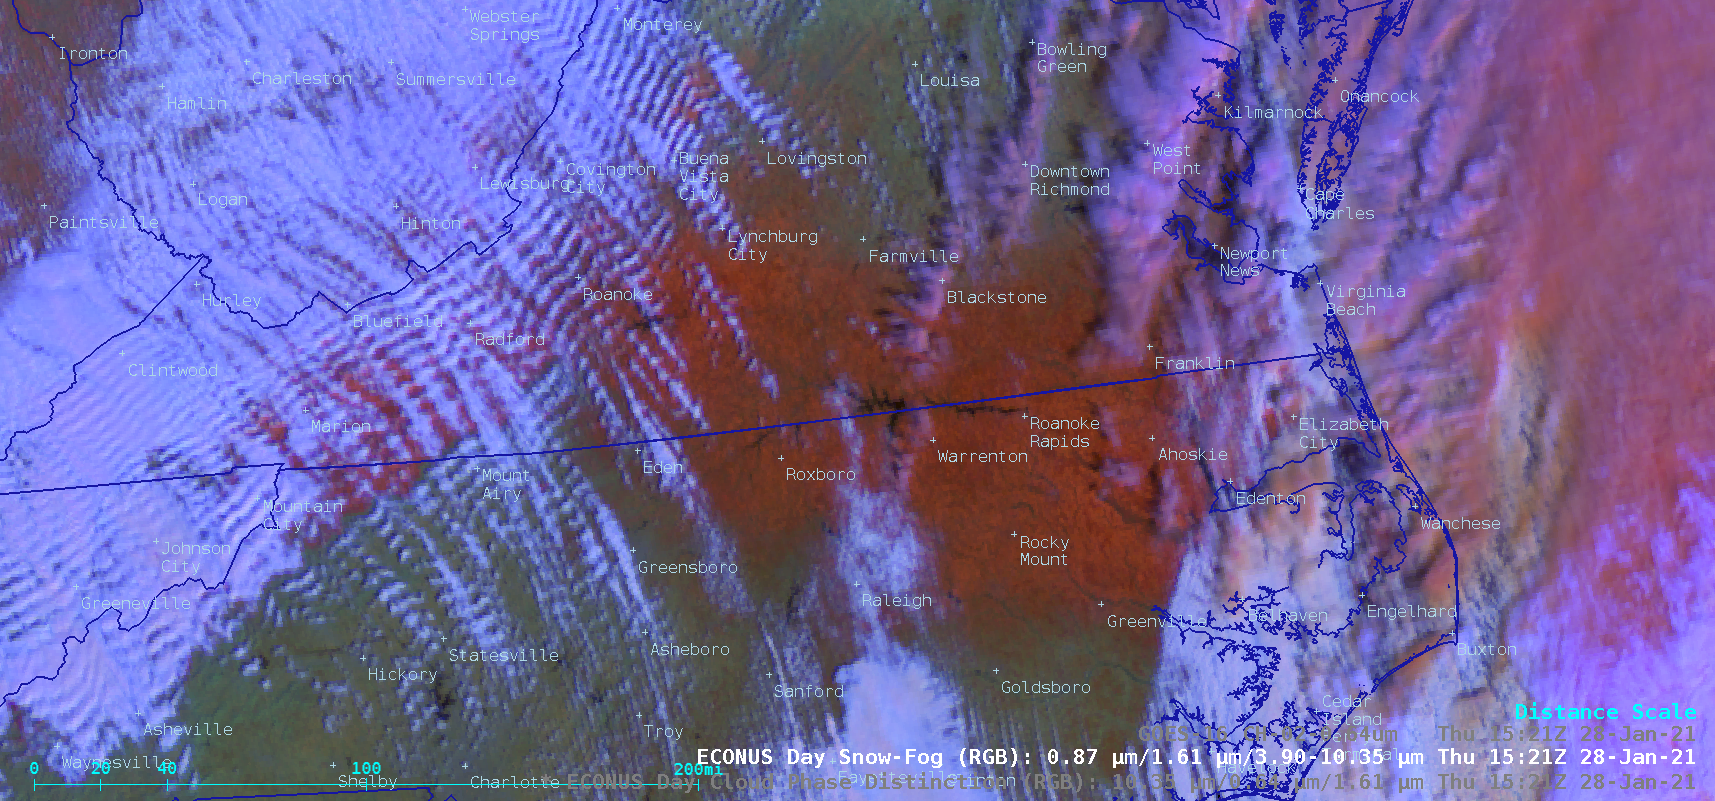
![GOES-16 "Red" Visible (0.64 µm), Day Snow-Fog RGB and Day Cloud Phase Distinction RGB images [click to play animation | MP4]](https://cimss.ssec.wisc.edu/satellite-blog/images/2021/01/210128_goes16_visible_daySnowFogRGB_dayCloudPhaseDistinctionRGB_VA_NC_snow_cover_anim.gif)
![Suomi NPP VIIRS True Color and False Color images at 1732 UTC [click to enlarge]](https://cimss.ssec.wisc.edu/satellite-blog/images/2021/01/210128_1732utc_suomiNPP_viirs_trueColorRGB_falseColorRGB_VA_NC_snow_cover_anim.gif)
