![GOES-16 Day Cloud Phase Distinction RGB images [click to play animation | MP4]](https://cimss.ssec.wisc.edu/satellite-blog/images/2021/02/210215_goes16_dayCloudPhaseDistinctionRGB_OK_TX_snow_cover_anim.gif)
GOES-16 Day Cloud Phase Distinction RGB images [click to play animation | MP4]
As the Arctic chill continues to grapple the Plains, numerous new record lows were established this morning. Many of these locations will experience even lower temperatures by Tuesday morning, with additional record lows expected. pic.twitter.com/w3QifTxQkU
— NWS Weather Prediction Center (@NWSWPC) February 15, 2021
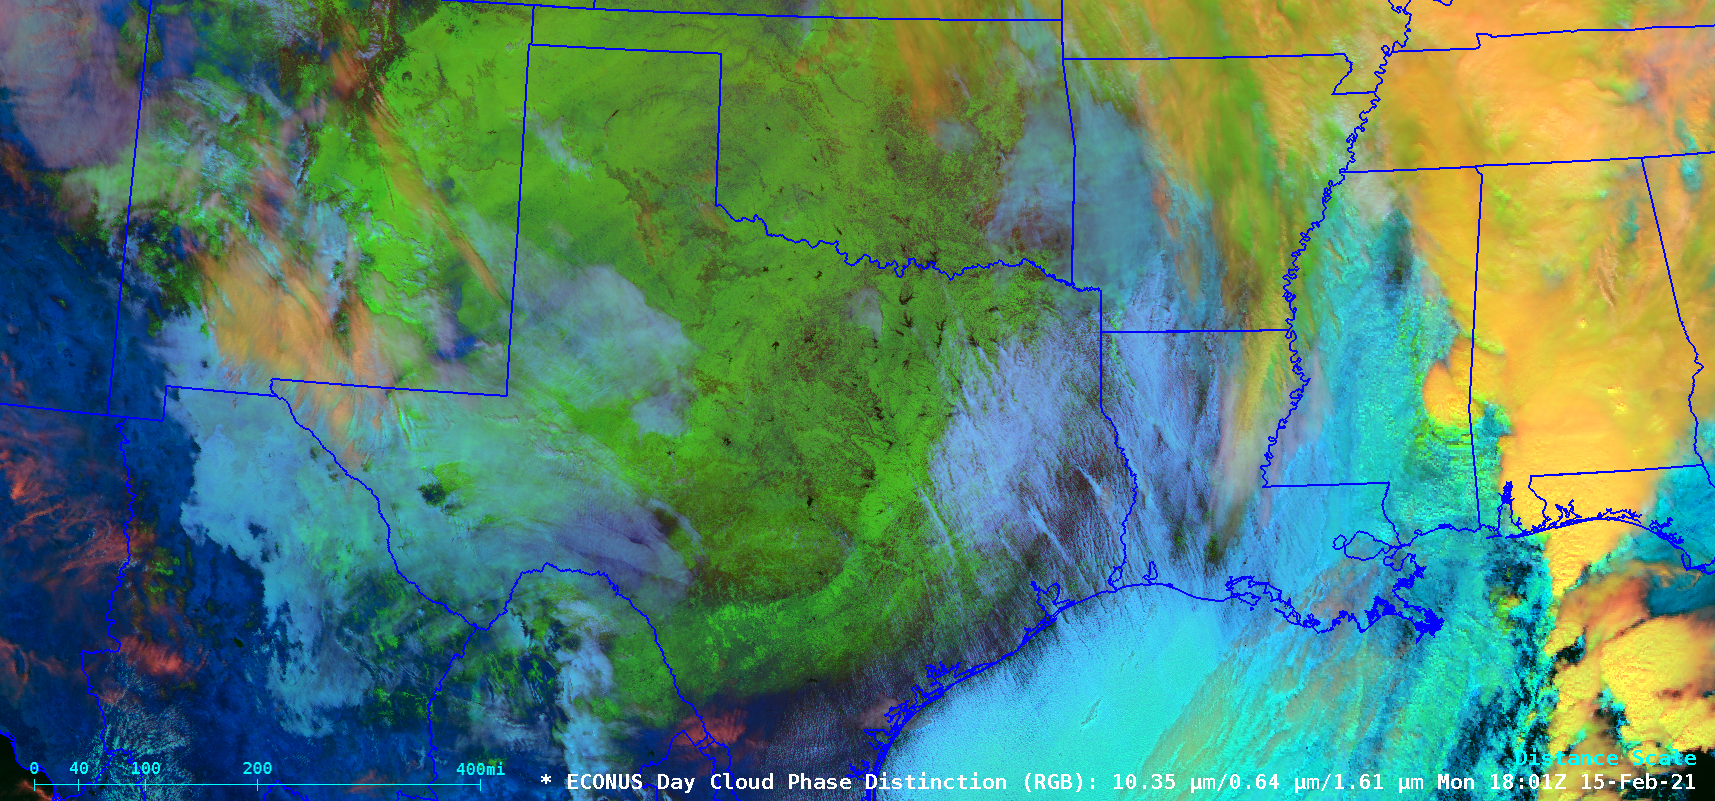
A closer view of GOES-16 Day Cloud Phase Distinction RGB images (below) showed the far southern extent of snow cover across northern Mexico and southern Texas. Precipitation briefly transitioned from rain to snow as far south as Brownsville, but there was no accumulation at that site.
![GOES-16 Day Cloud Phase Distinction RGB images [click to play animation | MP4]](https://cimss.ssec.wisc.edu/satellite-blog/images/2021/02/210215_goes16_dayCloudPhaseDistinctionRGB_TX_snow_cover_anim.gif)
GOES-16 Day Cloud Phase Distinction RGB images [click to play animation | MP4]
![GOES-16 Near-Infrared “Snow/Ice” (1.61 µm) images, with and without plots of surface reports [click to play animation | MP4]](https://cimss.ssec.wisc.edu/satellite-blog/images/2021/02/210215_goes16_nearInfraredSnowIce_TX_anim.gif)
GOES-16 Near-Infrared “Snow/Ice” (1.61 µm) images, with and without plots of surface reports [click to play animation | MP4]
![GOES-16 Near-Infrared “Snow/Ice” (1.61 µm) images [click to play animation | MP4]](https://cimss.ssec.wisc.edu/satellite-blog/images/2021/02/210215_goes16_nearInfraredSnowIce_KAMA_plume_anim.gif)
GOES-16 Near-Infrared “Snow/Ice” (1.61 µm) images [click to play animation | MP4]
![Landsat-8 False Color RGB image [click to enlarge]](https://cimss.ssec.wisc.edu/satellite-blog/images/2021/02/210215_1721utc_landsat8_falseColorRGB_KAMA_plume_anim.gif)
Landsat-8 False Color RGB image [click to enlarge]
===== 16 February Update =====
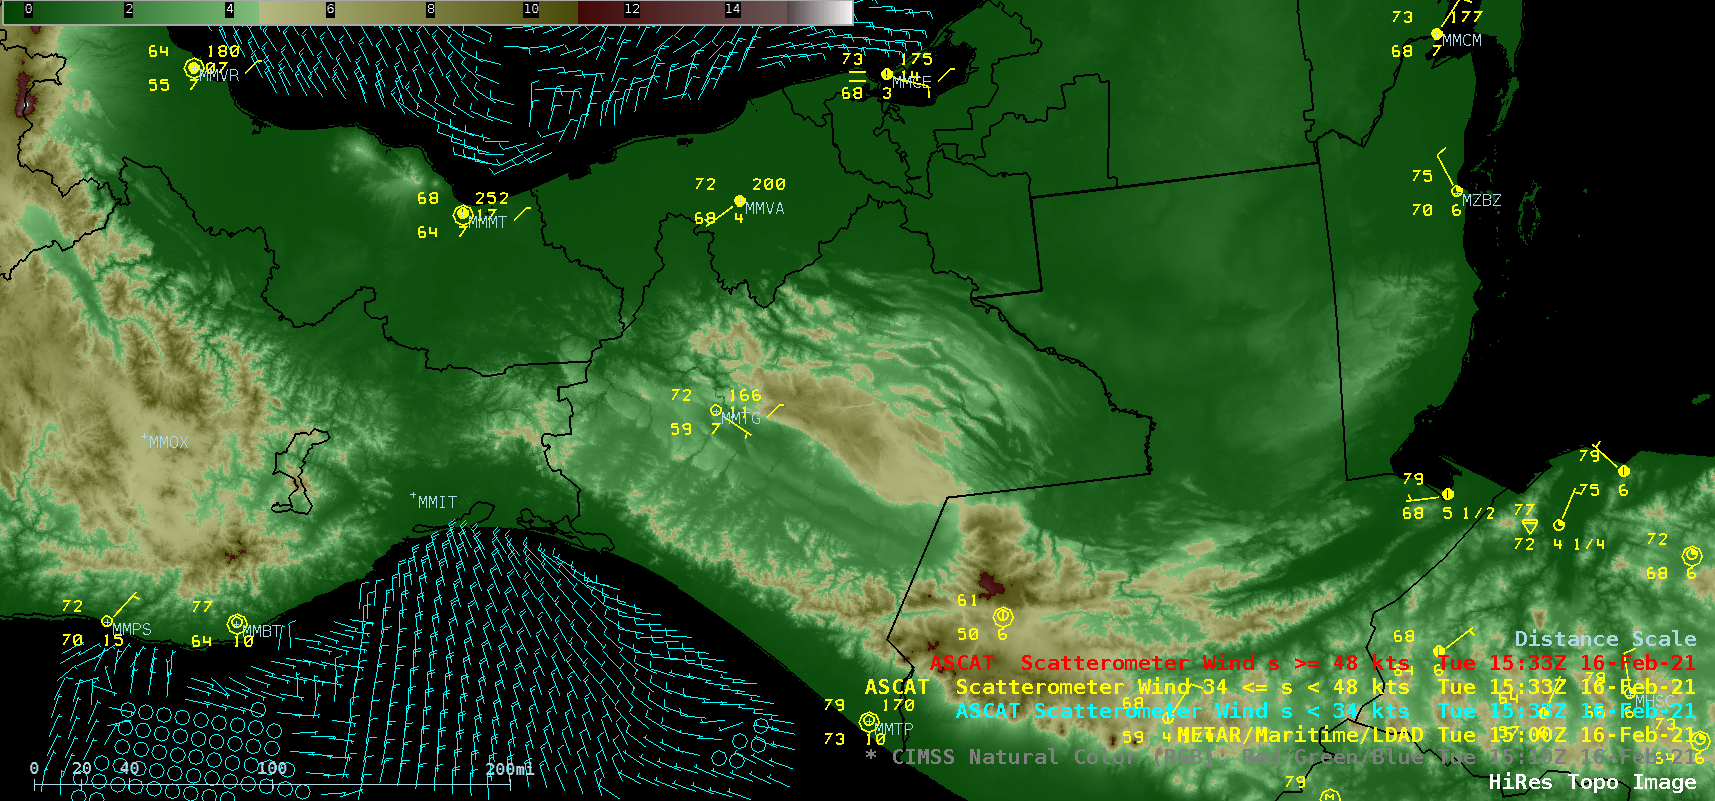
![GOES-16 CIMSS Natural Color RGB images, with plots of Metop-A ASCAT winds and surface/ship reports [click to play animation | MP4]](https://cimss.ssec.wisc.edu/satellite-blog/images/2021/02/210216_goes16_cimssNaturalColorRGB_ascat_Tehuano_anim.gif)
GOES-16 CIMSS Natural Color RGB images, with plots of Metop-A ASCAT winds and surface/ship reports [click to play animation | MP4]
With a low sun angle maximizing forward scattering, a plume of blowing dust could be seen right after sunrise in GOES-17 (GOES-West) True Color RGB images created using Geo2Grid (below), moving southward across the Gulf of Tehuantepec.
![GOES-17 True Color RGB images [click to play animation | MP4]](https://cimss.ssec.wisc.edu/satellite-blog/images/2021/02/210216_goes17_trueColorRGB_Tehuano_anim.gif)
GOES-17 True Color RGB images [click to play animation | MP4]
? Starting a thread with records, stats, and other superlatives from the mid-February winter weather blitz. This may not be everything — there’s too much going on! — but these are the things that I’ve noticed. ?????
— Alex Lamers (@AlexJLamers) February 17, 2021
View only this post Read Less

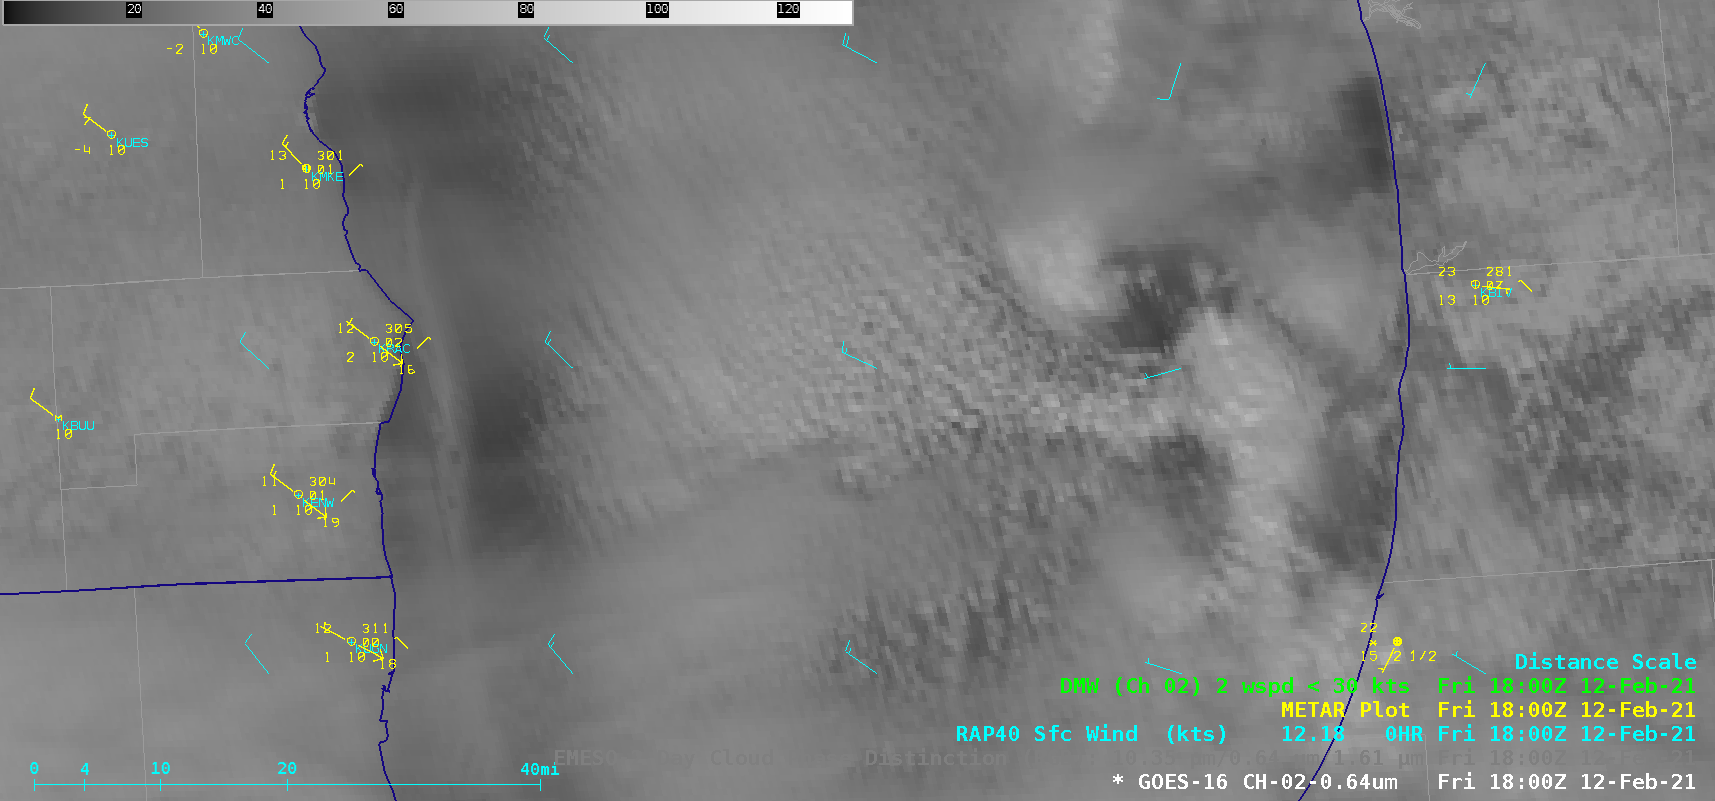

![GOES-16 "Red" Visible (0.64 µm) and Day Cloud Phase Discrimination RGB images at 1800 UTC [click to enlarge]](https://cimss.ssec.wisc.edu/satellite-blog/images/2021/02/210212_1800utc_visible_dayCloudPhaseDiscriminationRGB_Lake_Michigan_mesovortex_anim.gif)


