
GOES-17 (GOES-West) “Ozone” (9.61 µm) images (above) revealed waves propagating northwestward over northern Alaska, northern Yukon and the adjacent Beaufort Sea during the pre-dawn hours on 27 March 2020. That area was too illuminated by either aurora borealis or the rising sun — so Suomi NPP VIIRS Day/Night Band (0.7 µm) imagery could not confirm... Read More
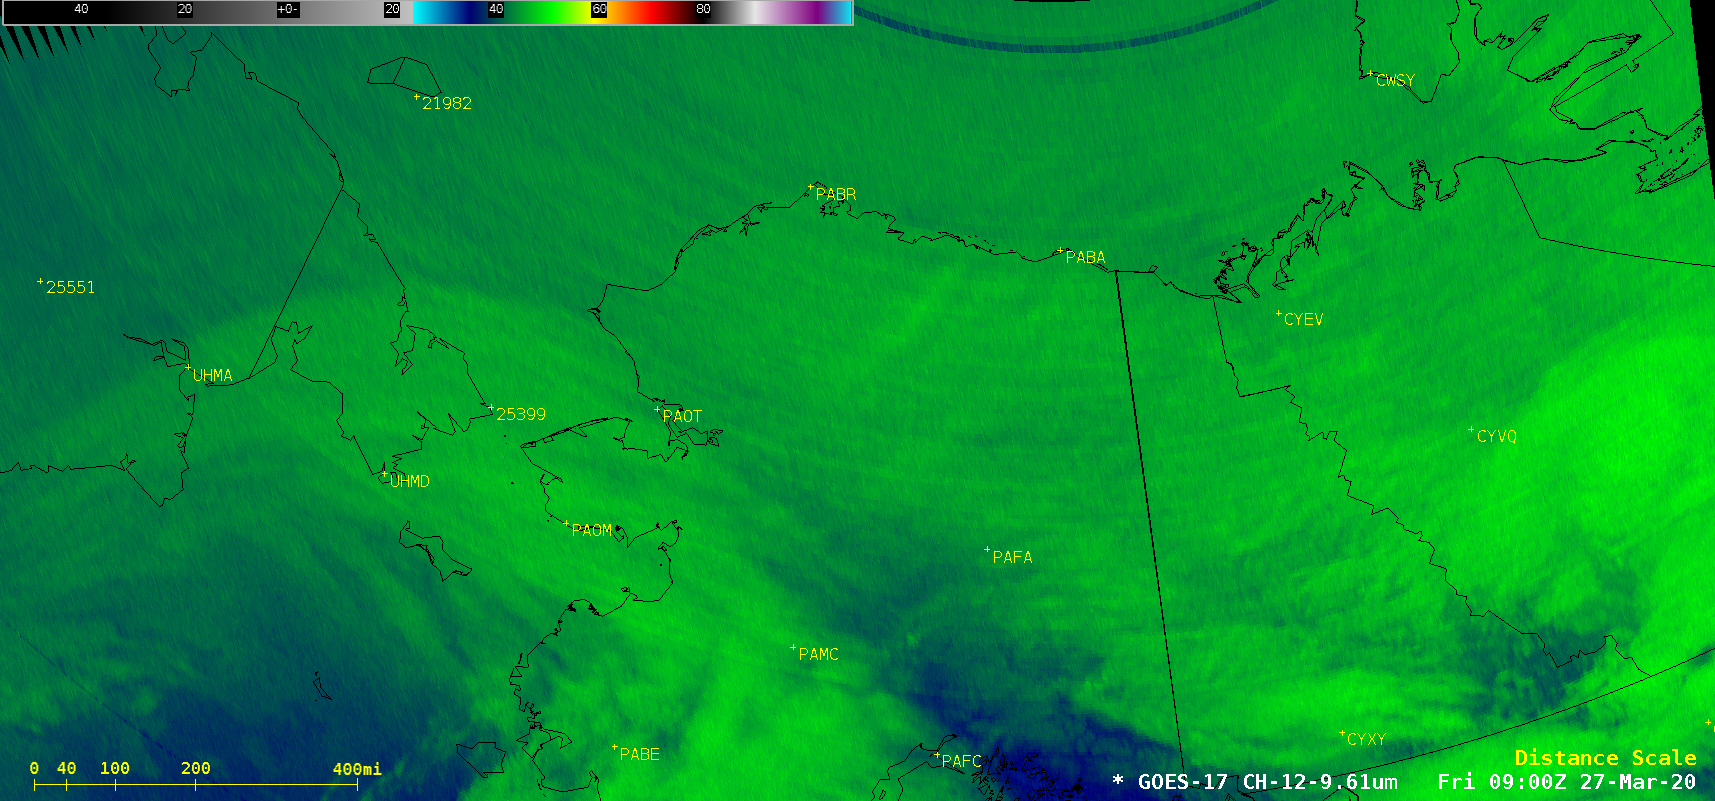
GOES-17 “Ozone” (9.61 µm) images, with rawinsonde sites plotted in yellow [click to play animation | MP4]
GOES-17
(GOES-West) “Ozone” (
9.61 µm) images
(above) revealed waves propagating northwestward over northern Alaska, northern Yukon and the adjacent Beaufort Sea during the pre-dawn hours on 27 March 2020. That area was too illuminated by either aurora borealis or the rising sun — so Suomi NPP VIIRS
Day/Night Band (0.7 µm) imagery could not confirm the presence of mesospheric airglow waves (see
this blog post for some examples).
A plot of the GOES-17 “Ozone” spectral band weighting function — calculated using 12 UTC rawinsonde data from Fairbanks, Alaska — showed a peak contribution from within the stratosphere at the 39 hPa pressure level, corresponding to an altitude around 21 km (below).
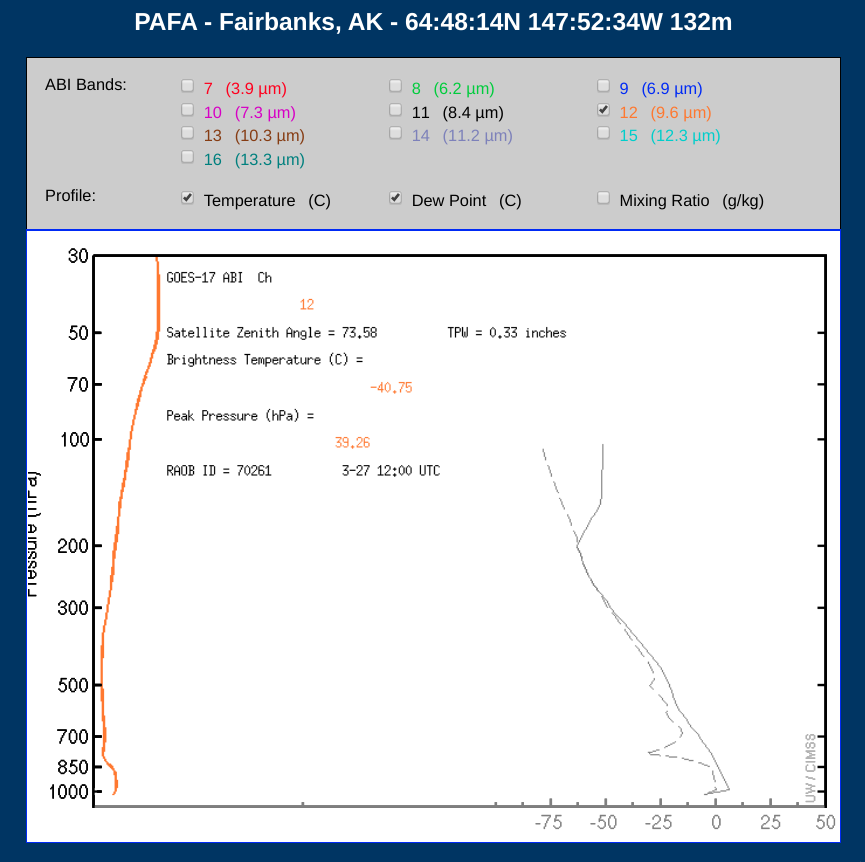
Plot of GOES-17 “Ozone” (9.61 um) weighting function, calculated using 12 UTC rawinsonde data from Fairbanks, Alaska [click to enlarge]
The curious aspect of these waves was their northwestward propagation — rawinsonde data from 3 sites across the region
(below) indicated that the winds aloft within the upper troposphere and throughout the stratosphere were strong northwesterly, which meant the waves were moving
against the ambient flow. Lacking a coherent, science-based explanation for these wave features, this blog post earns its place in the “What the heck is this?” category.
![Plots of rawinsonde data from Fairbanks, Alaska [click to enlarge]](https://cimss.ssec.wisc.edu/satellite-blog/images/2020/03/200327_PAFA_RAOBS.GIF)
Plots of rawinsonde data from Fairbanks, Alaska [click to enlarge]
![Plots of rawinsonde data from Utqiagvik (formerly Barrow), Alaska [click to enlarge]](https://cimss.ssec.wisc.edu/satellite-blog/images/2020/03/200327_PABR_RAOBS.GIF)
Plots of rawinsonde data from Utqiagvik (formerly Barrow), Alaska [click to enlarge]
![Plots of rawinsonde data from Inuvik, Northwest Territories [click to enlarge]](https://cimss.ssec.wisc.edu/satellite-blog/images/2020/03/200327_CYEV_RAOBS.GIF)
Plots of rawinsonde data from Inuvik, Northwest Territories [click to enlarge]
View only this post
Read Less
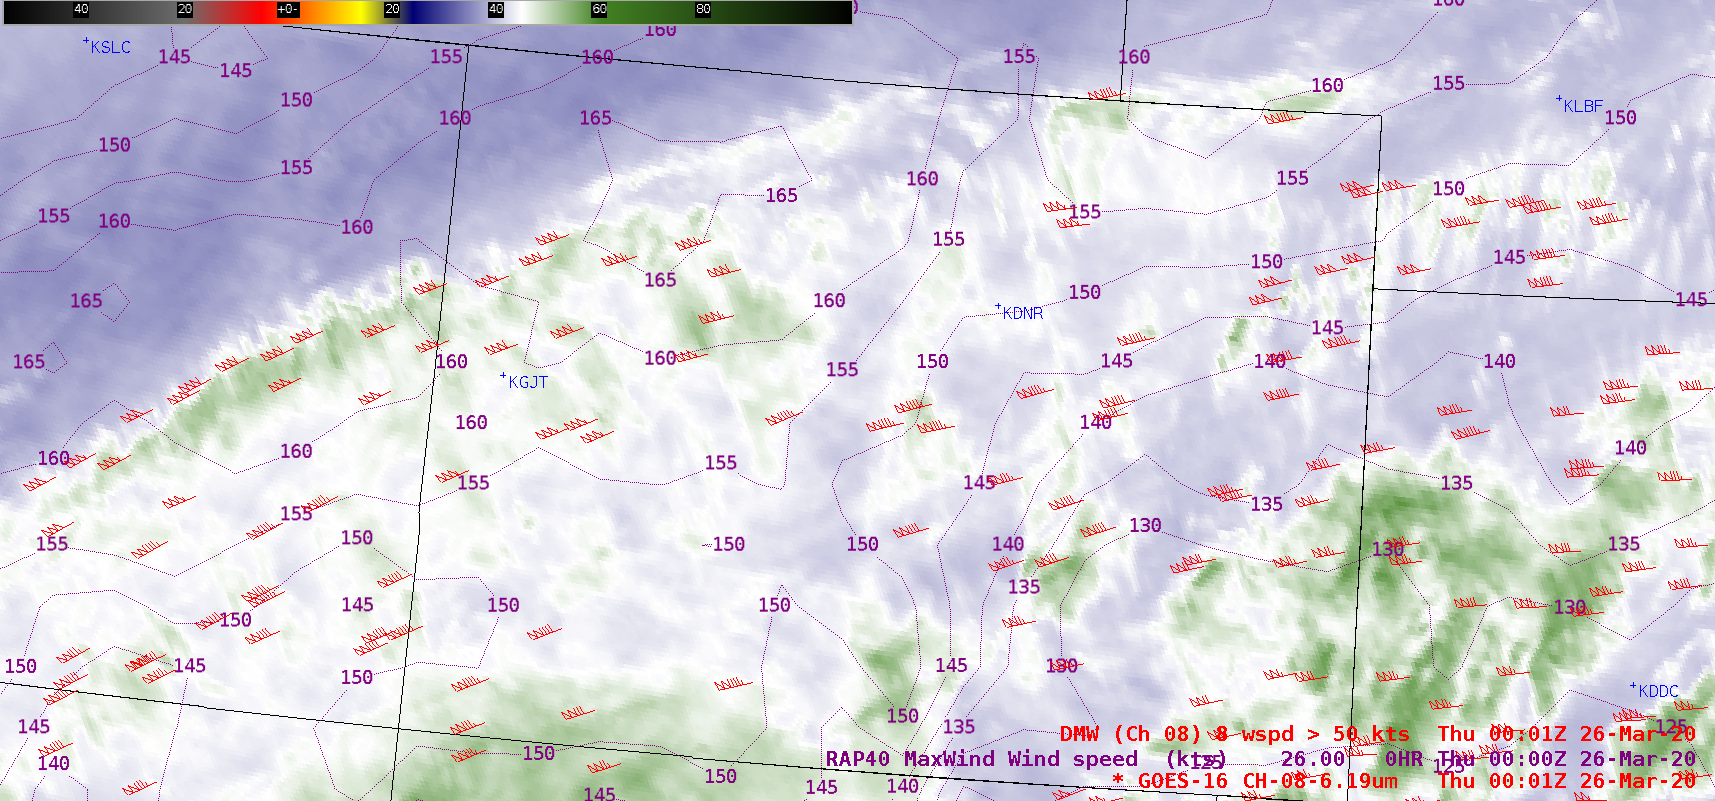
![GOES-16 Upper-level Water Vapor (6.2 µm) images, with plots of Derived Motion Winds and contours of RUC40 model maximum wind speeds [click to play animation | MP4]](https://cimss.ssec.wisc.edu/satellite-blog/images/2020/03/200325_goes16_waterVapor_winds_rap40maxWinds_CO_anim.gif)
![Plot of rawinsonde data from Grand Junction, Colorado at 00 UTC on 26 March [click to enlarge]](https://cimss.ssec.wisc.edu/satellite-blog/images/2020/03/200326_00utc_kgjt_raob.png)
![250 hPa wind speed anomalies at 00 UTC on 26 March [click to enlarge]](https://cimss.ssec.wisc.edu/satellite-blog/images/2020/03/200326_00utc_250windSpeedAnomaly.png)
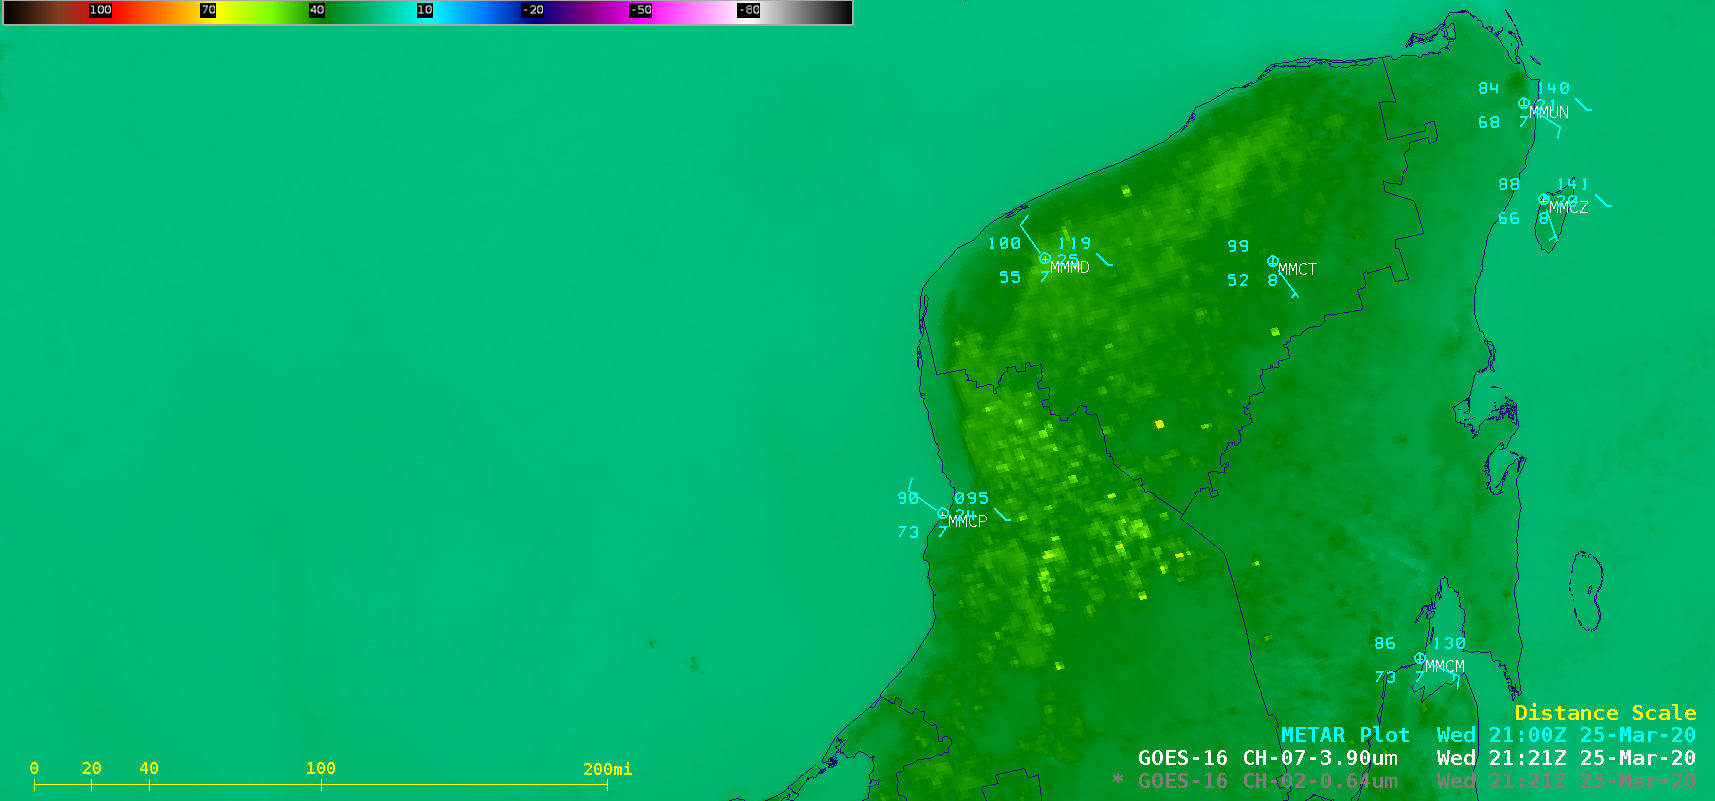
![GOES-16 Shortwave Infrared (3.9 um) images [click to play animation | MP4]](https://cimss.ssec.wisc.edu/satellite-blog/images/2020/03/200325_goes16_shortwaveInfrared_Yucatan_fires_anim.gif)
![GOES-16 True Color RGB images [click to play animation | MP4]](https://cimss.ssec.wisc.edu/satellite-blog/images/2020/03/200325_goes16_trueColorRGB_Gulf_of_Mexico_smoke_anim.gif)
