A sequence of GOES-16 (GOES-East) “Red” Visible (0.64 µm), Mid-level Water Vapor (6.9 µm) and Air Mass Red-Green-Blue (RGB) mages (above) showed an occluding Hurricane Force low pressure system (surface analyses) off the US East Coast on 01 April 2020. In the Air Mass RGB images, darker red areas just south of the storm center indicated... Read More
![GOES-16 “Red” Visible (0.64 µm), Mid-level Water Vapor (6.9 µm) and Air Mass RGB images [click to play animation | MP4]](https://cimss.ssec.wisc.edu/satellite-blog/images/2020/04/bomb_airmass-20200401_150117.png)
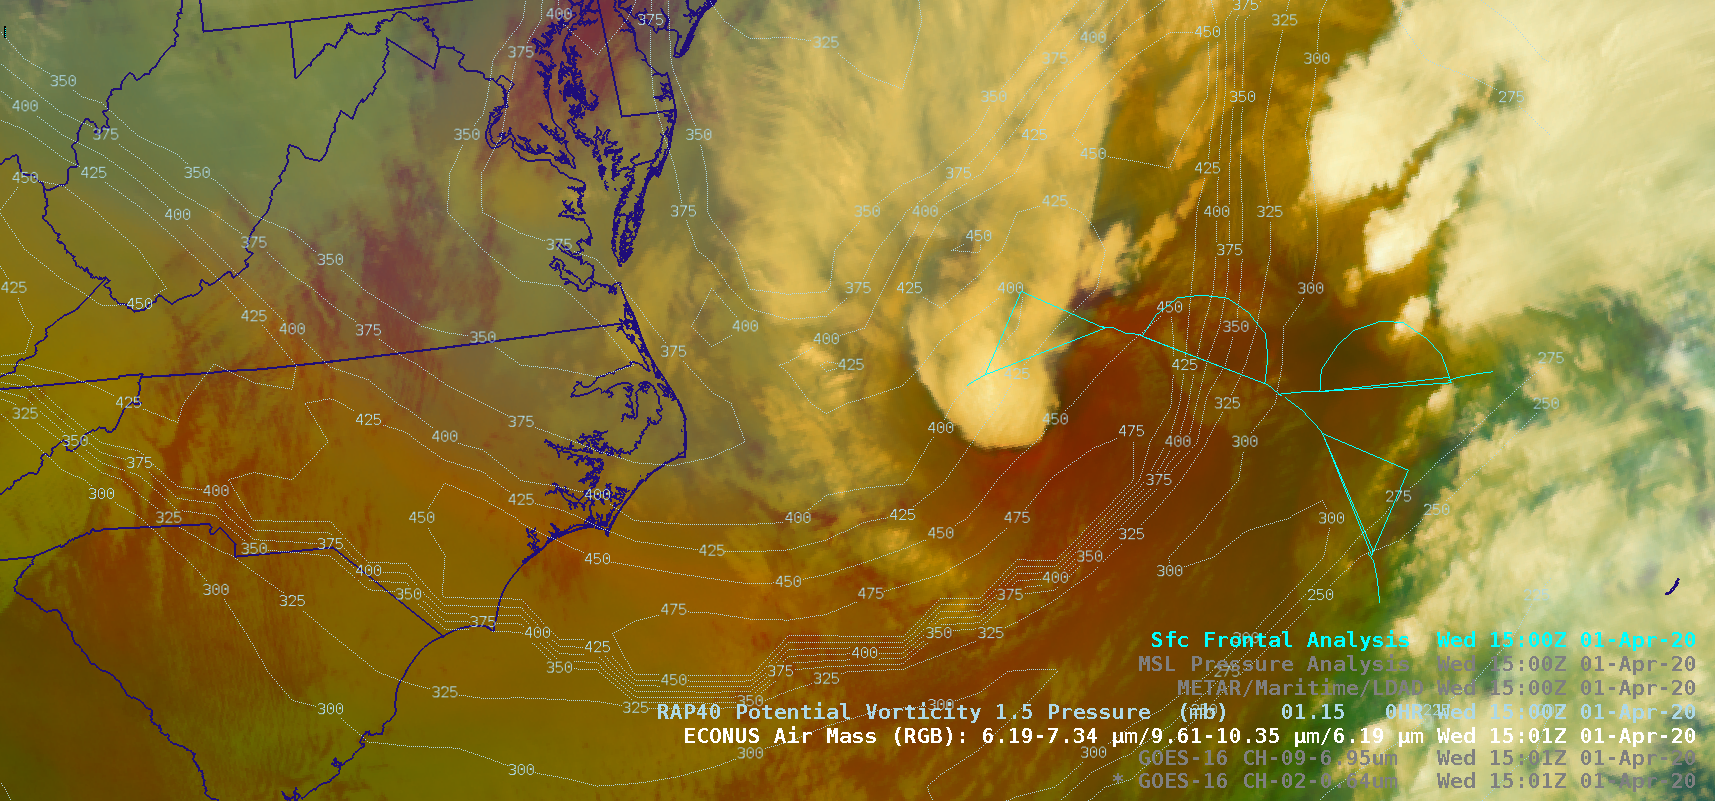
GOES-16 “Red” Visible (0.64 µm), Mid-level Water Vapor (6.9 µm) and Air Mass RGB images [click to play animation | MP4]
A sequence of GOES-16
(GOES-East) “Red” Visible (
0.64 µm), Mid-level Water Vapor (
6.9 µm) and
Air Mass Red-Green-Blue (RGB) mages
(above) showed an occluding Hurricane Force low pressure system (
surface analyses) off the US East Coast on
01 April 2020. In the Air Mass RGB images, darker red areas just south of the storm center indicated the presence of higher amounts of total column ozone, brought about by a lowering tropopause — RAP40 model fields of the PV1.5 pressure (representing the height of the “dynamic tropopause”) suggested that the tropopause had descended below the 500 hPa pressure level later in the day.
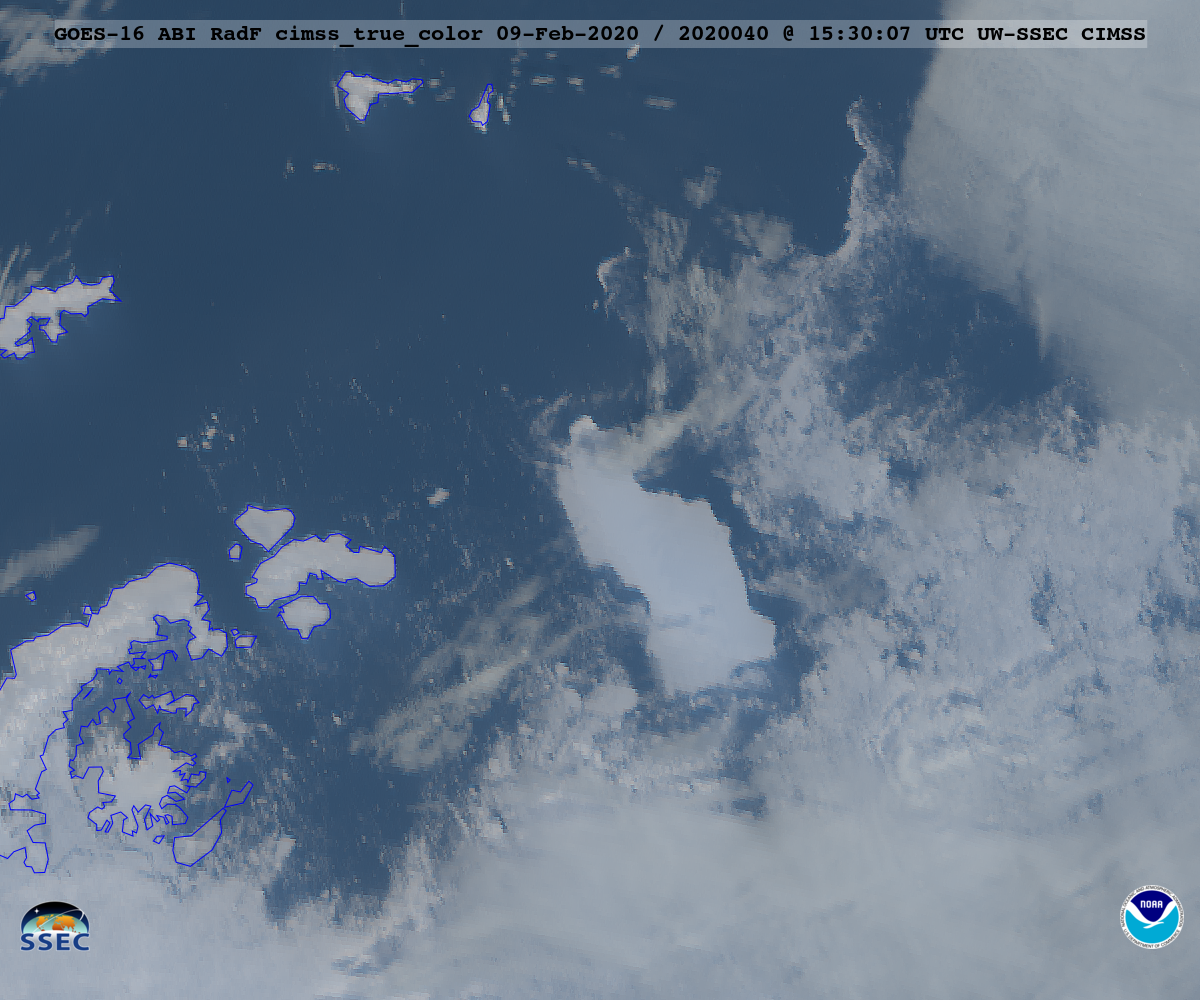
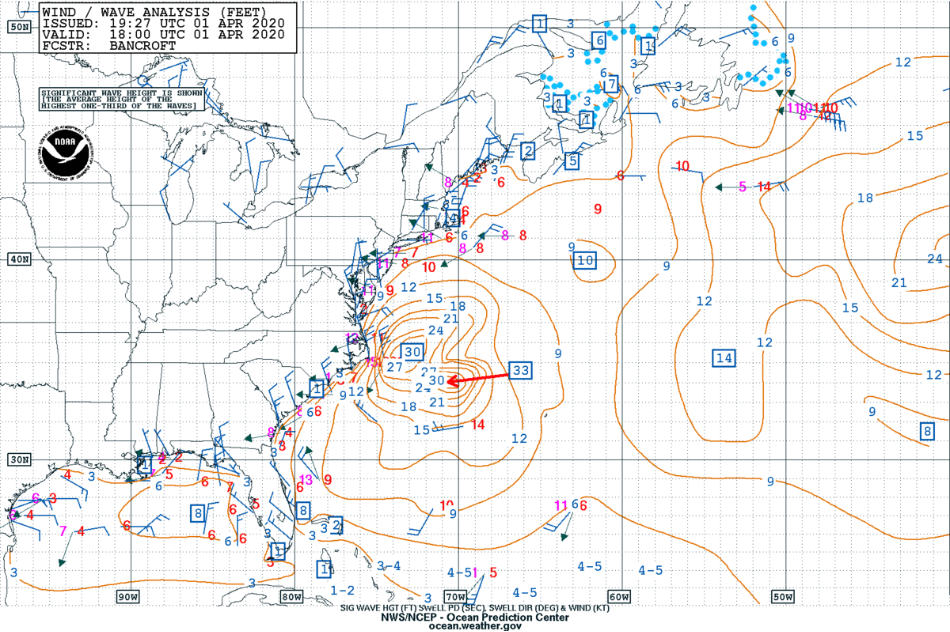
The hurricane-force winds at the surface were creating seas as high as 33 feet. The milky/hazy signature of a highly-agitated sea surface + sea spray — immediately south of the convection around the core of the storm — was evident in GOES-16 True Color RGB images, created using Geo2Grid (below).
![GOES-16 True Color RGB images [click to play animation | MP4]](https://cimss.ssec.wisc.edu/satellite-blog/images/2020/04/GOES-16_ABI_RadC_true_color_2020092_120117Z.png)
GOES-16 True Color RGB images [click to play animation | MP4]
GOES-16 Visible images with an overlay of
GLM Flash Extent Density
(below) revealed that lightning activity gradually decreased within convection surrounding the core of the low during the day.
![GOES-16 “Red” Visible (0.64 µm), Mid-level Water Vapor (6.9 µm) and Air Mass RGB images [click to play animation | MP4]](https://cimss.ssec.wisc.edu/satellite-blog/images/2020/04/bomb_vis_glm-20200401_151617.png)
GOES-16 “Red” Visible (0.64 µm) images with an overlay of GLM Flash Extent Density [click to play animation | MP4]
As the storm was becoming organized near the Southeast US coast during the preceding overnight hours, a toggle between Suomi NPP VIIRS Day/Night Band (0.7 µm) and Infrared Window (11.45 µm) images at 0627 UTC
(below) showed widespread mesospheric airglow waves (
reference) in the Day/Night Band, propagating across the western Atlantic Ocean — these waves were likely generated by the approach of an
upper-tropospheric jet streak. Note that the wave features were not apparent in the corresponding VIIRS Infrared image.
![Suomi NPP VIIRS Day/Night Band (0.7 µm) and Infrared Window (11.45 µm) images [click to enlarge]](https://cimss.ssec.wisc.edu/satellite-blog/images/2020/04/200401_0627utc_suomiNPP_viirs_dayNightBand_infraredWindow_W_Atlantic_anim.gif)
Suomi NPP VIIRS Day/Night Band (0.7 µm) and Infrared Window (11.45 µm) images [click to enlarge]
Addition information about this event is available on the
Satellite Liaison Blog.
View only this post
Read Less
![GOES-16 “Red” Visible (0.64 µm), Mid-level Water Vapor (6.9 µm) and Air Mass RGB images [click to play animation | MP4]](https://cimss.ssec.wisc.edu/satellite-blog/images/2020/04/200401_goes16_visible_waterVapor_airMassRGB_Atlantic_storm_anim.gif)
![GOES-16 True Color RGB images [click to play animation | MP4]](https://cimss.ssec.wisc.edu/satellite-blog/images/2020/04/200401_goes16_trueColorRGB_W_Atlantic_Hurricane_Force_low_anim.gif)
![GOES-16 “Red” Visible (0.64 µm), Mid-level Water Vapor (6.9 µm) and Air Mass RGB images [click to play animation | MP4]](https://cimss.ssec.wisc.edu/satellite-blog/images/2020/04/200401_goes16_visible_glmFlashExtentDensity_East_Coast_storm_anim.gif)
![GOES-16 True Color RGB images [click to play animation]](https://cimss.ssec.wisc.edu/satellite-blog/images/2020/03/daily_cimss.gif)

![GOES-16 "Red" Visible (0.64 µm), and Near-Infrared "Cirrus" (1.37 µm) images [click to enlarge]](https://cimss.ssec.wisc.edu/satellite-blog/images/2020/03/200331_1601utc_goes16_visible_cirrus_WI_contrails_anim.gif)
![GOES-16 "Red" Visible (0.64 µm) images with plots of Derived Motion Winds (yellow) [click to enlarge]](https://cimss.ssec.wisc.edu/satellite-blog/images/2020/03/200331_goes16_visible_derivedMotionWinds_mesovortex_MI_IN_anim.gif)

![GOES- 16 "Clean" Infrared Window (10.35 µm) images, with time-matched SPC Storm Reports plotted in purple [click to play animation | MP4]](https://cimss.ssec.wisc.edu/satellite-blog/images/2020/03/200328_goes16_infrared_spcStormReports_Midwest_anim.gif)
![Suomi NPP VIIRS Visible (0.64 µm) image with plots of available NUCAPS soundings + Gridded NUCAPS CAPE [click to enlarge]](https://cimss.ssec.wisc.edu/satellite-blog/images/2020/03/200328_1906utc_suomiNPP_viirs_visible_nucapsCAPE_anim.gif)
![Plot of 19 UTC rawinsonde data from Little Rock, Arkansas [click to enlarge]](https://cimss.ssec.wisc.edu/satellite-blog/images/2020/03/200328_19utc_klzk_raob.png)
