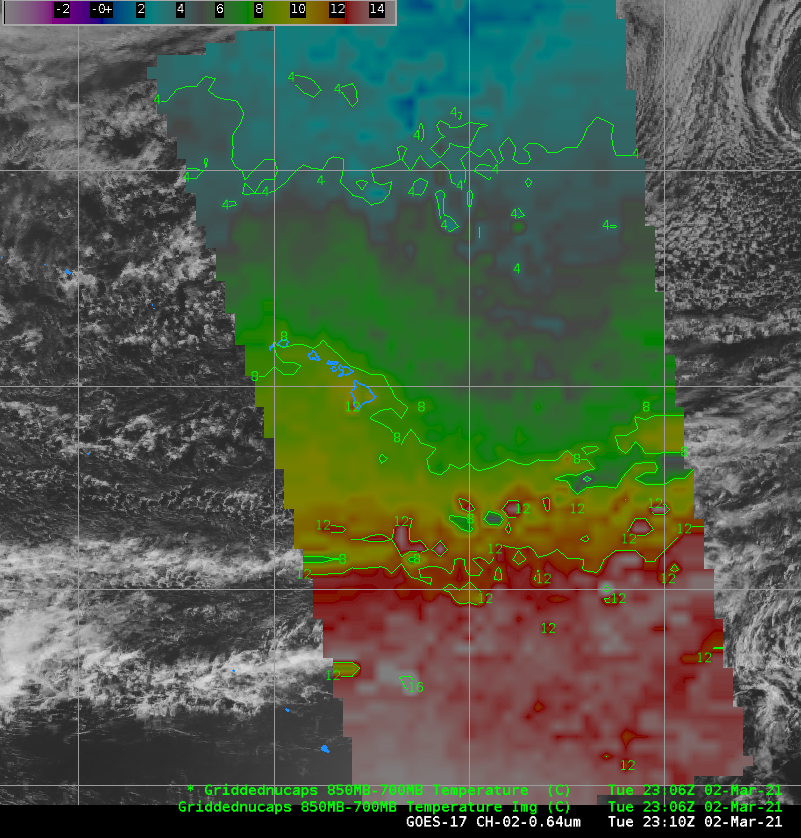
1-minute Mesoscale Domain Sector GOES-17 (GOES-West) “Red” Visible (0.64 µm) images (above) showed the hazy signature of a plume of re-suspended ash from the 1912 Katmai volcanic eruption. Strong surface winds gusting to 50-55 knots — caused by a strong pressure gradient along the western periphery of a Storm Force low in the Gulf of Alaska (surface analyses)... Read More
![GOES-17 “Red” Visible (0.64 µm) images [click to play animation | MP4]](https://cimss.ssec.wisc.edu/satellite-blog/images/2021/02/ak_vis-20210228_210059.png)
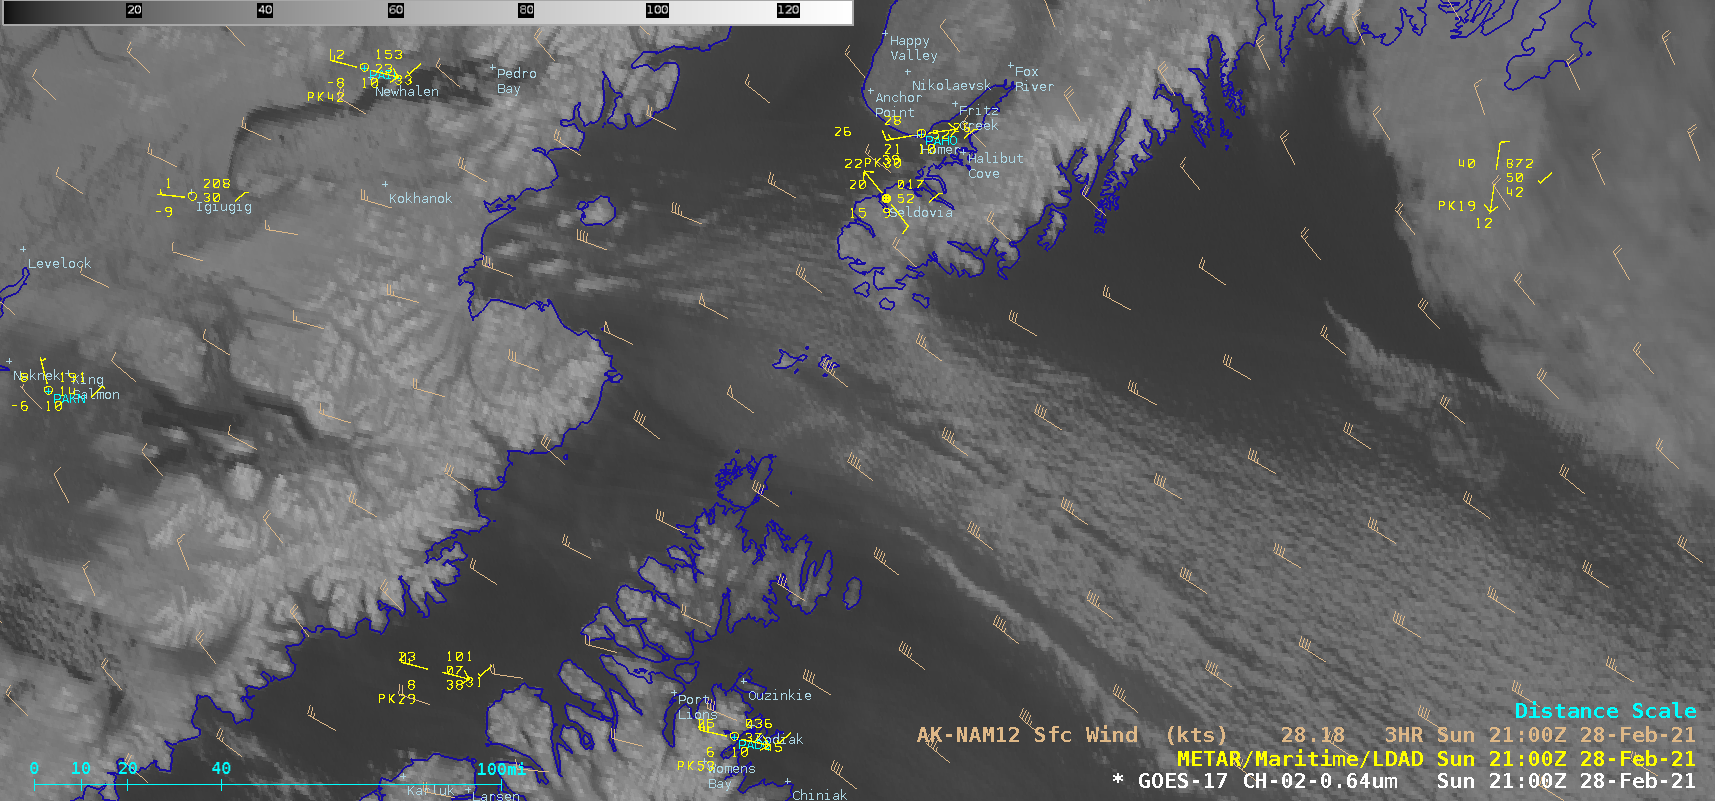
GOES-17 “Red” Visible (0.64 µm) images [click to play animation | MP4]
1-minute
Mesoscale Domain Sector GOES-17
(GOES-West) “Red” Visible (
0.64 µm) images
(above) showed the hazy signature of a plume of re-suspended ash from the
1912 Katmai volcanic eruption. Strong surface winds gusting to 50-55 knots — caused by a strong pressure gradient along the western periphery of a Storm Force low in the Gulf of Alaska (
surface analyses) — lofted some of the thick layer of ash that has remained on the ground in the vicinity of the volcano. The most dense portion of the aerosol plume was moving across the Barren Islands (between Kodiak Island to the south and the Kenai Peninsula to the north); near the northern edge of the aerosol plume, surface visibility was reduced to 5 miles at
Homer and 7 miles at
Seldovia.
A sequence of Suomi NPP VIIRS Day/Night Band (0.7 µm) images (below) showed that the plume had formed before sunrise — ample illumination from a Full Moon provided vivid “visible mages at night” (at 1131 UTC and 1311 UTC).
![Suomi NPP VIIRS Day/Night Band (0.7 µm) images [click to enlarge]](https://cimss.ssec.wisc.edu/satellite-blog/images/2021/02/210228_suomiNPP_viirs_dayNightBand_nearConstantContrast_AK_anim.gif)
Suomi NPP VIIRS Day/Night Band (0.7 µm) images [click to enlarge]
ASCAT winds from Metop-C at 0743 UTC and 2124 UTC (
source) are shown below — they indicated a dramatic increase in surface wind speeds of 50 knots or greater emerging from the Barren Islands into the Gulf of Alaska later in the day.
![ASCAT winds from Metop-C, at 0743 UTC and 2124 UTC [click to enlarge]](https://cimss.ssec.wisc.edu/satellite-blog/images/2021/02/210228_0734utc_2121utc_metopC_ascat_Katmai_anim.gif)
ASCAT winds from Metop-C, at 0743 UTC and 2124 UTC [click to enlarge]
GOES-17 True Color RGB images created using
Geo2Grid (below) provided a clearer view of the re-suspended ash plume. North of the plume, note the tidal ebb and flow of ice within Cook Inlet and Turnagain Arm leading into the Anchorage area.
![GOES-17 True Color RGB images [click to play animation | MP4]](https://cimss.ssec.wisc.edu/satellite-blog/images/2021/02/GOES-17_ABI_RadF_true_color_2021059_210032Z.png)
GOES-17 True Color RGB images [click to play animation | MP4]
View only this post
Read Less
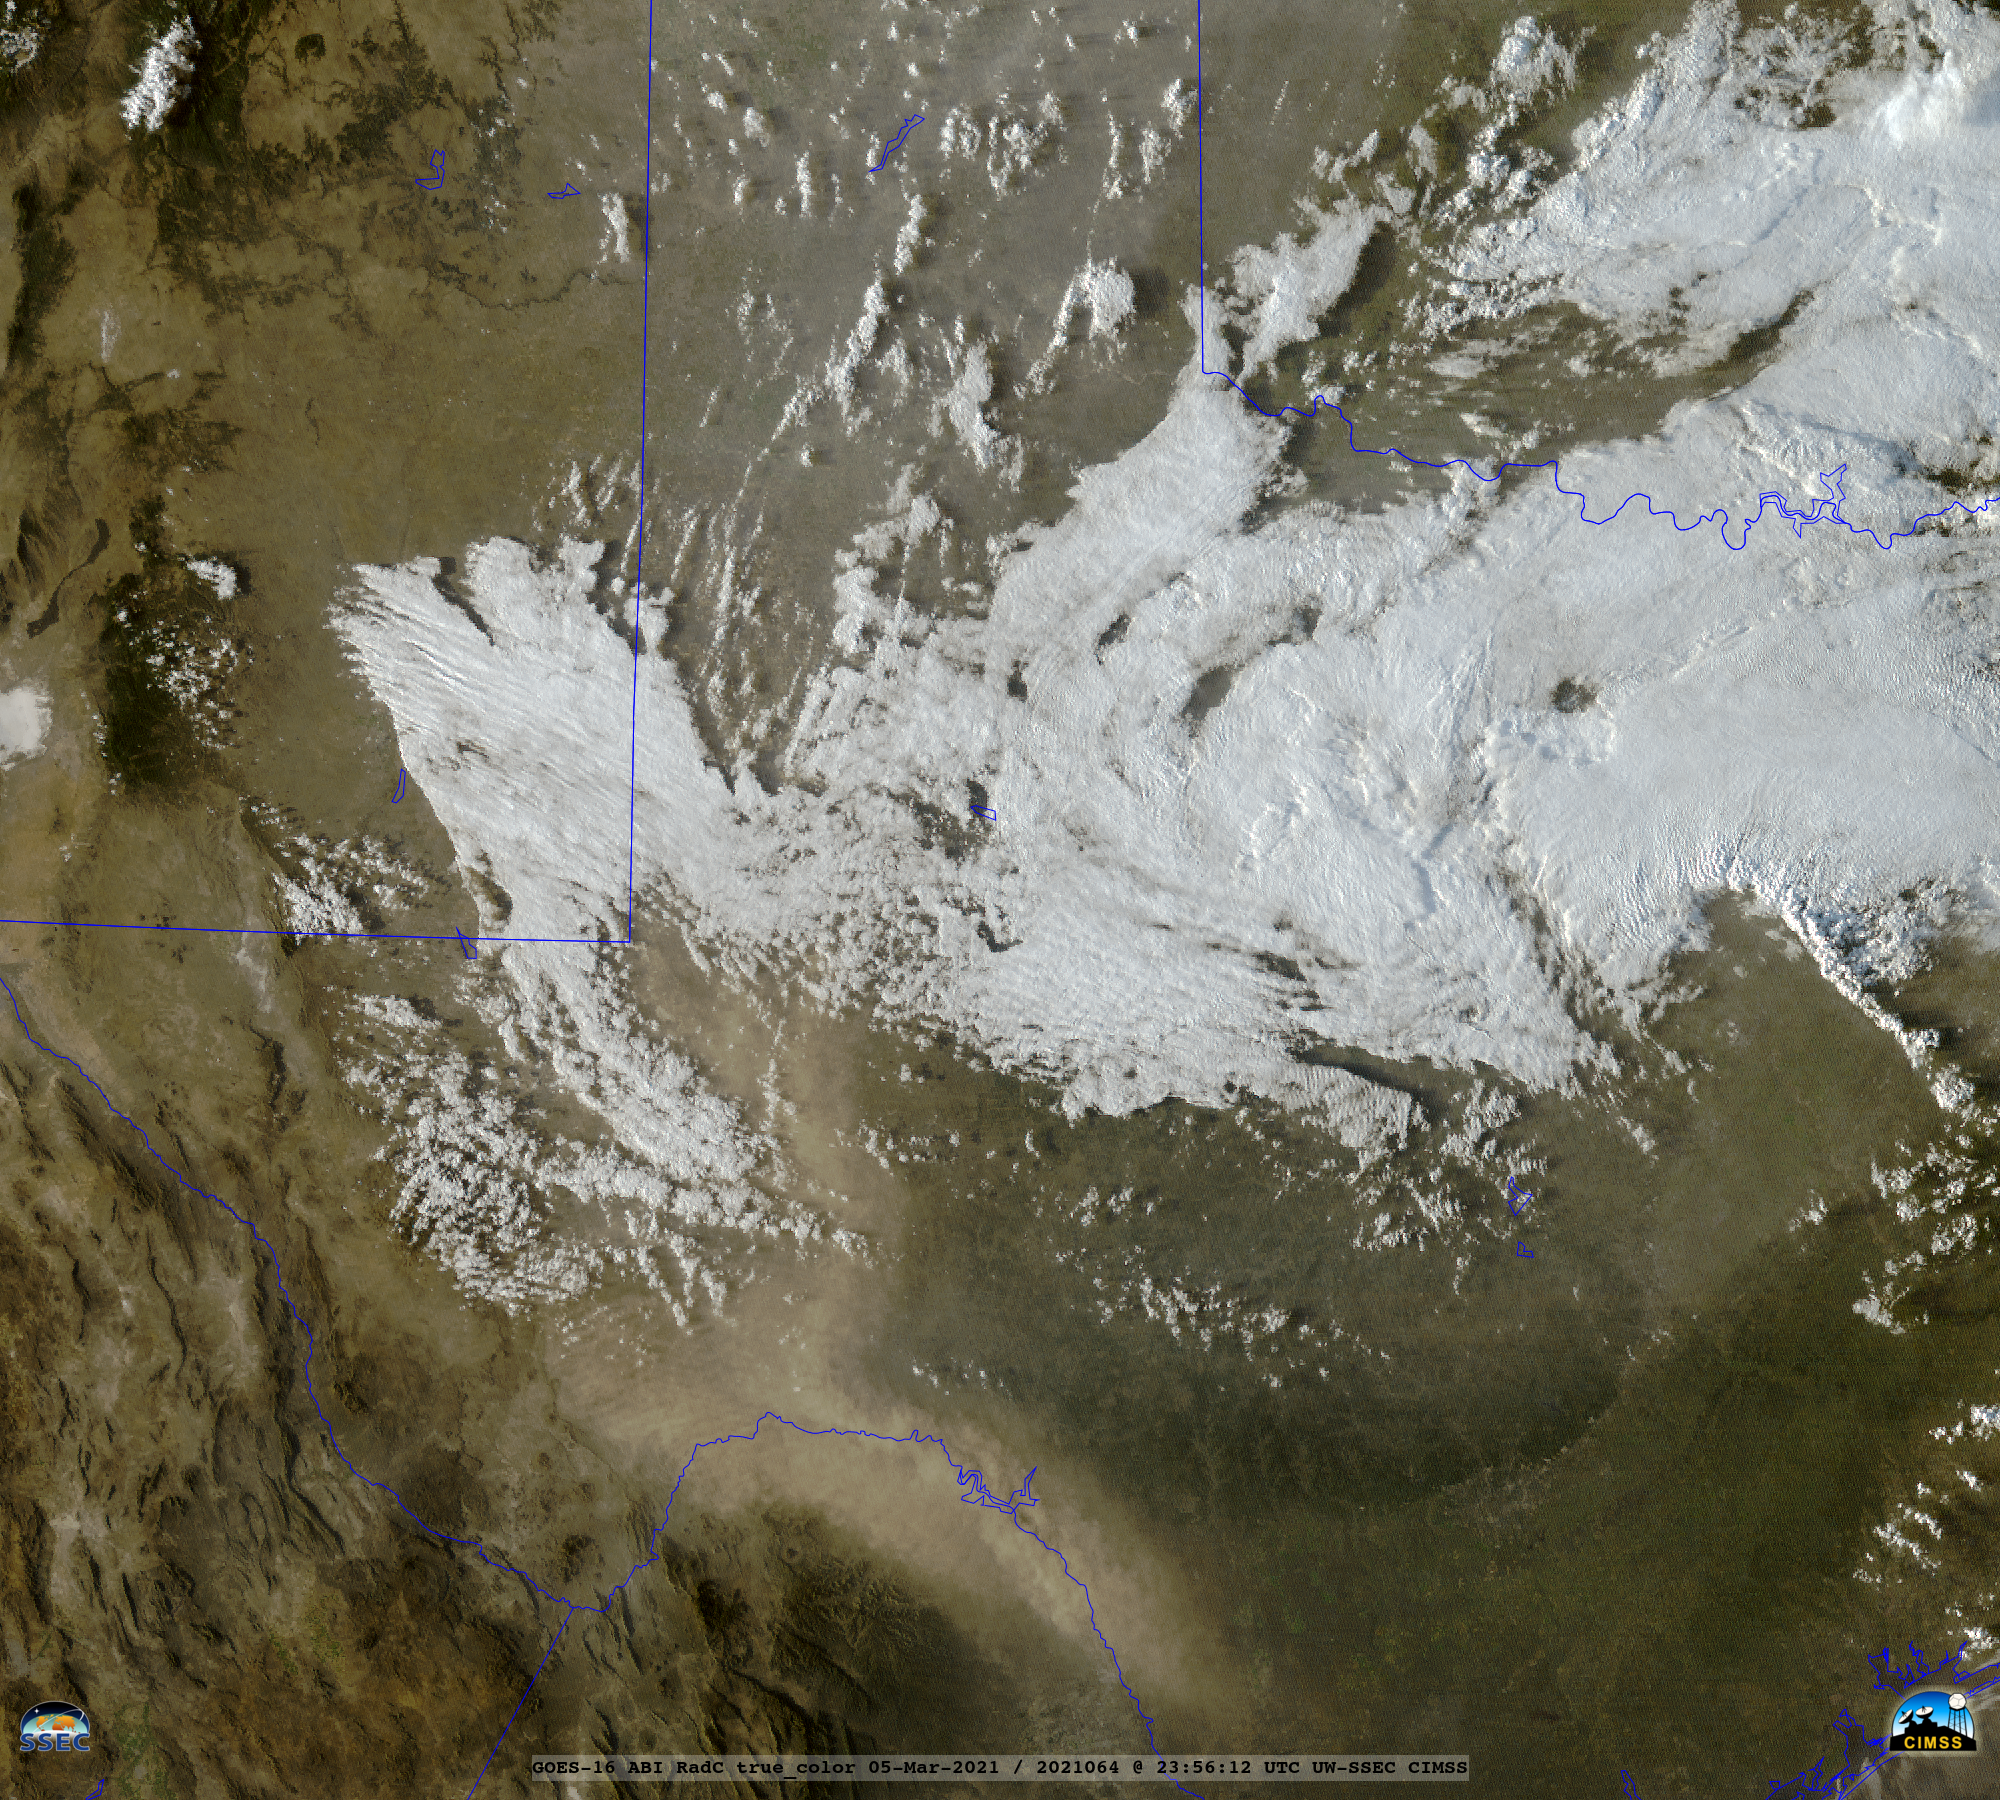
![GOES-16 Dust RGB and Split Cloud Top Phase (11.2-8.4 µm) images [click to play animation | MP4]](https://cimss.ssec.wisc.edu/satellite-blog/images/2021/03/210305_goes16_dustRGB_splitCloudTopPhase_TX_anim.gif)
![GOES-16 True Color RGB images [click to play animation | MP4]](https://cimss.ssec.wisc.edu/satellite-blog/images/2021/03/210305_goes16_trueColorRGB_TX_anim.gif)
![GOES-16 “Red” Visible (0.64 µm) images [click to play animation | MP4]](https://cimss.ssec.wisc.edu/satellite-blog/images/2021/03/210303_210304_goes16_visible_Green_Bay_WI_ice_anim.gif)
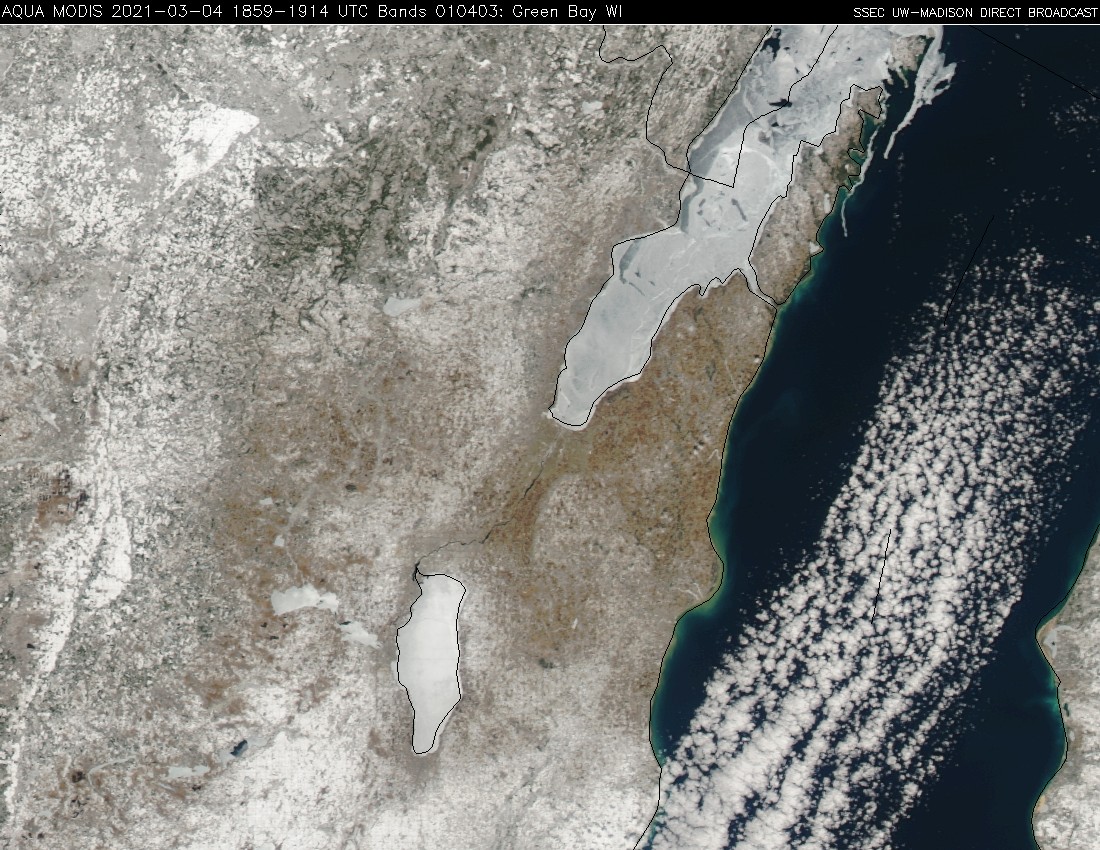
![Aqua MODIS True Color RGB images [click to enlarge]](https://cimss.ssec.wisc.edu/satellite-blog/images/2021/03/210303_210304_modis_trueColorRGB_Green_Bay_ice_anim.gif)
![Aqua MODIS True Color RGB images [click to enlarge]](https://cimss.ssec.wisc.edu/satellite-blog/images/2021/03/2021-03-04_1859-1914_HGRX_010403_QKM_anot.png)
![GOES-17 “Red” Visible (0.64 µm) images [click to play animation | MP4]](https://cimss.ssec.wisc.edu/satellite-blog/images/2021/02/210228_goes17_visible_AK_Katmai_ash_anim.gif)
![GOES-17 True Color RGB images [click to play animation | MP4]](https://cimss.ssec.wisc.edu/satellite-blog/images/2021/02/210228_goes17_trueColorRGB_AK_Katmai_ash_anim.gif)
