A thunderstorm over Jackson County, Oregon late in the day on 5 April 2020 produced abundant hail that accumulated to depths in excess of an inch over a wide swath of the county. Visible animation from 1500 UTC on 5 April through 0300 UTC on 6 April show the region experiencing plentiful... Read More
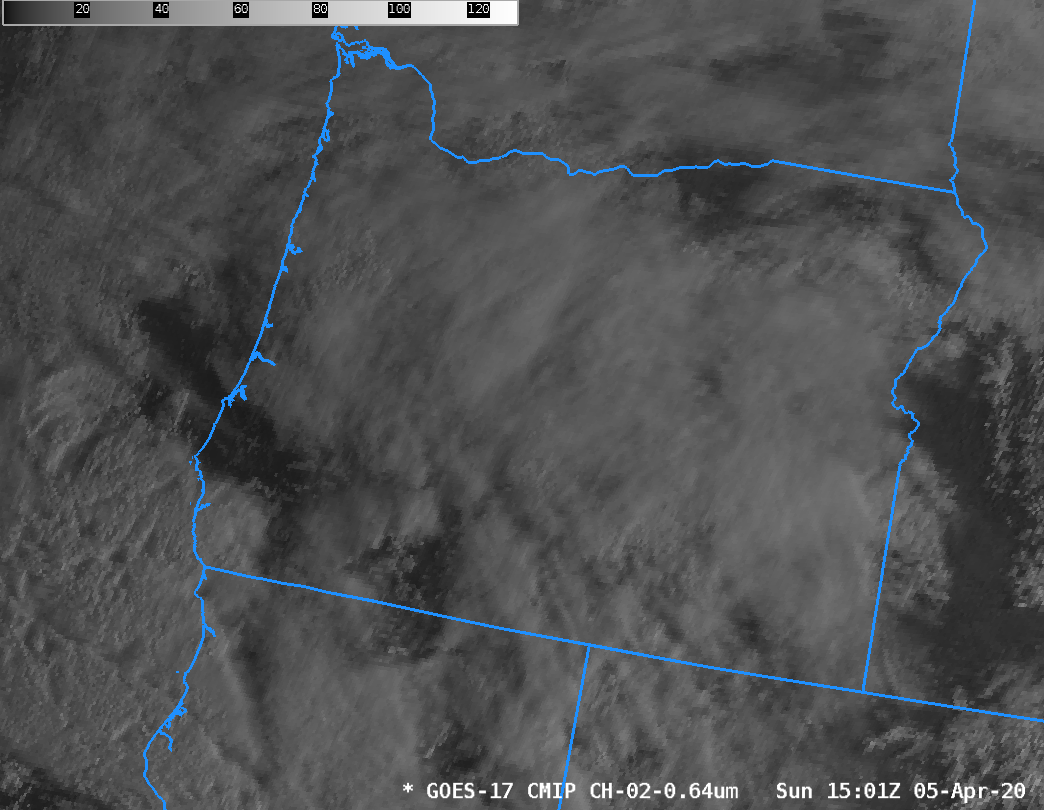
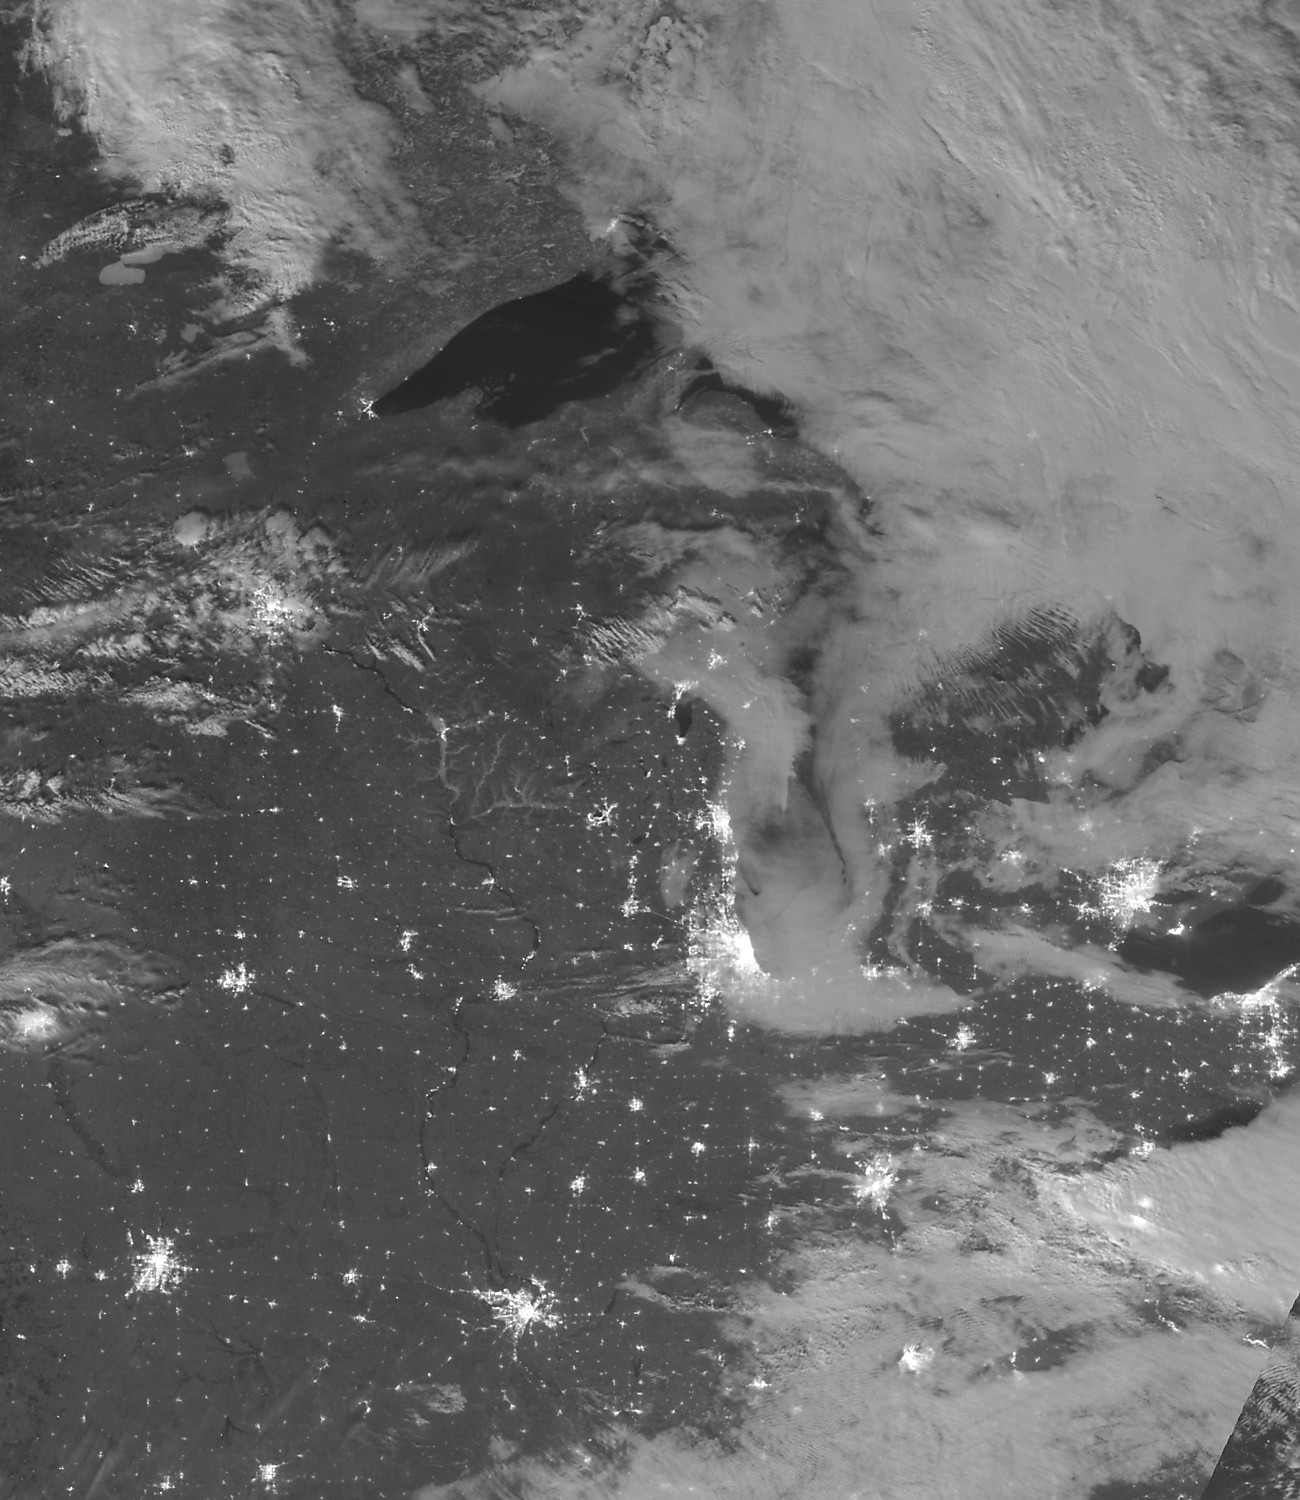
GOES-17 Band 02 (Red Visible, 0.64 µm) from 1500 UTC 5 April to 0300 UTC on 6 April 2020 (Click to play animated gif)
A thunderstorm over Jackson County, Oregon late in the day on 5 April 2020 produced abundant hail that accumulated to depths in excess of an inch over a wide swath of the county. Visible animation from 1500 UTC on 5 April through 0300 UTC on 6 April show the region experiencing plentiful sun during the day, helping to destabilize the lower troposphere. Much of the hail fell in the hour between 0030 and 0130 UTC on 6 April. That time is captured in the visible loop above, and in the rocking animation from 00 to 02 UTC on 6 April 2020 (and back) below. Similar animations (from 1500 UTC 5 April to 0300 UTC 6 April) are also available for GOES-17 Band 13 (10.3 µm) and the Day Cloud Phase RGB.
GOES-17 Band 02 (Red Visible, 0.64 µm) rocking animation from 2300 UTC/5 April to 0200 UTC/6 April 2020 (Click to enlarge)
The storms formed in a trough at 500 mb that was associated with abnormally cold temperature (image below courtesy Mike Stavish, WFO MFR). This feature is also discussed in this blog post.
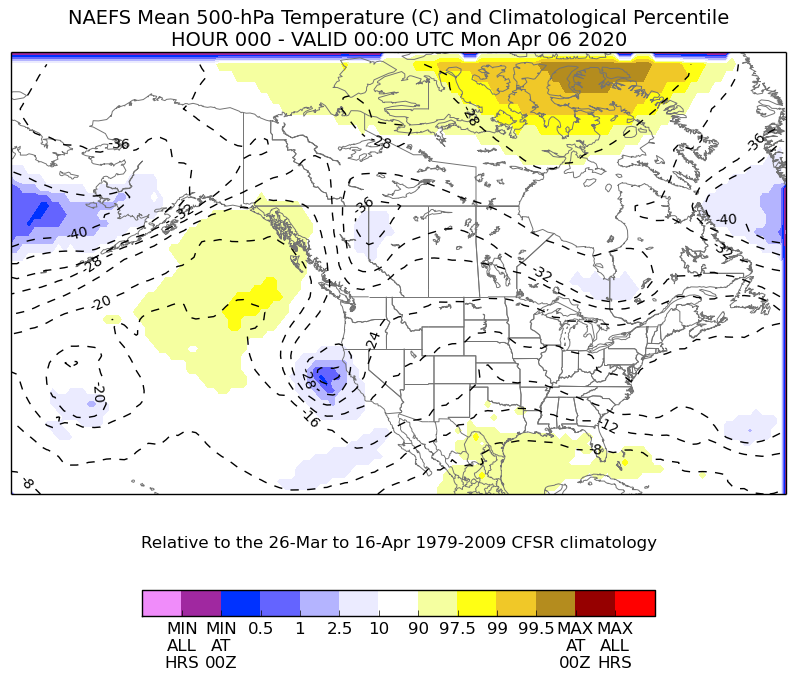
500-mb Temperatures at 0000 UTC on 6 April 2020 (Click to enlarge)
The 0000 UTC Upper-Air sounding at Medford, below, (also courtesy Mike Stavish) shows modest Convective Available Potential Energy (CAPE) amounts and a low freezing level (less than a mile above ground) suggest the possibility of hail.

Medford Oregon Sounding from 0000 UTC on 6 April 2020 (Click to enlarge)
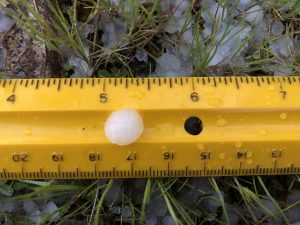
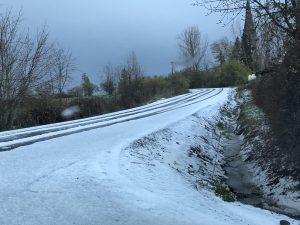
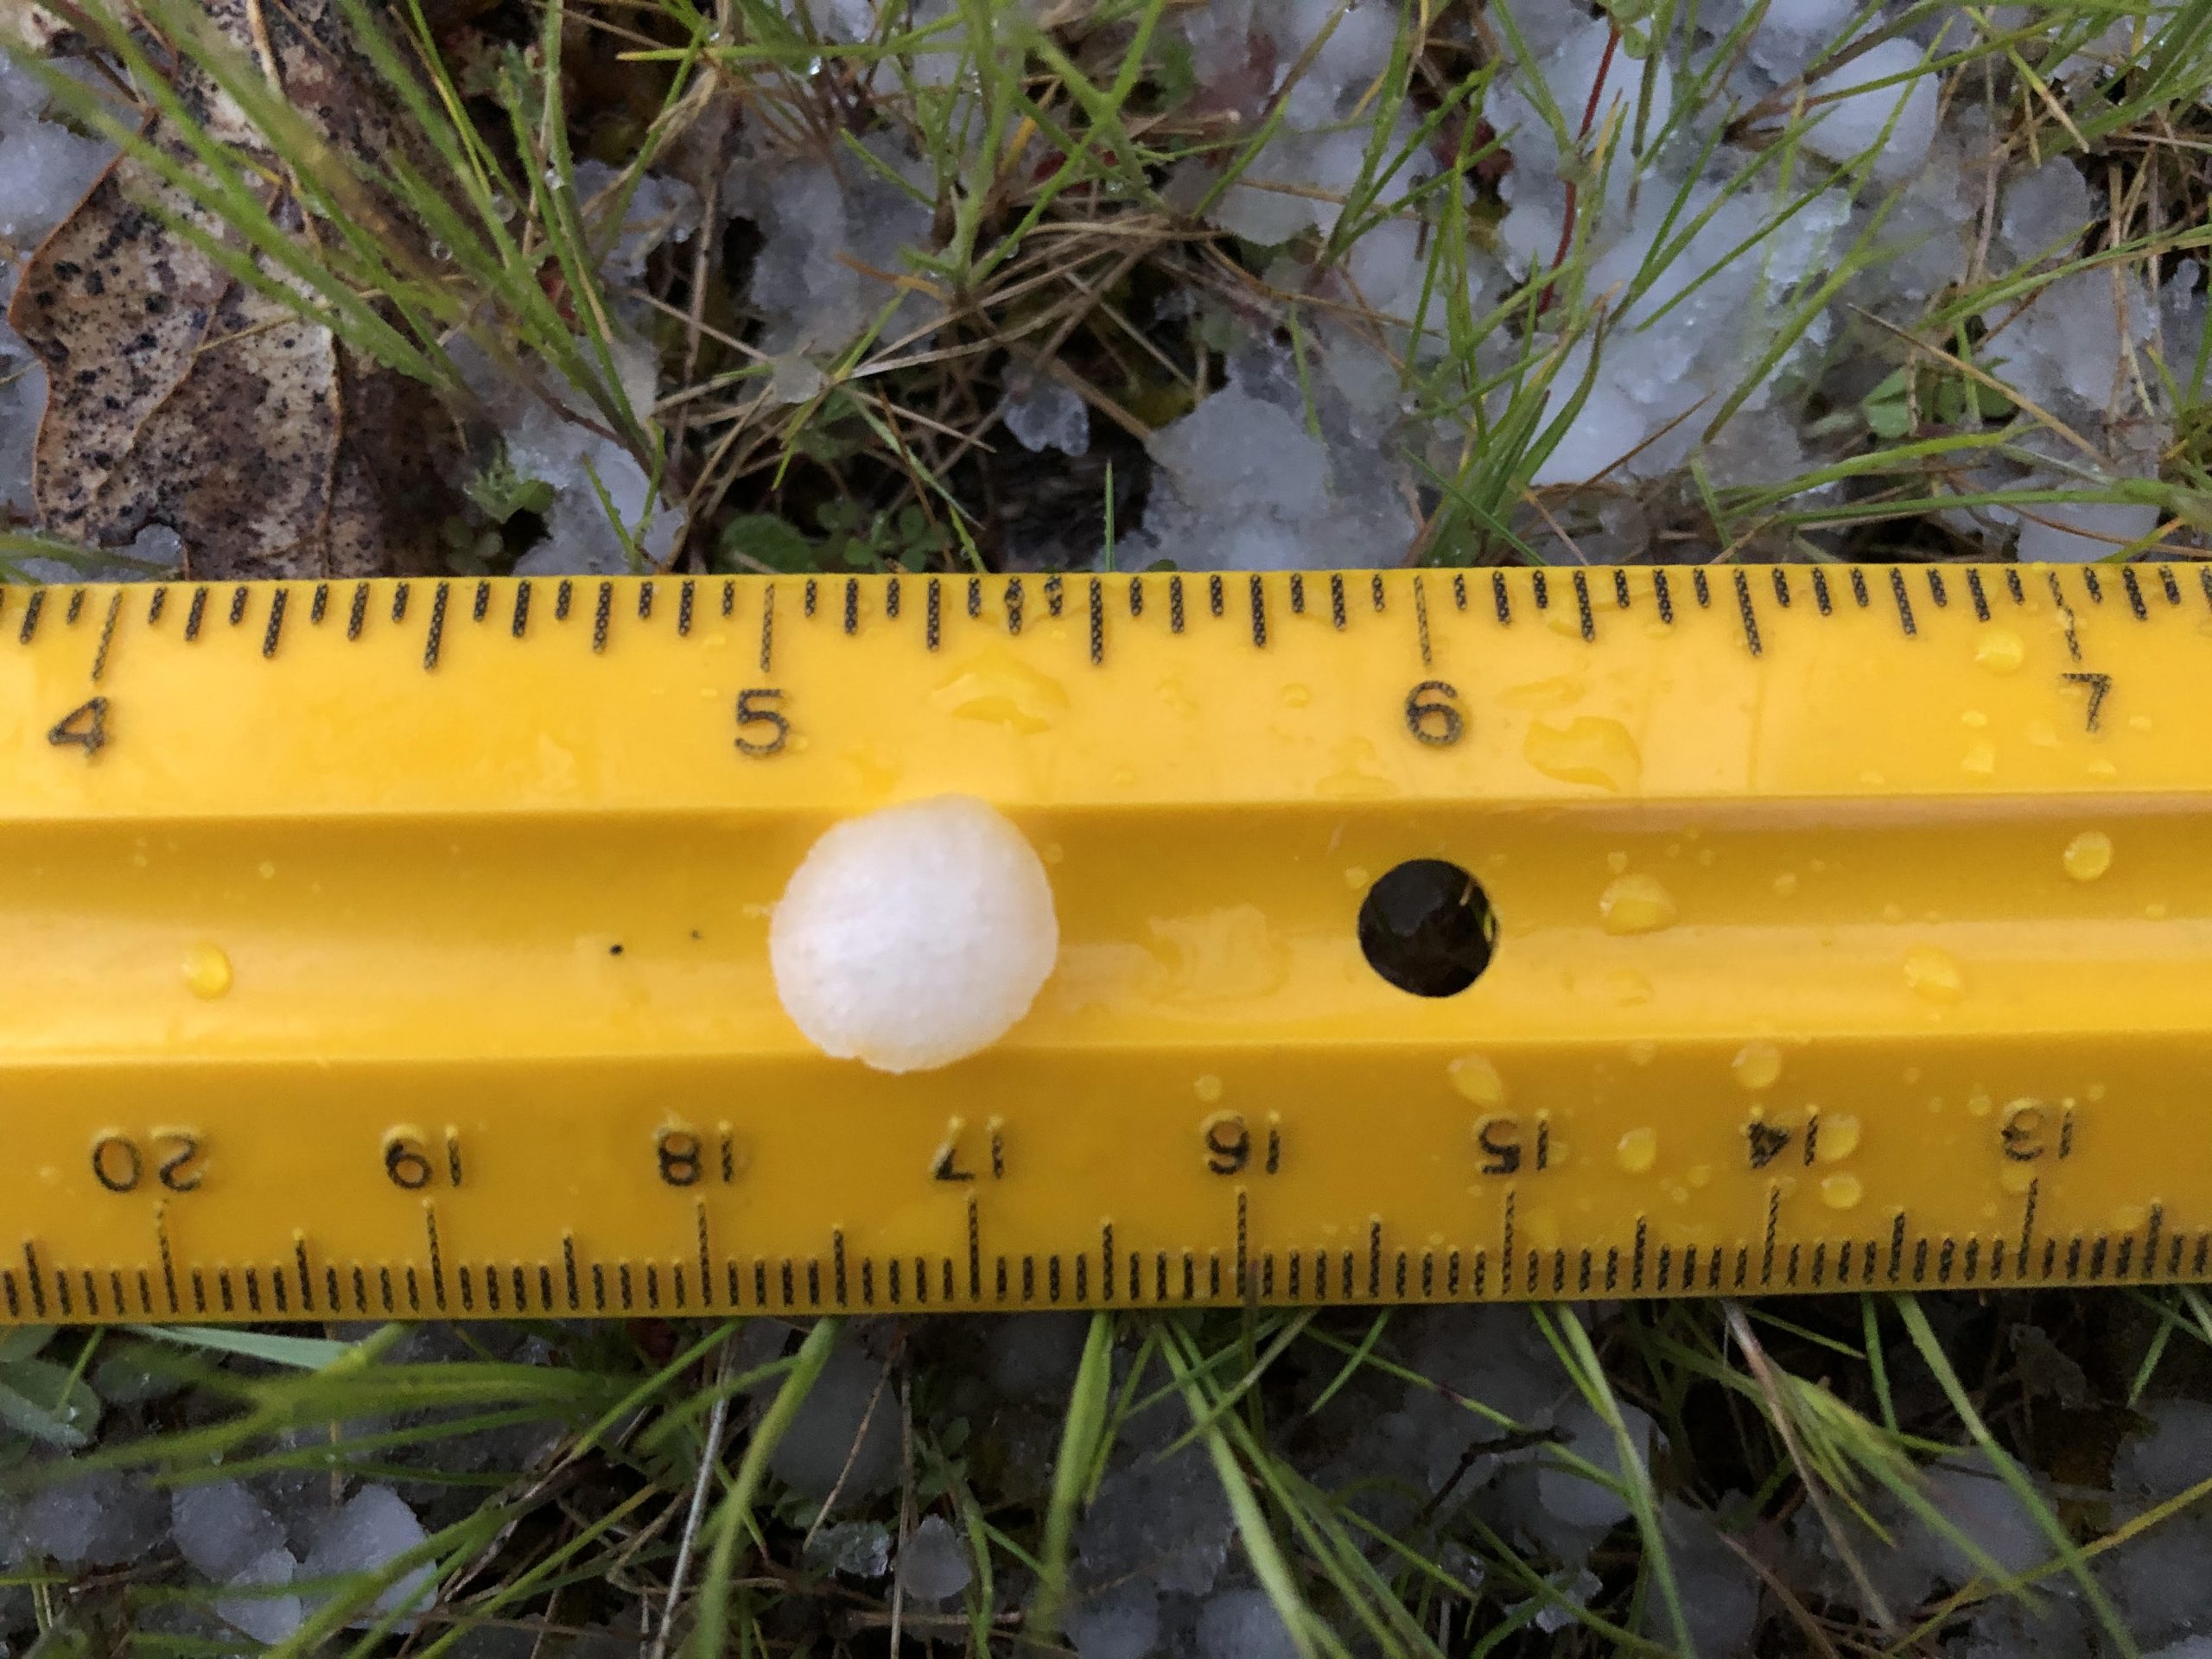
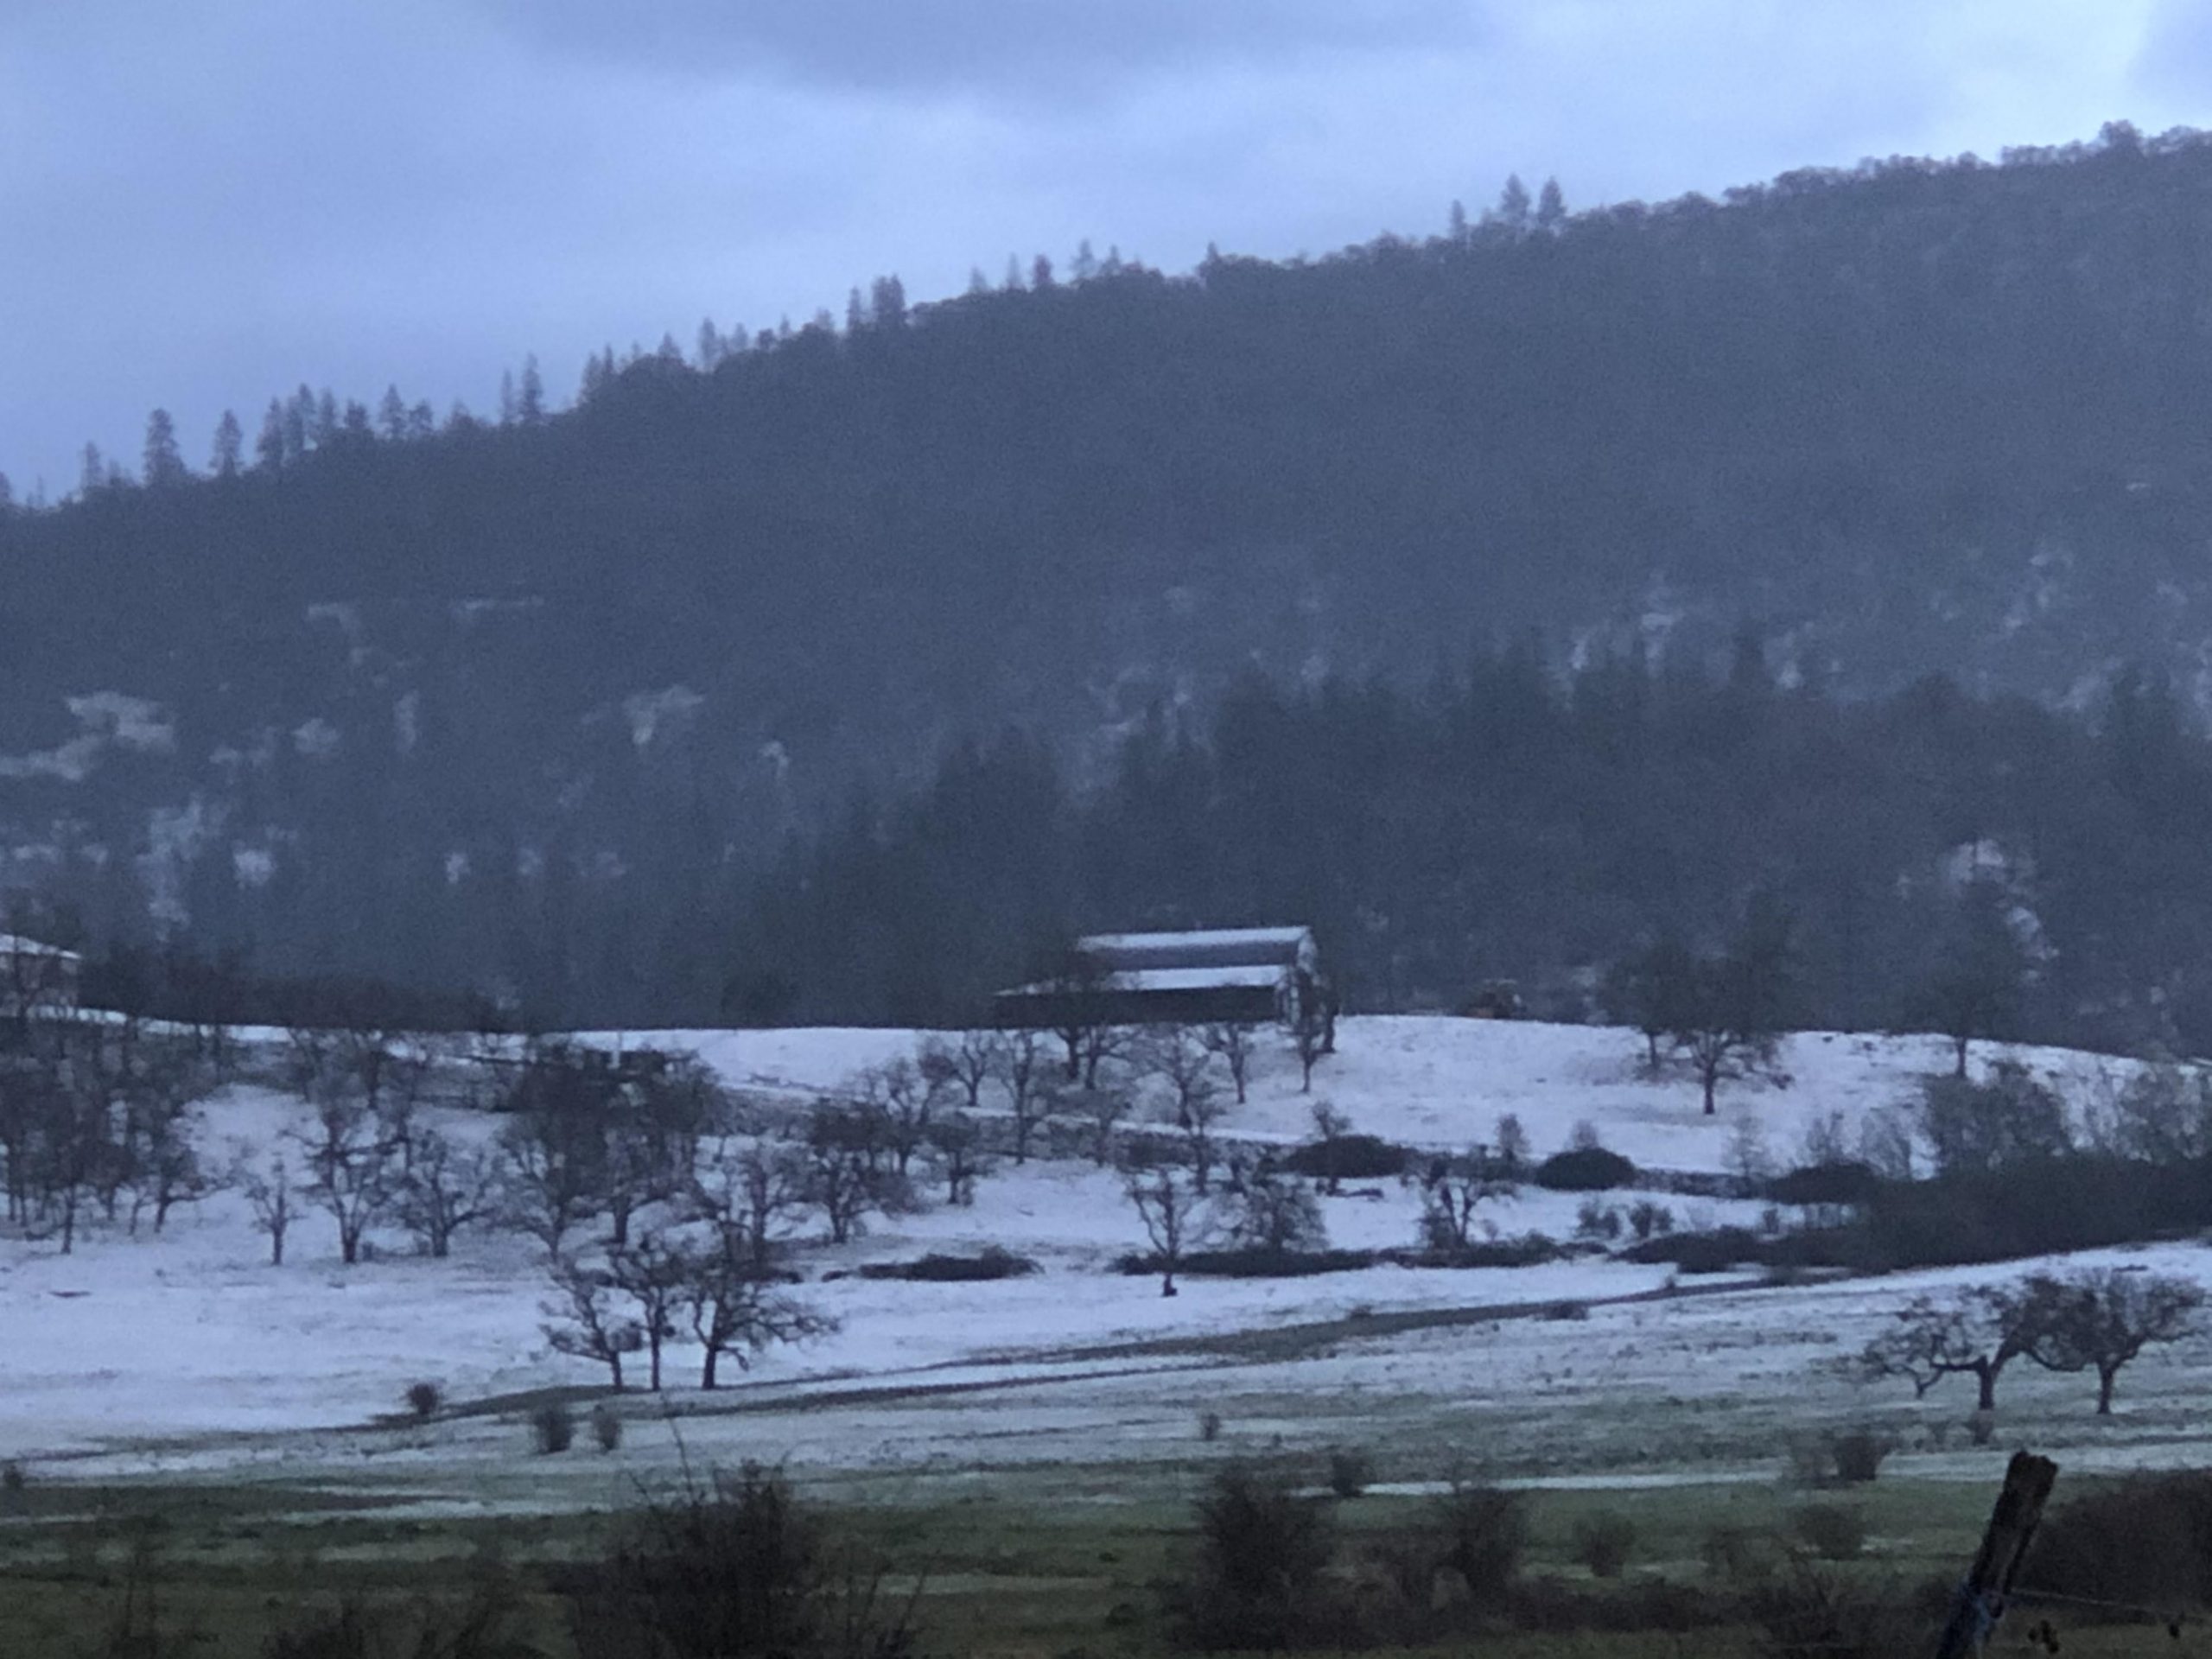
Indeed, the storm in question was a prolific hail producers, as shown in photographs below (photos courtesy Dan Weygand, WFO Medford)


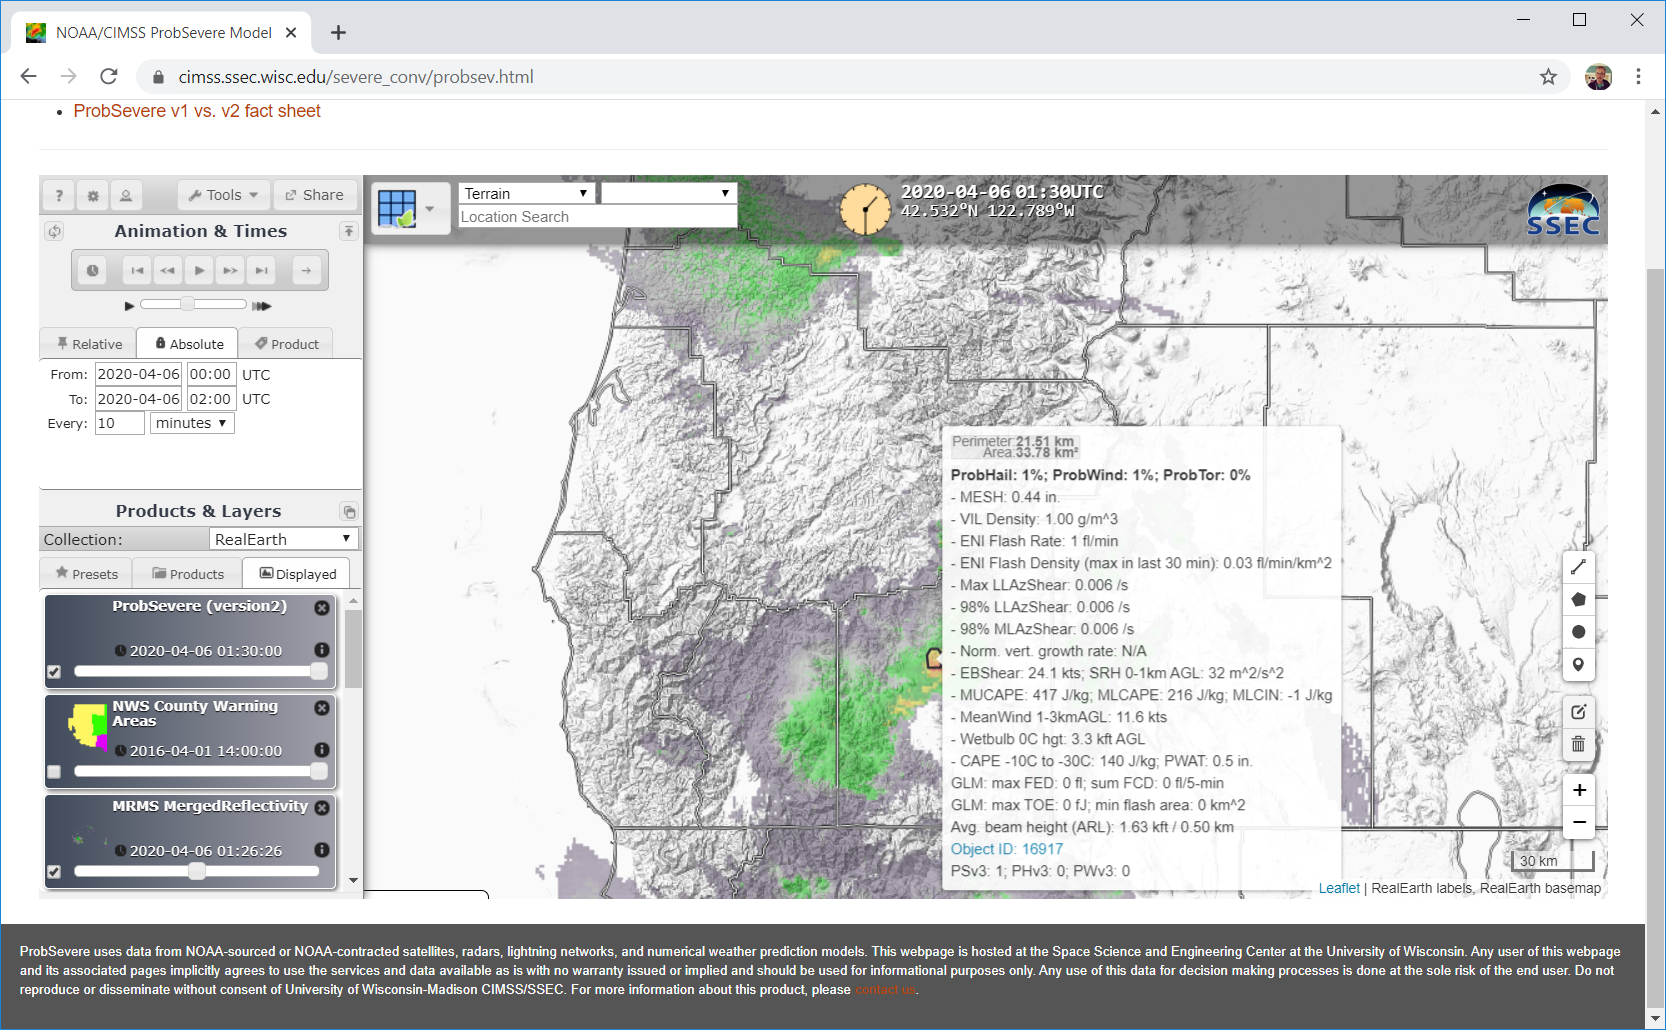
NOAA/CIMSS ProbSevere display at 10-minute timesteps from 0000 to 0200 UTC on 6 April 2020 (Click to enlarge)
NOAA/CIMSS ProbSevere readouts in a timeseries, below (courtesy John Cintineo, UW-Madison CIMSS), shows very low values of parameters typically associated with severe weather. ProbHail peaks at only 2%. The animation above shows very small values (Click here for a ProbSevere image at 0130 UTC with a Probe that shows values). Such small values during this event amplify the message that local knowledge of conditions that are favorable for severe weather (and hail events like this that coat roads can lead to traffic crashes and fatalities) are important.
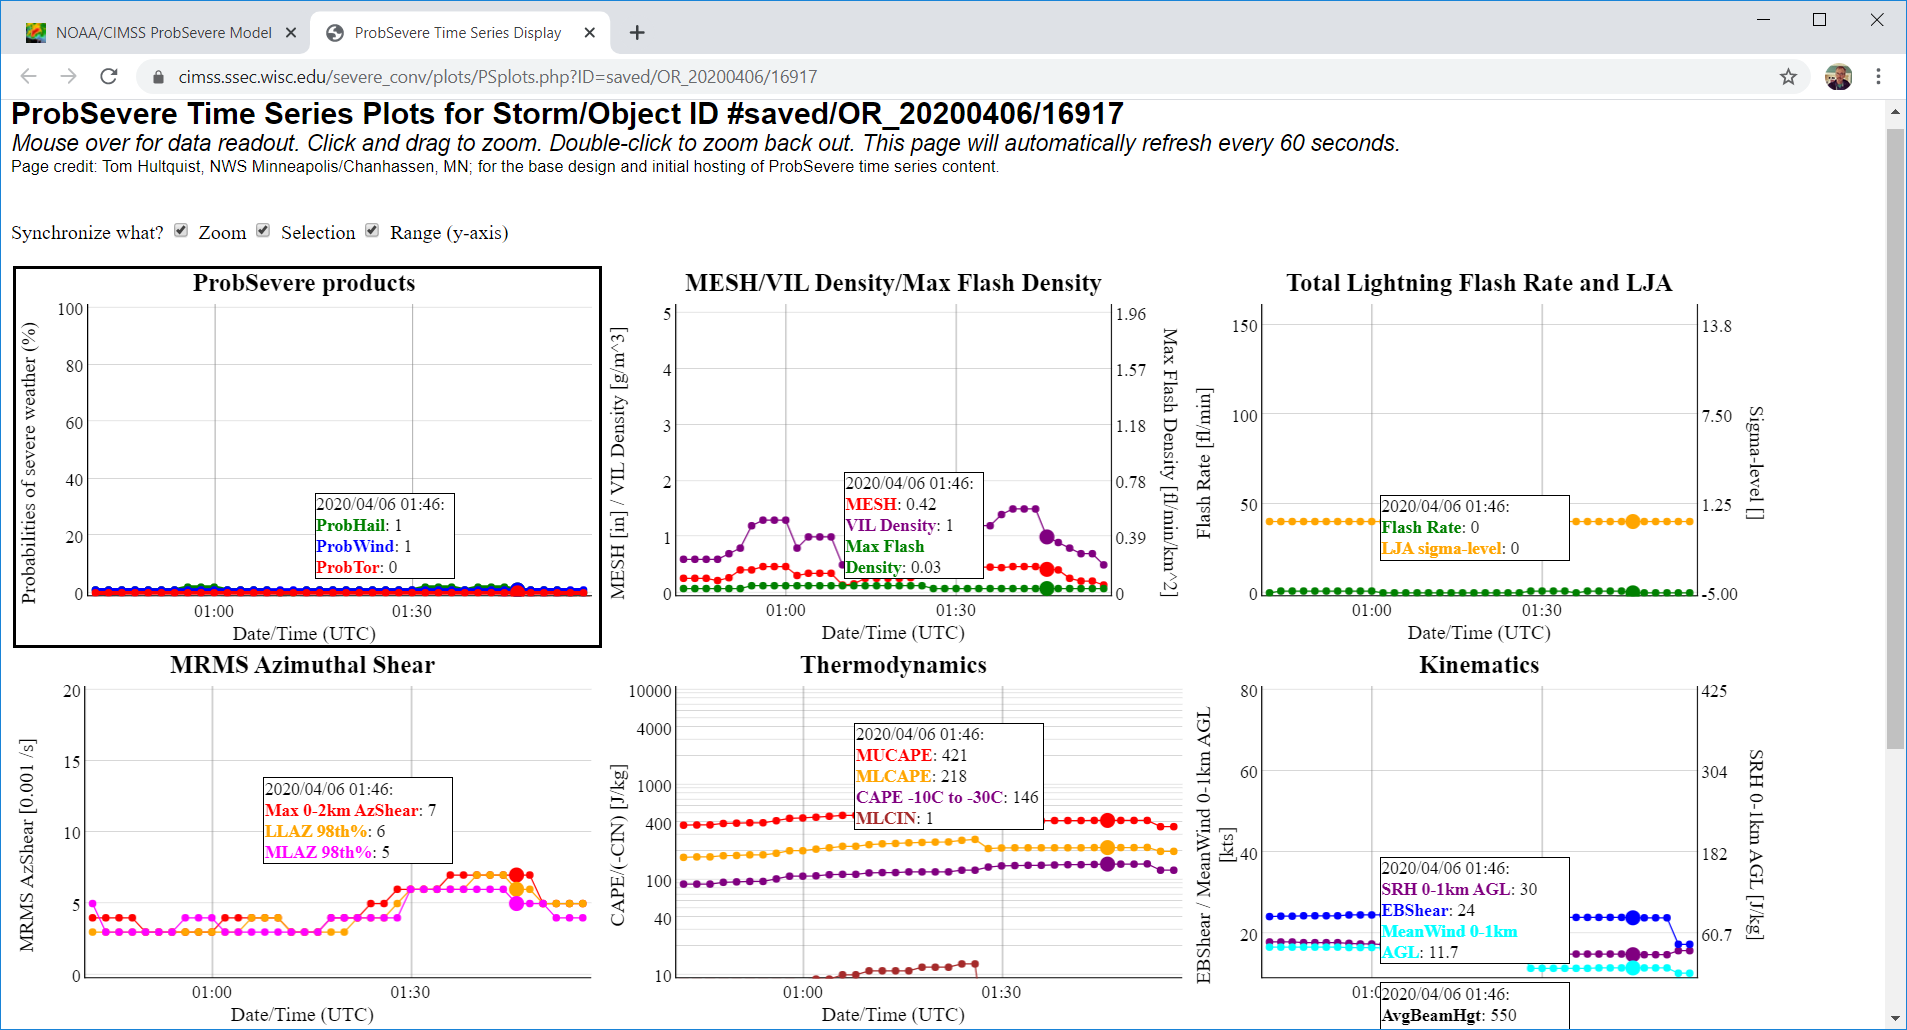
NOAA/CIMSS ProbSevere readout for the Radar Object 16917 in County Oregon
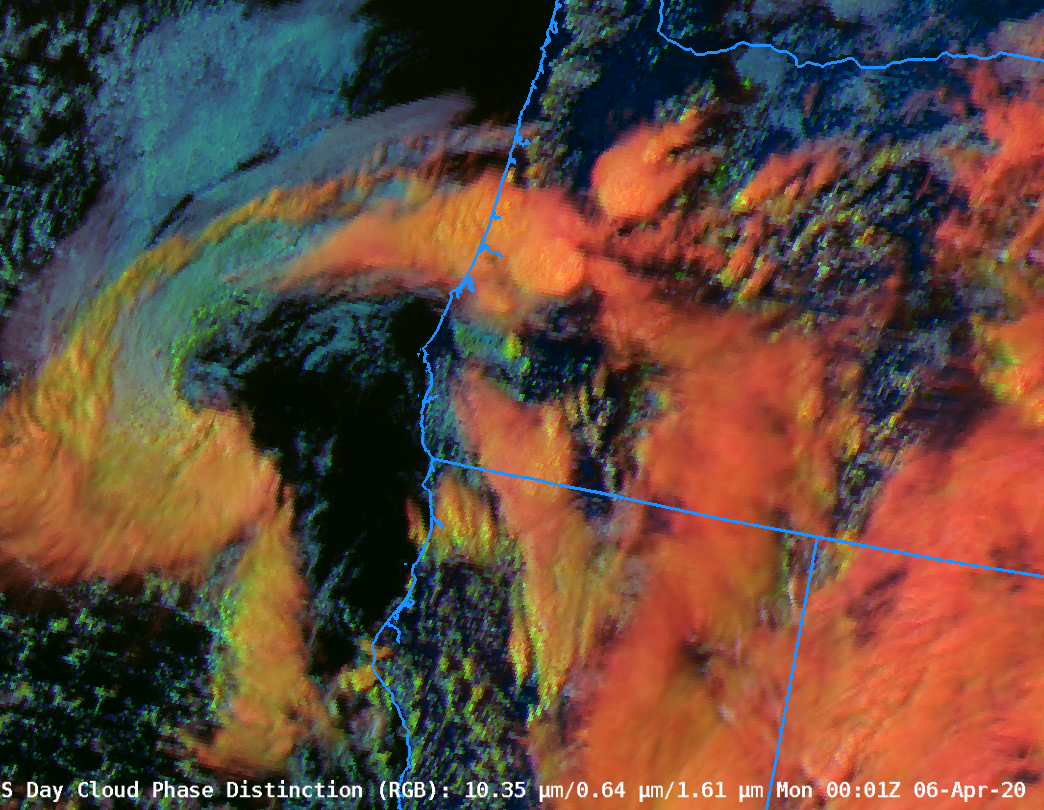
Rocking animations that cover the time of hail fall are shown below. Because the storm formed/decayed as the sun was setting, use of visible imagery (at top) or Day Cloud Phase Distinction (that uses the visible 0.64 µm in the ‘green’ and the snow/ice near-infrared 1.61 µm in the ‘blue’) was a challenge. Clean window imagery of course maintained a consistent signal through sunset.
Note the Day Cloud Phase Distinction does capture the glaciation of the cloud. Sometimes this can be used to judge when lightning might become a hazard. Lightning was a rare event on this day.

Rocking Animation of GOES-17 Clean Window IR (10.3 µm) from 2300 UTC/5 April to 0200 UTC/6 April (and back) (Click to enlarge)
Rocking Animation of GOES-17 Band 13 Clean Window Infrared imagery (10.3 µm) from 0000 UTC to 0200 UTC (and back) on 06 April 2020 (Click to enlarge)
Rocking Animation of GOES-17 Day Cloud Phase Distinction Red-Green-Blue composite imagery from 2300 UTC/5 April to 0200 UTC/6 April (and back) (Click to enlarge)
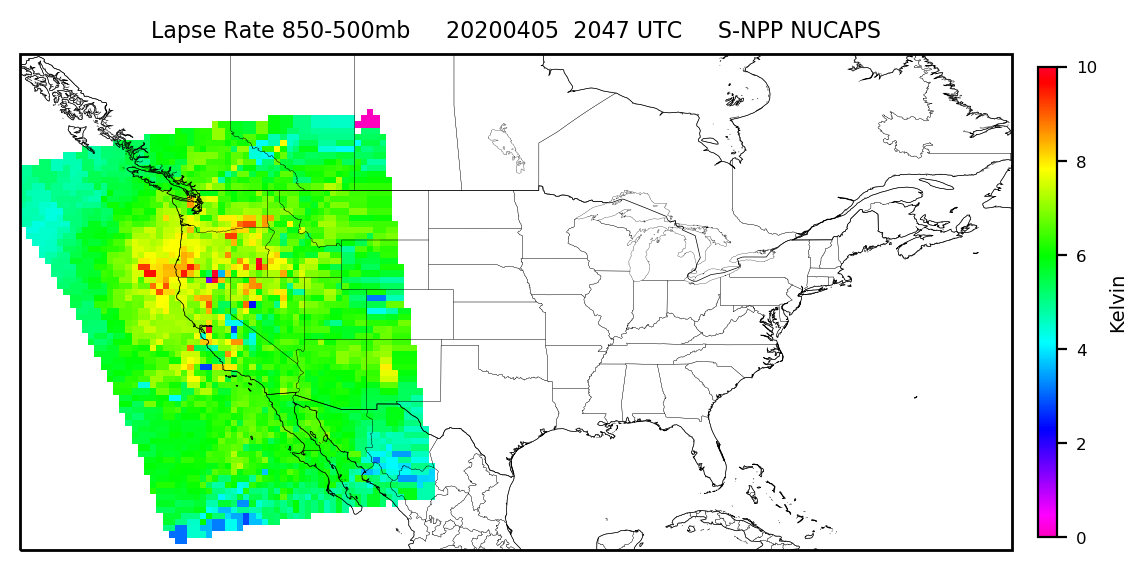
NOAA-20 overflew the West Coast, and NUCAPS soundings were produced, at 2047 UTC on 5 April. (Click here to see NOAA-20 orbits on that day, from this site). Gridded NUCAPS fields (from this site; update: from this site) of 500-mb Temperatures, Ozone Anomalies, and 850-500-mb Lapse Rates, below (imagery courtesy Emily Berndt and Frank LaFontaine, NASA Sport), show the cold air in the cutoff and the unstable environment that supported the convection.
Gridded NUCAPS estimates of 500-mb Temperatures, Total Ozone Anomaly and 850-500 mb lapse rate, data from NOAA-20 afternoon pass on 5 April 2020, ~2047 UTC (Click to enlarge)
(Thanks to Mike Stavish, Science and Operations Officer — SOO — in Medford for alerting us to this case)
View only this post
Read Less

![Himawari-8 Infrared Window (10.4 µm) images [click to play animation | MP4]](https://cimss.ssec.wisc.edu/satellite-blog/images/2020/04/200405_himawari8_infrared_TC_Harold_anim.gif)
![Himawari-8 "Red" Visible (0.64 µm) images [click to play animation | MP4]](https://cimss.ssec.wisc.edu/satellite-blog/images/2020/04/200405_himawari8_visible_TC_Harold_anim.gif)
![VIIRS Infrared Window (11.45 µm) images from NOAA-20 and Suomi NPP [click to enlarge]](https://cimss.ssec.wisc.edu/satellite-blog/images/2020/04/200405_noaa20_suomiNPP_viirs_infrared_TC_Harold_anim.gif)
![NOAA-20 VIIRS Day/Night Band (0.7 µm) and Infrared Window (11.45 µm) images (credit: William Straka, CIMSS) [click to enlarge]](https://cimss.ssec.wisc.edu/satellite-blog/images/2020/04/200405_1359utc_noaa20_dayNightBand_infraredWindow_TC_Harold_anim.gif)
![DMSP-18 SSMIS Microwave (85 GHz) image [click to enlarge]](https://cimss.ssec.wisc.edu/satellite-blog/images/2020/04/200405_1719utc_dmsp18_ssmis_microwave_TC_Harold.png)
![Himawari-8 "Clean" Infrared (10.4 µm) images [click to play animation | MP4]](https://cimss.ssec.wisc.edu/satellite-blog/images/2020/04/200406_himawari8_infrared_TC_Harold_anim.gif)


![GOES-16 Mid-level Water Vapor (6.9 µm) images, with hourly precipitation type plotted in red [click to play animation | MP4]](https://cimss.ssec.wisc.edu/satellite-blog/images/2020/04/200402_200403_goes16_waterVapor_precipitationType_Upper_Midwest_anim.gif)
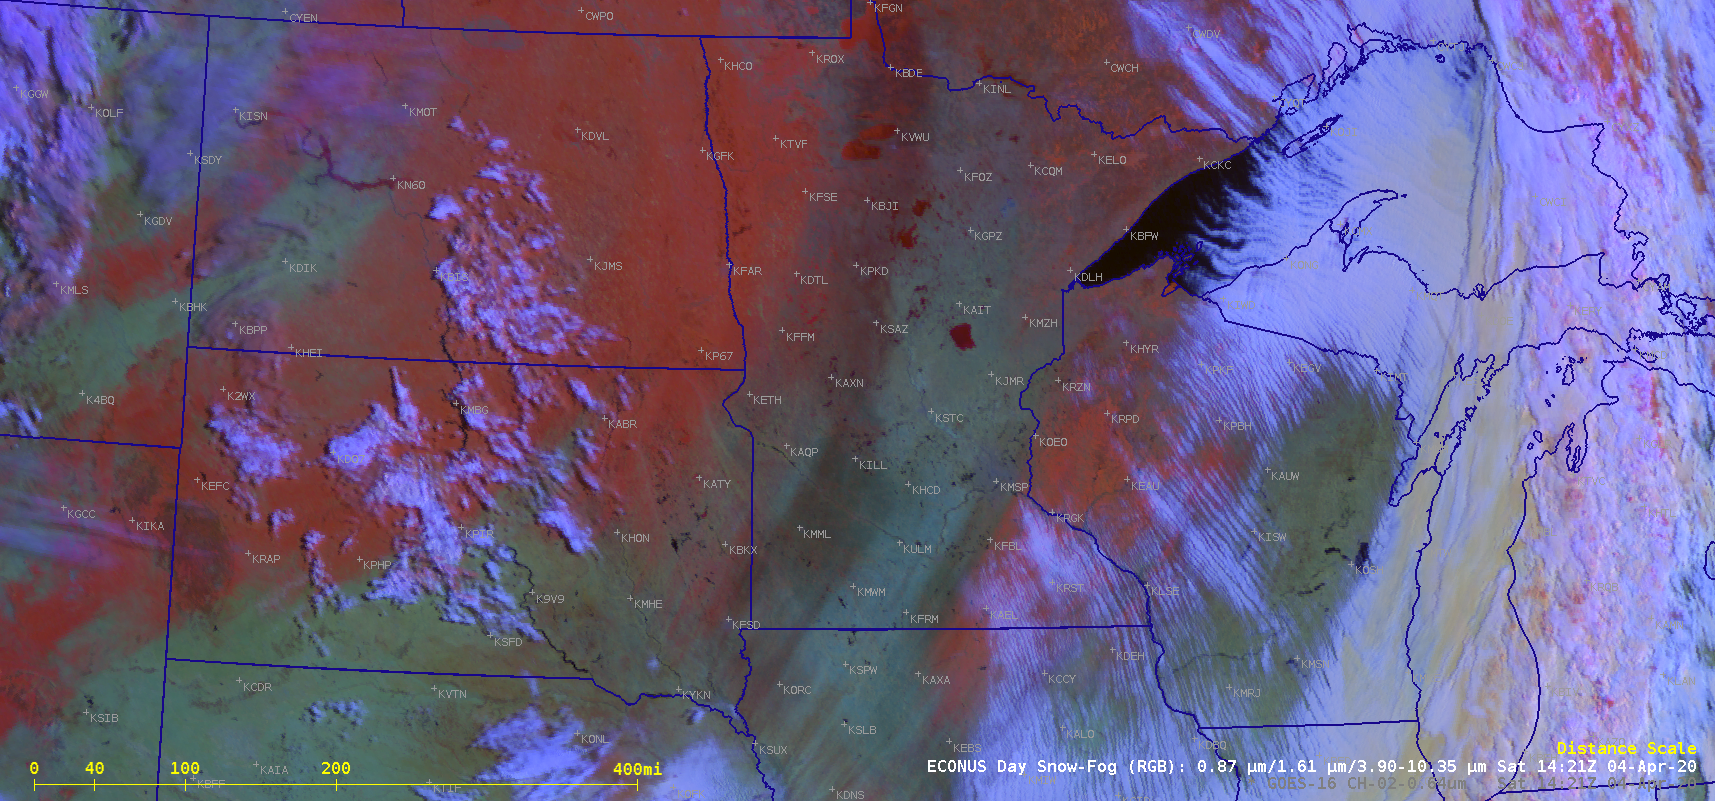
![GOES-16 "Red" Visible (0.64 µm) and Day Snow Fog RGB images [click to play animation | MP4]](https://cimss.ssec.wisc.edu/satellite-blog/images/2020/04/200404_goes16_visible_daySnowFogRGB_Upper_Midwest_ice_acretion_anim.gif)
