Hydroestimator rainfall values for the 24 hours ending 1200 UTC on 9 March 2021 (Click to enlarge)
The system that produced the high-impact flooding event on Maui (discussed here) also caused flooding rains on Oahu on the 9th. (A Flash Flood Emergency was declared at 348 HST on 9 March: Link) How well did quantitative satellite estimates of this event perform? Hydroestimator values, above, from the 24 hours ending 1200 UTC on 9 March (from this website) show isolated maxima over northern Oahu for and over eastern Maui. Daily totals for the 24 hours ending 1200 UTC on 10 March are shown below. Again, heavy rain is diagnosed on Maui with lesser amounts over Oahu, where 48-hour totals were between 150 and 200 mm.
Hydroestimator rainfall values for the 24 hours ending 1200 UTC on 10 March 2021 (Click to enlarge)
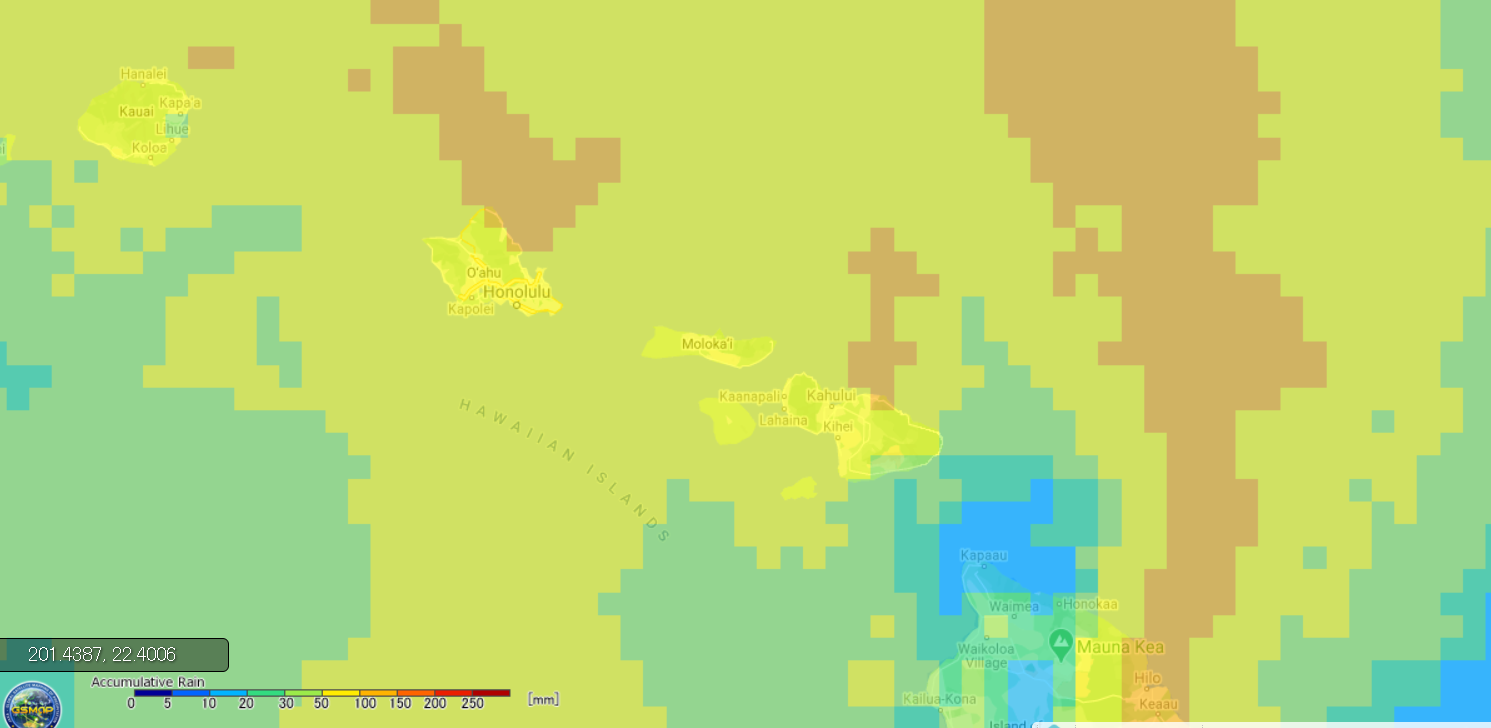
GSMAP rain totals for the 24 hours ending 0000 UTC on 10 March 2021 (click to enlarge)
24-hour totals from JAXA’s GsMAP website, above, show large values mostly north of Oahu, and also just north of Maui. Values are between 100-150 mm. 24-hour CMORPH-2 values (from RealEarth), below, ending 0000 UTC on 10 March, show values between 50 and 100 mm. Values over Maui are less than 50 mm.
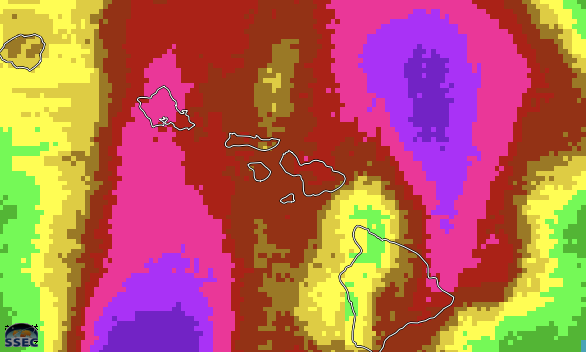
CMORPH-2 24-h precipitation ending 0000 UTC on 10 March 2021 (Click to enlarge)
The GOES-17 Enterprise algorithm totals, below (courtesy Bob Kuligowski, NOAA) , show values close to 50 mm over Oahu, and over 50 mm on Maui.
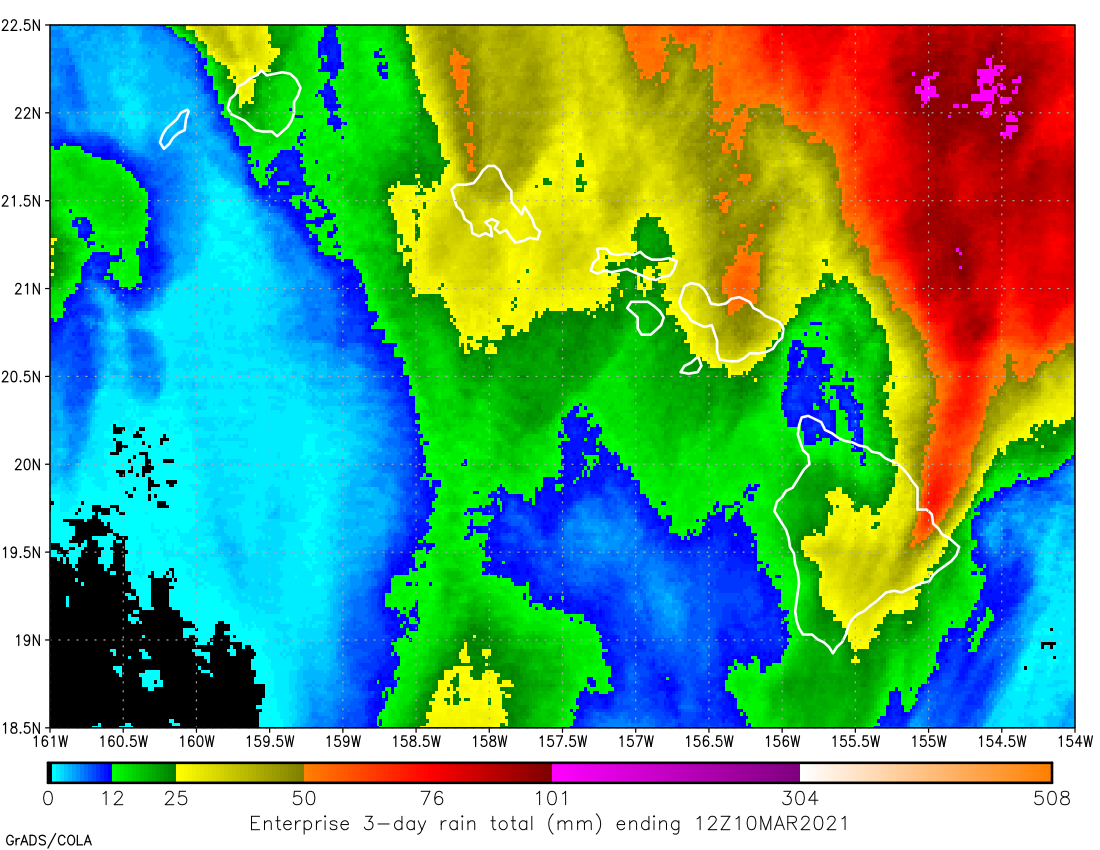
24-hour rain totals from the GOES-17 algorithm, 1200 UTC on 10 March 2021 (Click to enlarge)
None of these rain totals captured the exceptional nature (writeup is here; some totals are here) of this orographically enhanced rainfall. The widespread nature of the rain was captured however. All methods detected heaviest rain north of the Island chain.
GOES-17 animations, both visible and infrared, combined with situational awareness driven by animations of total precipitable water, such as that below (from this site) will help a forecaster anticipate heavy rains however — when they might start, and when they might end.

10-day rocking animation, 0000 UTC 28 February 2021 to 2300 UTC 10 March 2021 (and back) (Click to enlarge)
View only this post Read Less
![GOES-17 “Red” Visible (0.64 µm) and “Clean” Infrared Window (10.35 µm) images [click to play animation | MP4]](https://cimss.ssec.wisc.edu/satellite-blog/images/2021/03/210308_goes17_visible_infrared_HI_anim.gif)
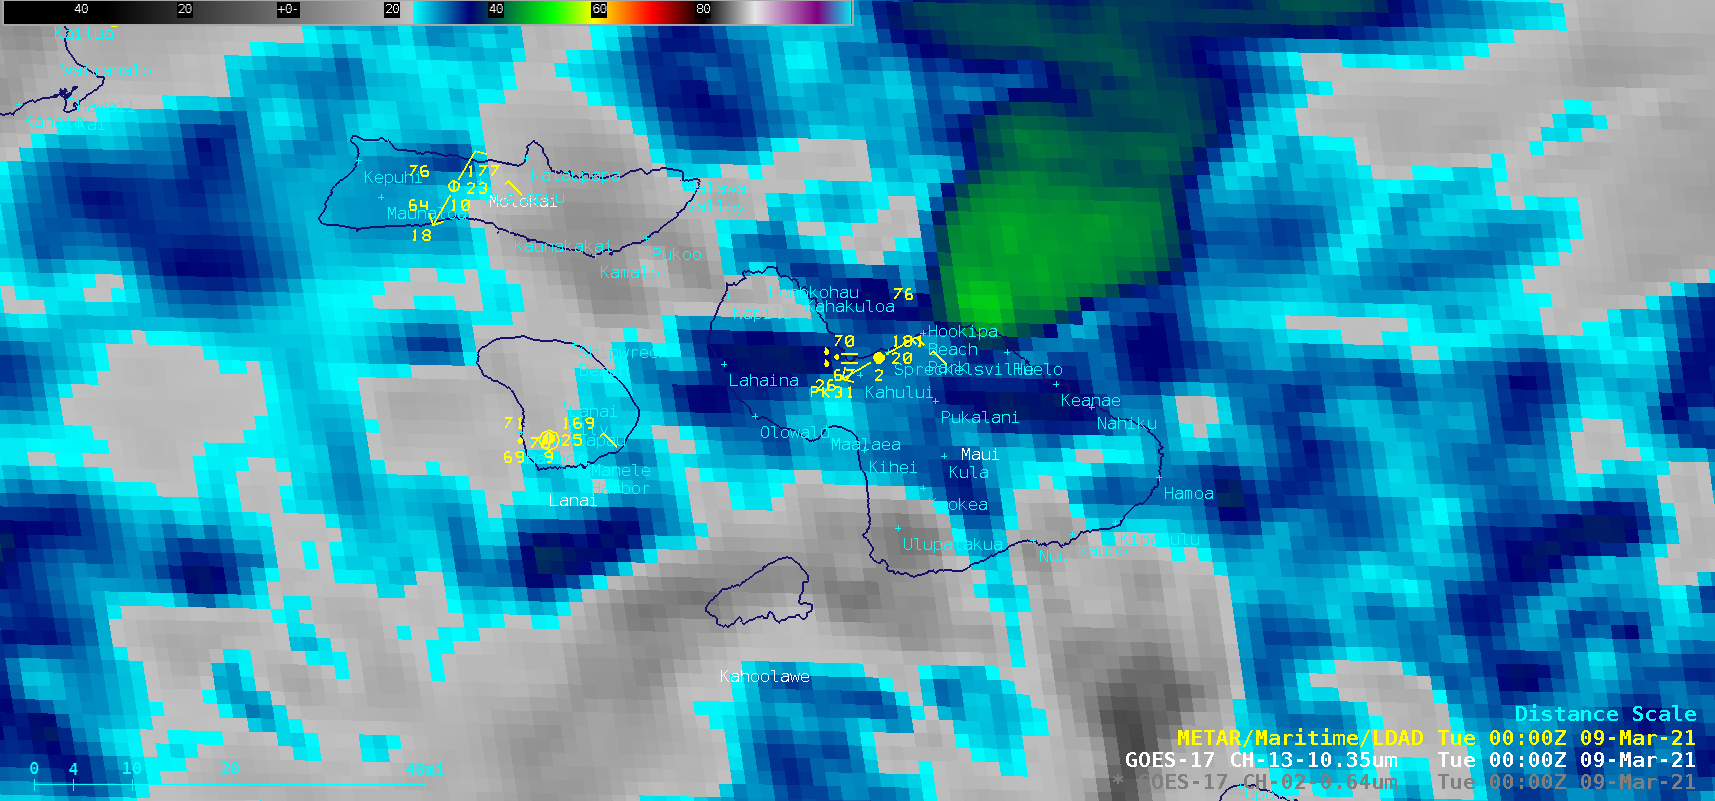
![GOES-17 “Red” Visible (0.64 µm) and “Clean” Infrared Window (10.35 µm) images at 0000 UTC on 09 March [click to enlarge]](https://cimss.ssec.wisc.edu/satellite-blog/images/2021/03/210309_0000utc_goes17_visible_infrared_HI_anim.gif)
![GOES-17 “Red” Visible (0.64 µm) and “Clean” Infrared Window (10.35 µm) images [click to play animation | MP4]](https://cimss.ssec.wisc.edu/satellite-blog/images/2021/03/210308_goes17_visible_infrared_HI_zoom_anim.gif)
![Hydrograph for the Honopau Stream near Huelo [click to enlarge]](https://cimss.ssec.wisc.edu/satellite-blog/images/2021/03/210309_hpoh1_hydrograph.png)
![Graph of West Wailuaiki rain gauge accumulation [click to enlarge]](https://cimss.ssec.wisc.edu/satellite-blog/images/2021/03/210308_210309_West_Waluaiki_Maui_rain_gauge.png)
![GOES-17 Water Vapor images, with plots of mid-upper level Derived Motion Winds [click to enlarge]](https://cimss.ssec.wisc.edu/satellite-blog/images/2021/03/210308_goes17_waterVapor_midUpperLevelWinds_EPacific_anim.gif)
![GOES-17 Water Vapor images, with contours of upper level divergence [click to enlarge]](https://cimss.ssec.wisc.edu/satellite-blog/images/2021/03/210308_goes17_waterVapor_upperLevelDivergence_EPacific_anim.gif)
![MIMIC Total Precipitable Water product [click to play animation | MP4]](https://cimss.ssec.wisc.edu/satellite-blog/images/2021/03/210307_210308_mimicTPW_East_Pacific_anim.gif)
![Plots of rawinsonde data from Hilo, Hawai'i [click to enlarge]](https://cimss.ssec.wisc.edu/satellite-blog/images/2021/03/210308_PHTO_RAOBS.GIF)
![GOES-16 “Red” Visible (0.64 µm) and Shortwave Infrared (3.9 µm) images [click to play animation | MP4]](https://cimss.ssec.wisc.edu/satellite-blog/images/2021/03/210307_goes16_visible_shortwaveInfrared_OK_AR_MO_fires_anim.gif)
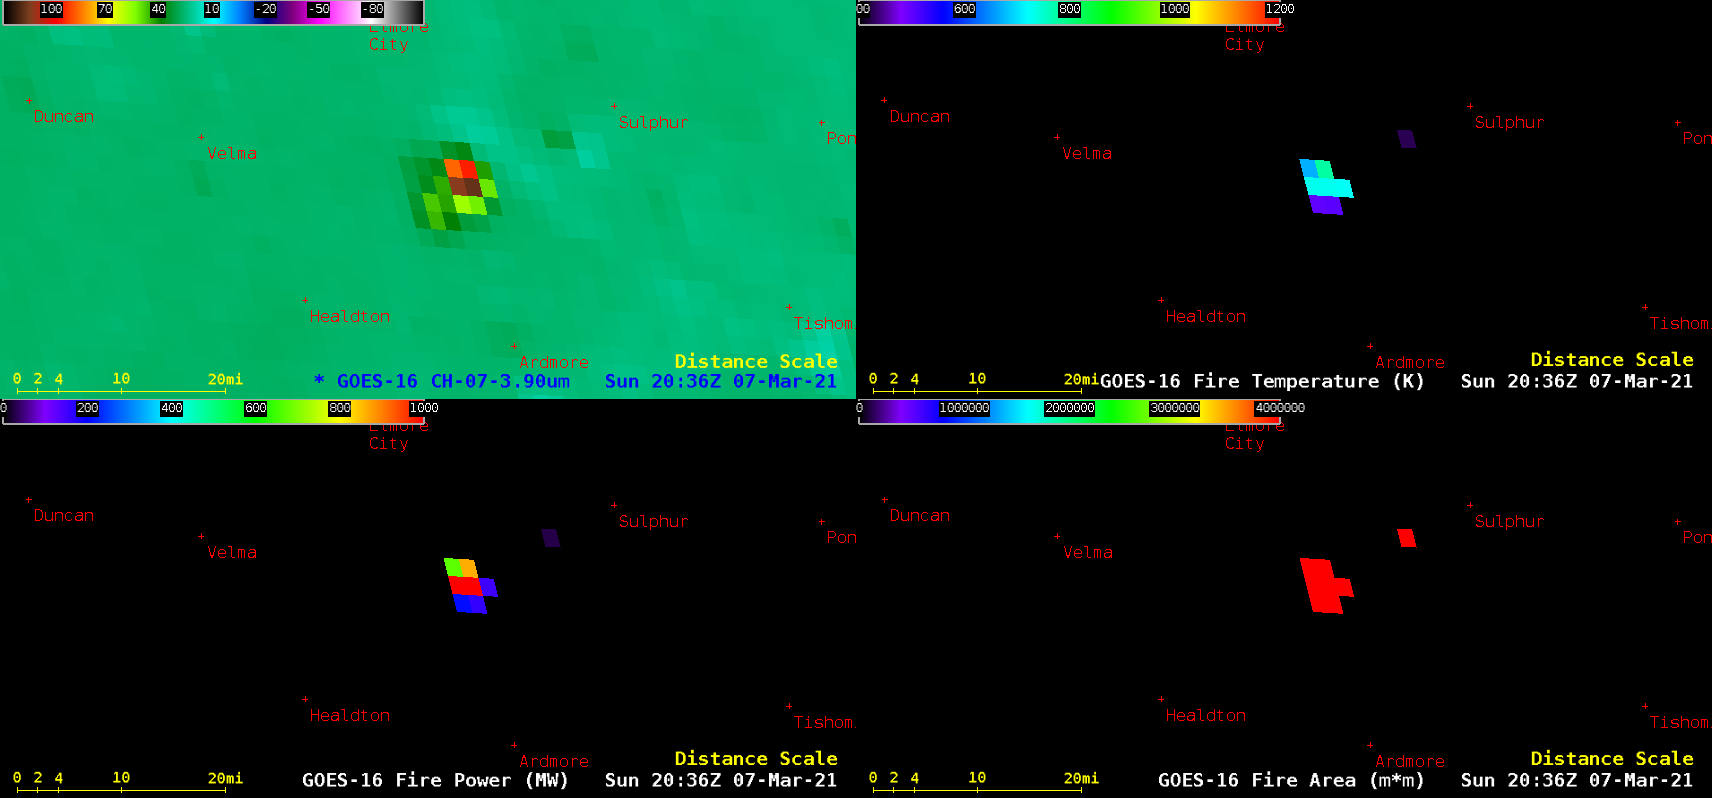
![GOES-16 Shortwave Infrared (3.9 µm, top left), Fire Temperature (top right), Fire Power (bottom left) and Fire Area (bottom right) [click to play animation | MP4]](https://cimss.ssec.wisc.edu/satellite-blog/images/2021/03/210307_goes16_shortwaveInfrared_fireTemperature_firePower_fireArea_OK_anim.gif)
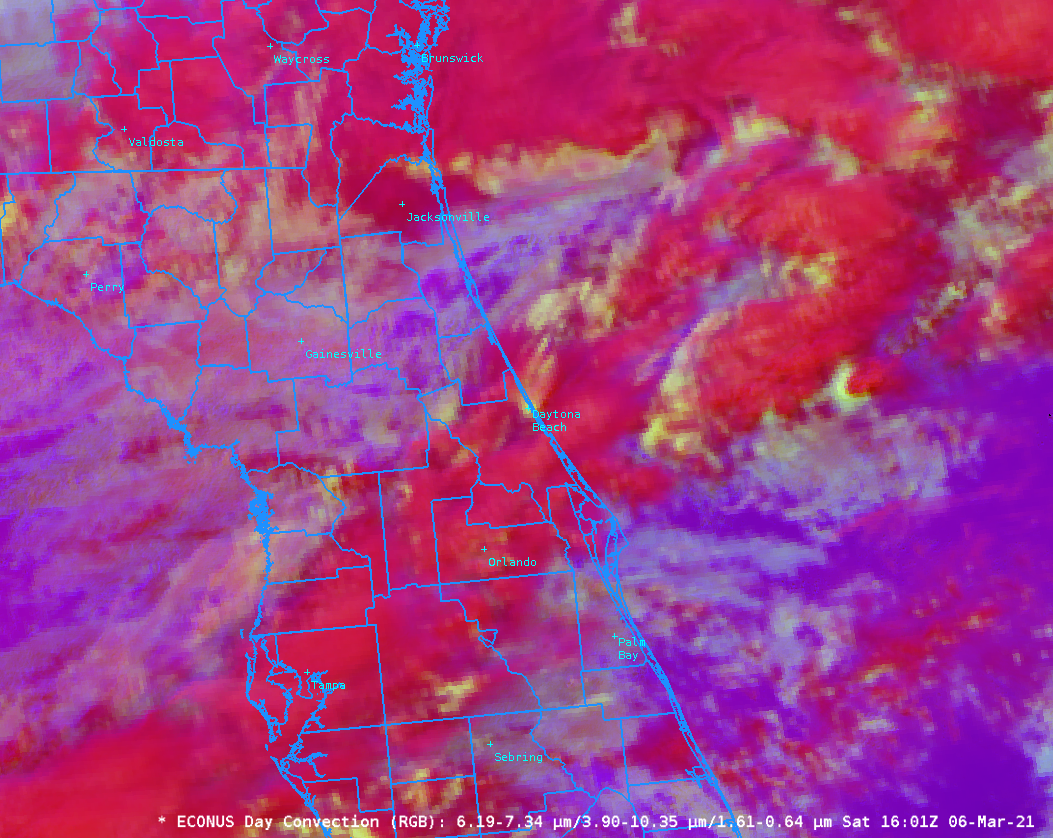
![GOES-16 True Color RGB images [click to play animation | MP4]](https://cimss.ssec.wisc.edu/satellite-blog/images/2021/03/210307_goes16_trueColorRGB_US_smoke_plumes_anim.gif)

