1-minute Mesoscale Domain Sector GOES-16 (GOES-East) “Red” Visible (0.64 µm) and “Clean” Infrared Window (10.35 µm) images (above) showed an interesting contrast in the character of Above-Anvil Cirrus Plumes (reference | VISIT training) over central Texas just before sunset on 02 June 2021. The northernmost AACP was generated by a single brief overshooting top (during the 0031-0041 UTC time period), but produced the most robust... Read More
![GOES-16 “Red” Visible (0.64 µm) and “Clean” Infrared Window (10.35 µm) images [click to play animation | MP4]](https://cimss.ssec.wisc.edu/satellite-blog/images/2021/06/tx_ir-20210603_003753.png)
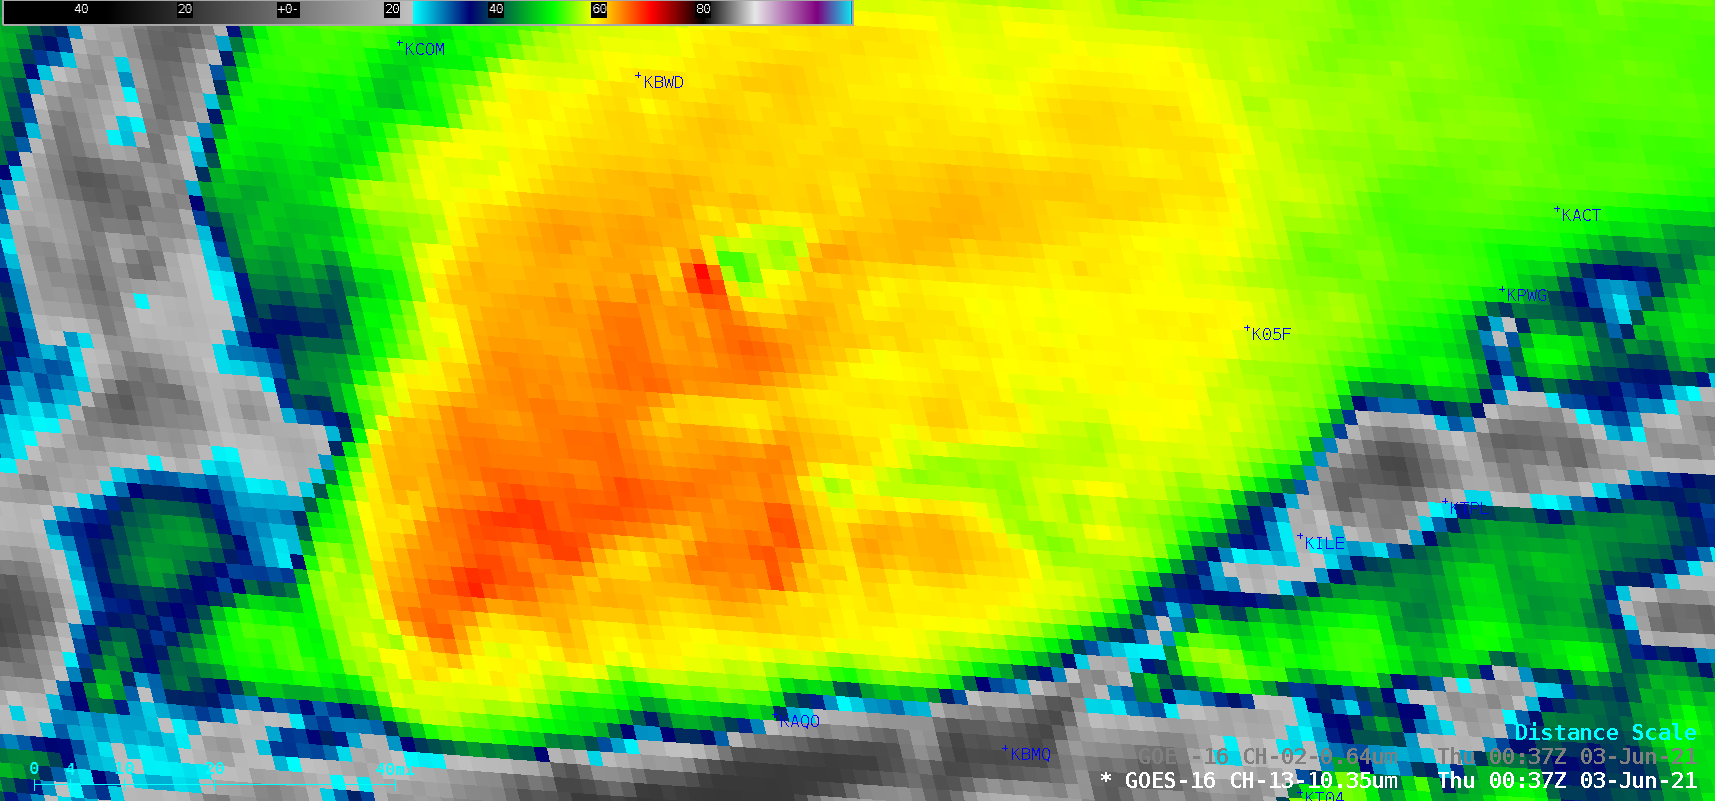
GOES-16 “Red” Visible (0.64 µm) and “Clean” Infrared Window (10.35 µm) images [click to play animation | MP4]
1-minute
Mesoscale Domain Sector GOES-16
(GOES-East) “Red” Visible (
0.64 µm)
and “Clean” Infrared Window (
10.35 µm) images
(above) showed an interesting contrast in the character of Above-Anvil Cirrus Plumes (
reference |
VISIT training) over central Texas just before sunset on
02 June 2021. The northernmost AACP was generated by a single brief overshooting top (during the 0031-0041 UTC time period), but produced the most robust “warm”
(brighter shades of green) plume signature in the Infrared imagery. Other AACP signatures could be seen in the southern portion of that mesoscale convective system, but none of them exhibited such a notable warm infrared signature (in spite of prolonged periods of pulsing overshooting tops).
![GOES-16 “Red” Visible (0.64 µm) and “Clean” Infrared Window (10.35 µm) images at 0034 UTC [click to enlarge]](https://cimss.ssec.wisc.edu/satellite-blog/images/2021/06/210603_0034utc_goes16_visible_infrared_TX_aacp_-71.0C_anim.gif)
GOES-16 “Red” Visible (0.64 µm) and “Clean” Infrared Window (10.35 µm) images at 0034 UTC [click to enlarge]
The coldest cloud-top infrared brightness temperature of the brief overshooting top was -71ºC at 0034 .UTC
(above) — soon afterward, the infrared brightness temperatures within the “warm wake” immediately downwind of the overshooting top were generally in the -51ºC to -55ºC range, highlighted by the brighter green enhancement
(below).
![GOES-16 “Red” Visible (0.64 µm) and “Clean” Infrared Window (10.35 µm) images at 0050 UTC [click to enlarge]](https://cimss.ssec.wisc.edu/satellite-blog/images/2021/06/210603_0050utc_goes16_visible_infrared_TX_aacp_anim.gif)
GOES-16 “Red” Visible (0.64 µm) and “Clean” Infrared Window (10.35 µm) images at 0050 UTC [click to enlarge]
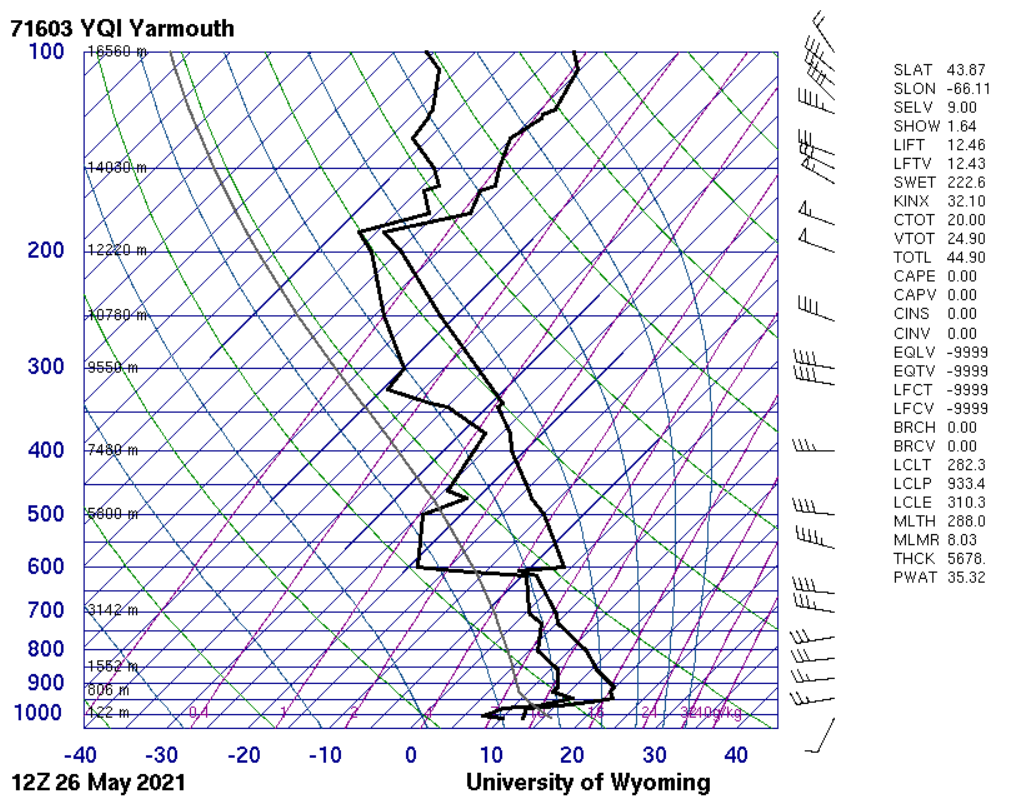
A plot of 00 UTC rawinsonde data from Midland, Texas
(below) indicated that the -71ºC overshooting top brightness temperature corresponded to a Most Unstable air parcel ascent of about 1 km beyond its Equilibrium Level. The warming temperature within the lower stratosphere (just above the tropopause / equilibrium level) was also apparent.
![Plot of 00 UTC rawinsonde data from Midland, Texas [click to enlarge]Plot of 00 UTC rawinsonde data from Midland, Texas [click to enlarge]](https://cimss.ssec.wisc.edu/satellite-blog/images/2021/06/210603_00utc_kmaf_raob.png)
Plot of 00 UTC rawinsonde data from Midland, Texas [click to enlarge]
It should be mentioned that not all Above-Anvil Cirrus Plumes exhibit a
warmer signature on Infrared imagery — depending on the ambient temperature profile just above the tropopause / equilibrium level, some plumes can appear
colder (for example:
Nov 2018,
Sep 2019 and
May 2020)
View only this post
Read Less
![GOES-16 “Red” Visible (0.64 µm) and “Clean” Infrared Window (10.35 µm) images [click to play animation | MP4]](https://cimss.ssec.wisc.edu/satellite-blog/images/2021/06/210602_goes16_visible_infrared_TX_aboveAnvilCirrusPlume_anim.gif)
![GOES-17 “Red” Visible (0.64 um) images [click to play animation | MP4]](https://cimss.ssec.wisc.edu/satellite-blog/images/2021/05/210528_goes17_visible_AK_ice_anim.gif)
![Plot of tide height at Unalakeet, Alaska on 28 May [click to enlarge]](https://cimss.ssec.wisc.edu/satellite-blog/images/2021/05/210528_Unalakeet_AK_tide.png)
![Suomi NPP VIIRS Visible (0.64 µm), Shortwave Infrared (3.74 µm) and Infrared Window (11.45 µm) images [click to enlarge]](https://cimss.ssec.wisc.edu/satellite-blog/images/2021/05/210528_suomiNPP_visible_shortwaveInfrared_infraredWindow_AK_aircraft_dissipation_trail_anim.gif)
![GOES-17 Day Cloud Phase Distinction RGB images [click to play animation | MP4]](https://cimss.ssec.wisc.edu/satellite-blog/images/2021/05/210528_goes17_dayCloudPhaseDistinction_AK_aircract_disspiation_trail_2_anim.gif)
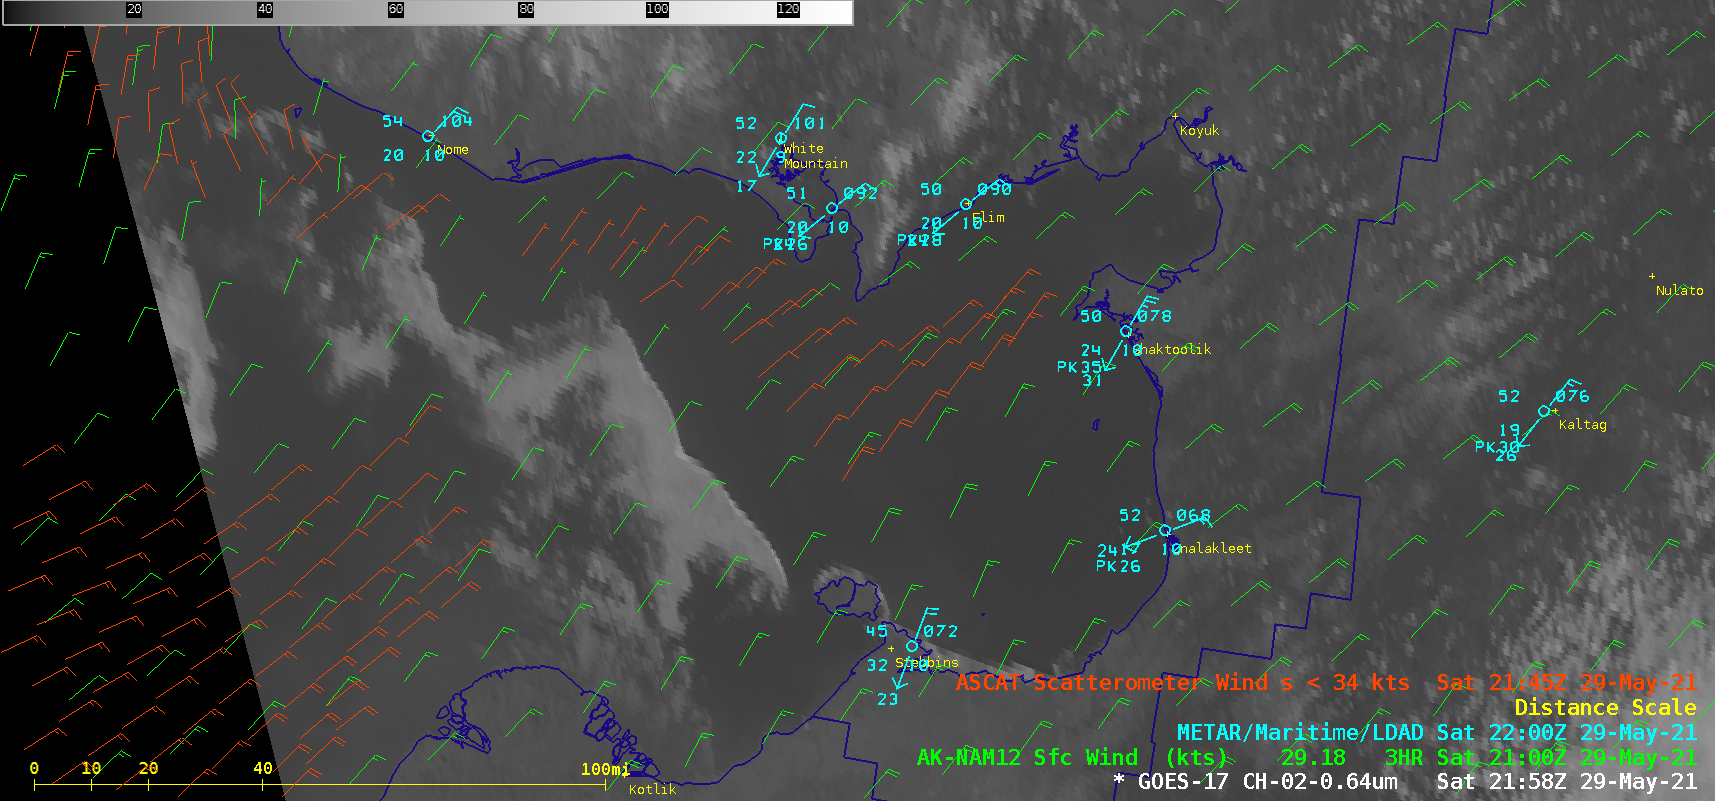
![GOES-17 “Red” Visible (0.64 um) images, with plots of NAM12 model winds (green barbs) and Metop-A ASCAT winds (red bars) [ click to play animation | MP4]](https://cimss.ssec.wisc.edu/satellite-blog/images/2021/05/210529_goes17_visible_Norton_Sound_AK_ice_anim.gif)
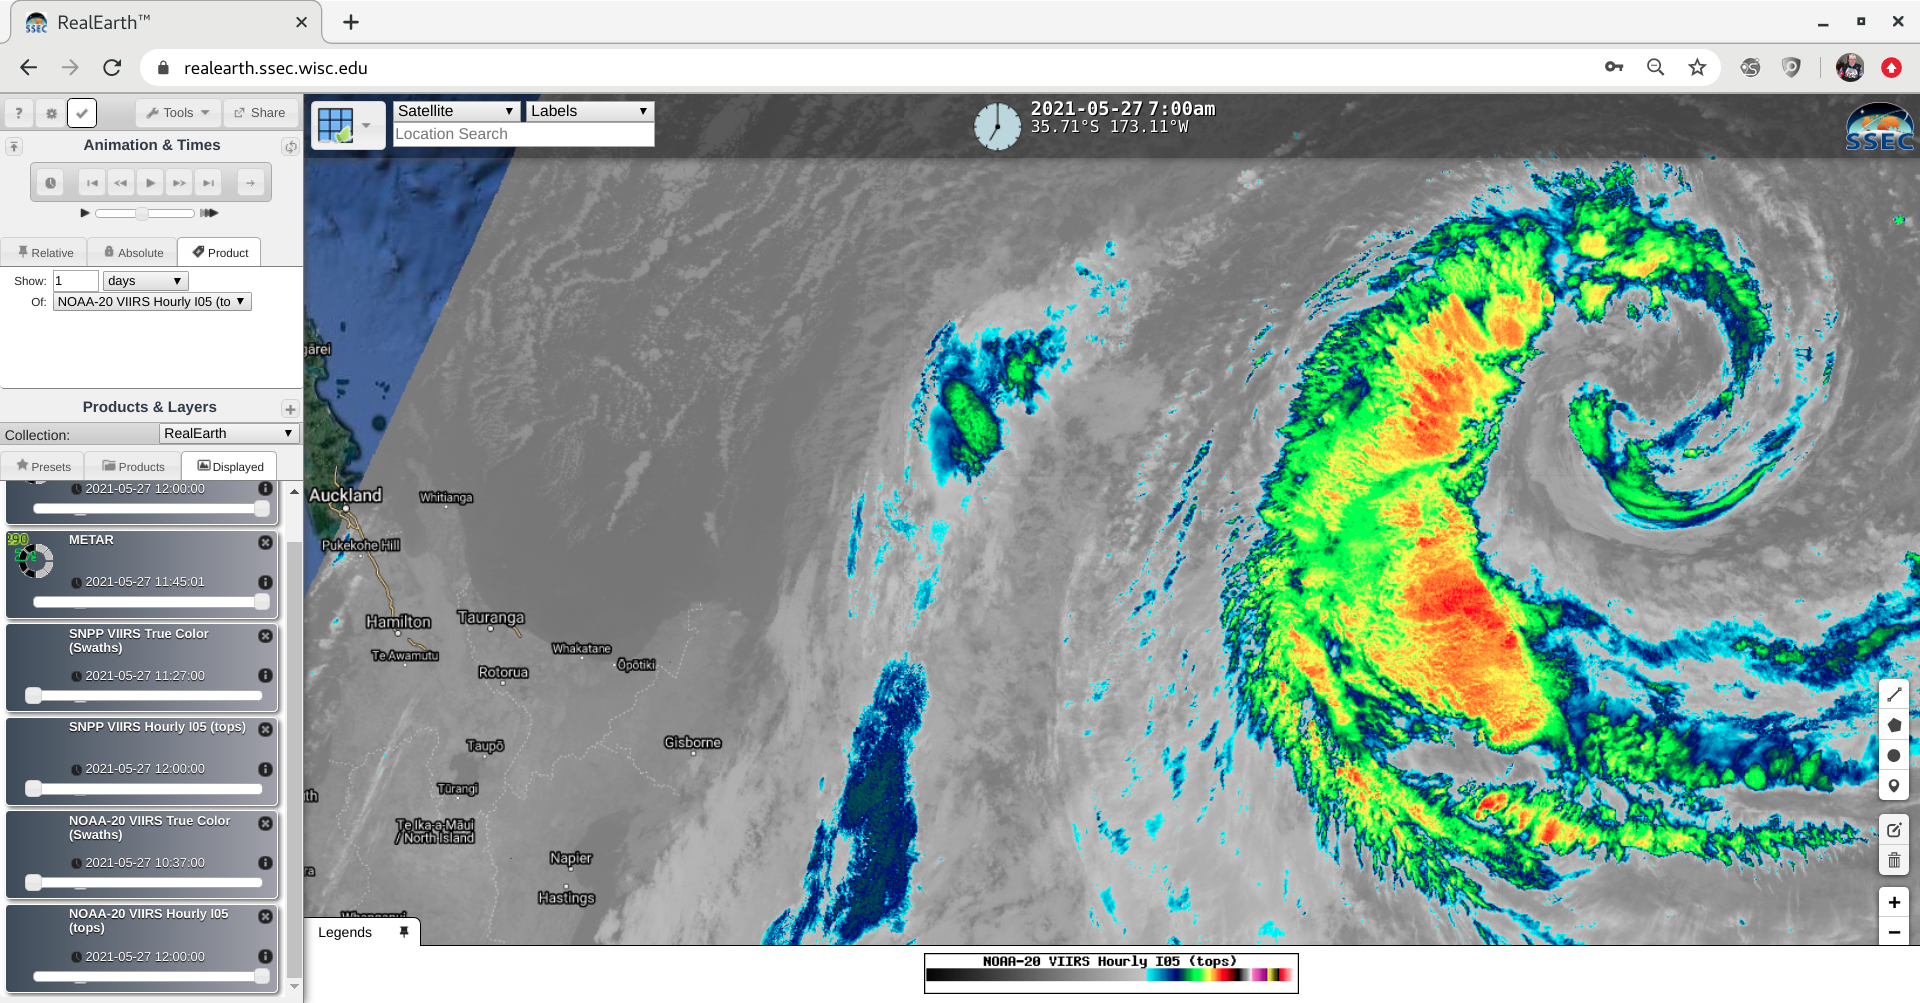
![GOES-17 "Clean" Infrared Window (10.3 um) images [click to play animation | MP4]](https://cimss.ssec.wisc.edu/satellite-blog/images/2021/05/210527_goes17_infrared_South_Pacific_subtropical_storm_anim.gif)
![NOAA-20 Infrared Window (11.45 um) image [click to enlarge]](https://cimss.ssec.wisc.edu/satellite-blog/images/2021/05/210527_1205utc_noaa20_viirs_infrared_NZ_subtropical_storm.png)
![Suomi NPP VIIRS Day/Night Band (0.7 um) image [click to enlarge]](https://cimss.ssec.wisc.edu/satellite-blog/images/2021/05/nz_sts_snpp_dnb-20210527_122909.png)
![Cross section of Suomi NPP ATMS Brightness Temperature anomaly [click to enlarge]](https://cimss.ssec.wisc.edu/satellite-blog/images/2021/05/210527_1256utc_suomiNPP_atms_btAnomaly_xsect_NZ_subtropical_storm.gif)
