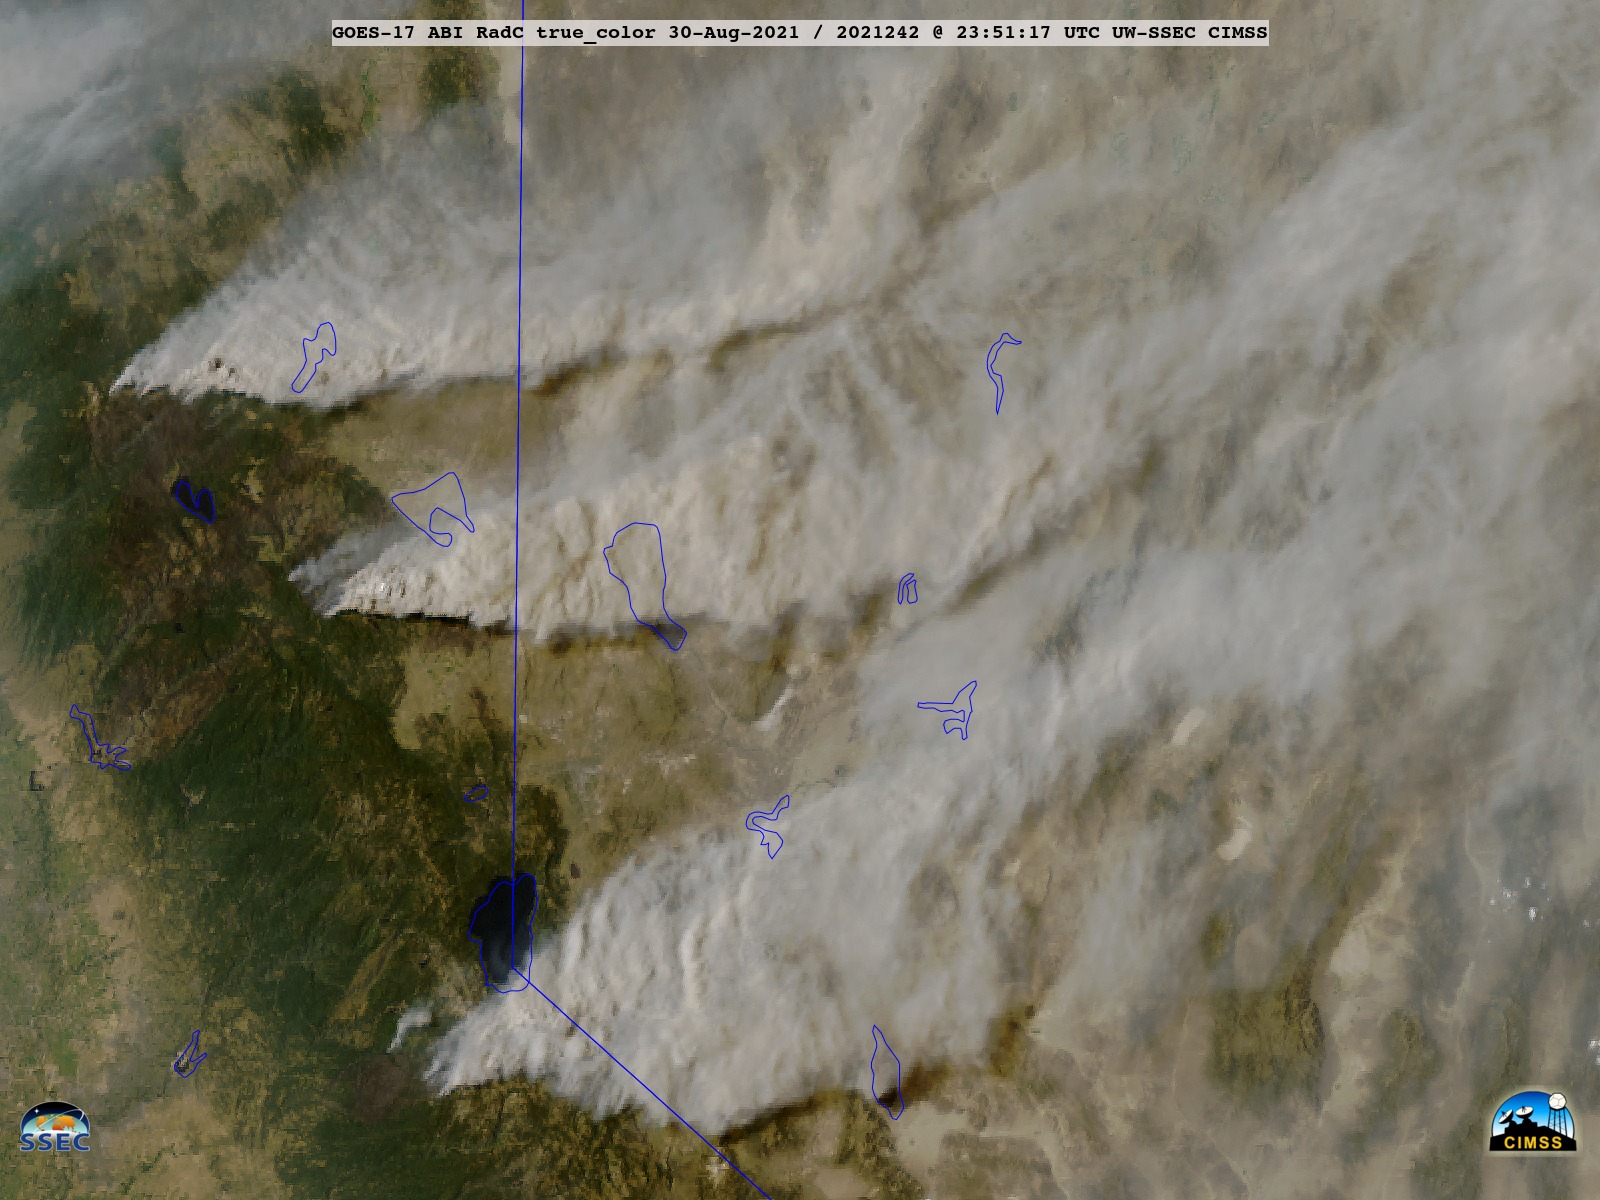

GOES-17 True Color RGB images [click image to play animation | MP4]
GOES-17 (GOES-West) True Color RGB images created using Geo2Grid (above) showed the diurnal variation of smoke from the Dixie Fire and the Caldor Fire in Northern California on 30 August 2021. Early in the day, smoke from the previous day of fire activity that had settled into valleys was apparent — however, as daytime heating continued this valley smoke was ventilated and mixed to higher altitudes, with new smoke plumes eventually developing as the fire activity ramped up once again. Occasional brighter-white pyrocumulus clouds were produced over the hottest portion of the larger fires.
===== 31 August Update =====

GOES-17 True Color RGB images [click image to play animation | MP4]
GOES-17 (GOES-West) True Color RGB images created using Geo2Grid (above) showed the diurnal variation of smoke from the Dixie Fire, Caldor Fire and Tamarack Fire in Northern California on 31 August 2021. Early in the day, smoke from the previous day of fire activity that had settled into valleys was evident — but as daytime heating continued, this valley smoke was ventilated and mixed to higher altitudes, with new smoke plumes eventually developing as the fire activity ramped up once again. Occasional brighter-white pyrocumulus clouds were produced by the larger, hotter fires.
In a toggle between Suomi NPP VIIRS True Color RGB and False Color RGB images (below), recent fire burn scars appear as darker shades of reddish-brown while currently active and hot fires appear as brighter shades of pink in the False Color image.
Suomi NPP VIIRS True Color RGB and False Color RGB images [click to enlarge]
Suomi NPP VIIRS False Color RGB images 5 days apart — 26 August and 31 August — (below) revealed changes in fire burn scar size and active fire locations across that region.
Suomi NPP VIIRS False Color RGB images on 26 August and 31 August [click to enlarge]
A closer view of Suomi NPP VIIRS True Color RGB and False Color RGB mages centered on the Caldor Fire (below) showed that a large active fire was located just a few miles south of South Lake Tahoe, California.
Suomi NPP VIIRS True Color RGB and False Color .RGB images [click to enlarge]
View only this post Read Less


