This website works best with a newer web browser such as Chrome, Firefox, Safari or Microsoft
Edge. Internet Explorer is not supported by this website.
GOES-17 (GOES-West) Dust RGB and Ash RGB images (above) revealed a plume of resuspended volcanic ash — from the 1912 eruption of Novarupta-Katmai — moving southeastward across the Shelikof Strait toward Kodiak Island in southern Alaska on 02 October 2021. The remnant ash on the surface was lofted by strong northwesterly winds... Read More
GOES-17 Dust RGB and Ash RGB images [click to play animation | MP4]
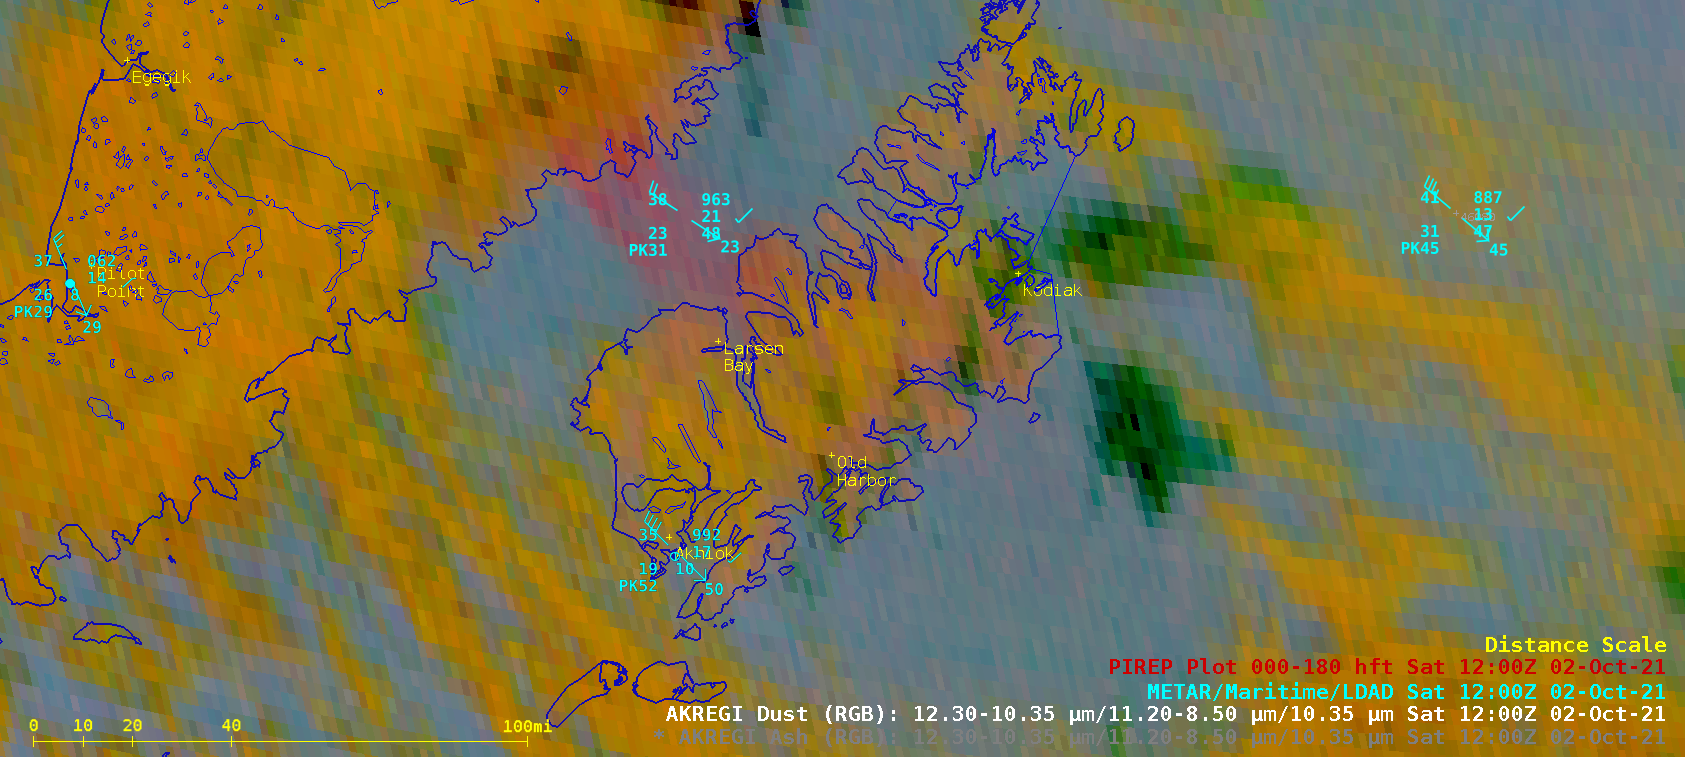
GOES-17 (GOES-West)Dust RGB and Ash RGB images (above) revealed a plume of resuspended volcanic ash — from the 1912 eruption of Novarupta-Katmai — moving southeastward across the Shelikof Strait toward Kodiak Island in southern Alaska on 02 October 2021. The remnant ash on the surface was lofted by strong northwesterly winds along the rear edge of Hurricane Force and Storm Force lows in the Gulf of Alaska (surface analyses), and imagery suggested that the ash plume (shades of pink to magenta) began to develop just after 0600 UTC. At Buoy 46077 in the Shelikof Strait, a peak wind gust of 35 knots occurred around 14 UTC.
Both RGB image combinations use the same ABI spectral bands, but in this case the plume of airborne ash showed up a bit better on the Dust RGB (below) because of how the 3 components of that RGB are scaled.
GOES-17 Dust RGB and Ash RGB images at 1200 UTC [click to enlarge]
Alexa Ross, a scientist at CIMSS (and CIMSS Blog contributor) has created a Matlab program that reads in NUCAPS EDR data from any Direct Broadcast datastream (here, for example), or from NOAA CLASS, and creates color-coded plots at NUCAPS data levels (that is, at any one of the 100 pressure levels used in... Read More
NOAA-20 NUCAPS Temperature values at 853 mb, 1817-1819 UTC on 01 October 2021 (Click to enlarge)
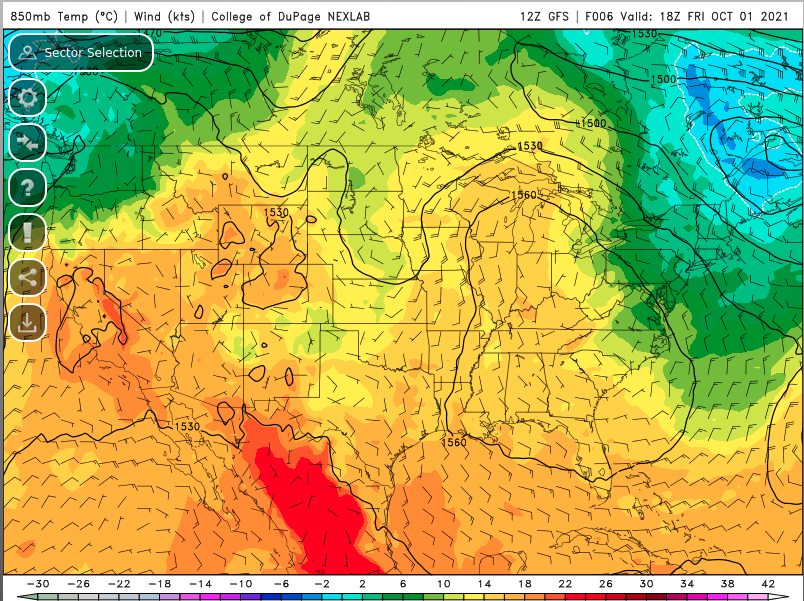
Alexa Ross, a scientist at CIMSS (and CIMSS Blog contributor) has created a Matlab program that reads in NUCAPS EDR data from any Direct Broadcast datastream (here, for example), or from NOAA CLASS, and creates color-coded plots at NUCAPS data levels (that is, at any one of the 100 pressure levels used in the Radiative Transfer Model that drives the retrieval). Output from the program for four separate granules between 1817 and 1819 UTC is shown above. Temperatures are notably warmer over land than over the Atlantic Ocean, a temperature distribution in agreement with GFS model output (GFS model imagery from the College of Dupage website).
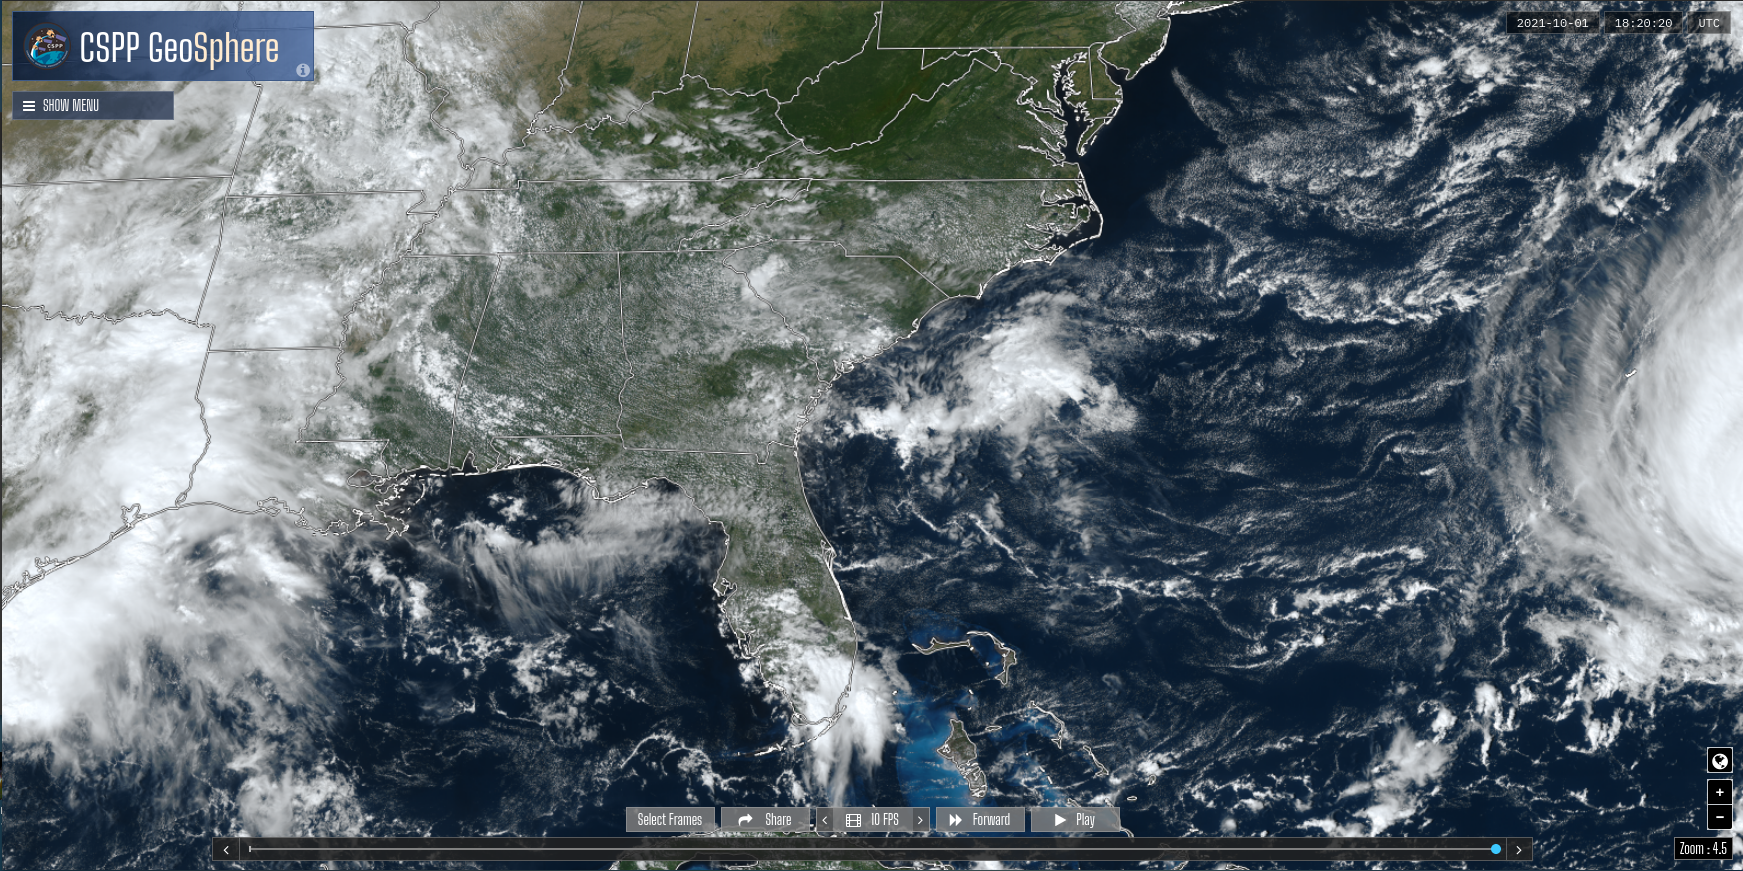
This program does not (as yet) indicate whether or not the retrieved profile has converged to a solution. It is up to a user to apply some quality control to the data. The very warm pixel at 1817 UTC over the Atlantic Ocean, for example, looks suspect. Cloud imagery is an important tool for anticipating whether a retrieval will converge — click here to see an 1820 UTC GOES-16 True-Color imagery over the scene, taken from the CSPP Geosphere site.
Gridded NUCAPS (available from this NASA SPoRT website) can also be used to view the horizontal distribution of temperatures across the NUCAPS data swath. The toggle below shows the 850-mb Temperature field and also the Quality Control flags.
850-mb gridded NUCAPS temperatures and Quality Flags from the NOAA-20 overpass at ~1815 UTC on 1 October 2021 (Click to enlarge)
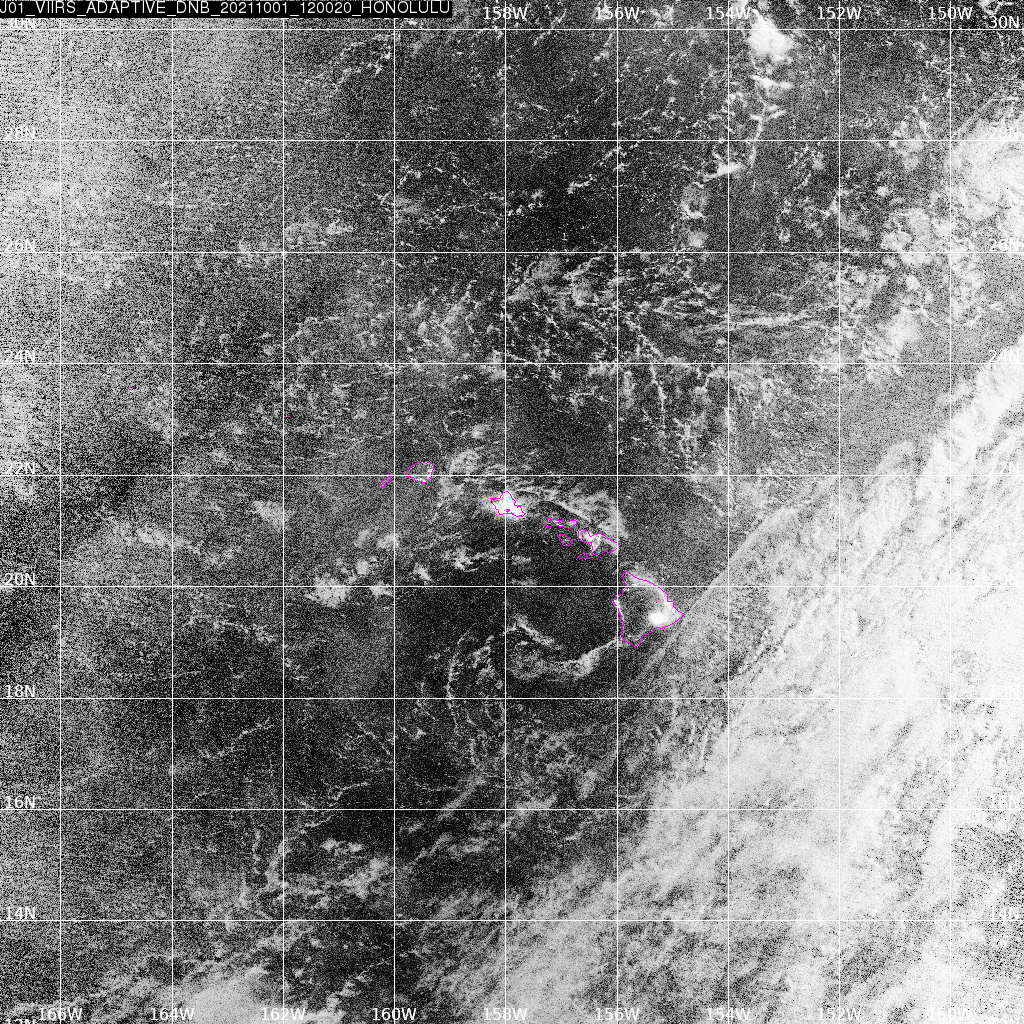
GOES-17 Shortwave Infrared imagery, above, shows the hot-spot associated with the latest eruptive phase of the Halema’uma’u Crater on Kilauea’s southern slope. (Click here for webcams).The Day Night band from VIIRS on board Suomi NPP and NOAA-20 show the light source from the eruption as well, as shown in the... Read More
GOES-17 Shortwave Infrared, 0126 – 1156 UTC on 1 October 2021 (Click to enlarge)
GOES-17 Shortwave Infrared imagery, above, shows the hot-spot associated with the latest eruptive phase of the Halema’uma’u Crater on Kilauea’s southern slope. (Click here for webcams).
The Day Night band from VIIRS on board Suomi NPP and NOAA-20 show the light source from the eruption as well, as shown in the toggle below (imagery from the Honolulu Direct Broadcast site, here)
VIIRS Day Night Band imagery from Suomi NPP (1111 UTC) and NOAA-20 (1200 UTC), 1 October 2021 (Click to enlarge)
The NOAA/CIMSS Volcanic Cloud Monitoring Web Portal (i.e., VOLCAT — link) include a Kilauea sector under the Washington DC VAAC tab; an imagery example is here.
FDCA — the Fire Detection and Characterization Algorithm — should have a signal here but does not. The landcover dataset used for the product is missing Hawaii. Fires aren’t looked for when land does not exist, even if its absence is in error. NOAA/NESDIS Scientists and their partners at CIMSS are working to correct this oversight.
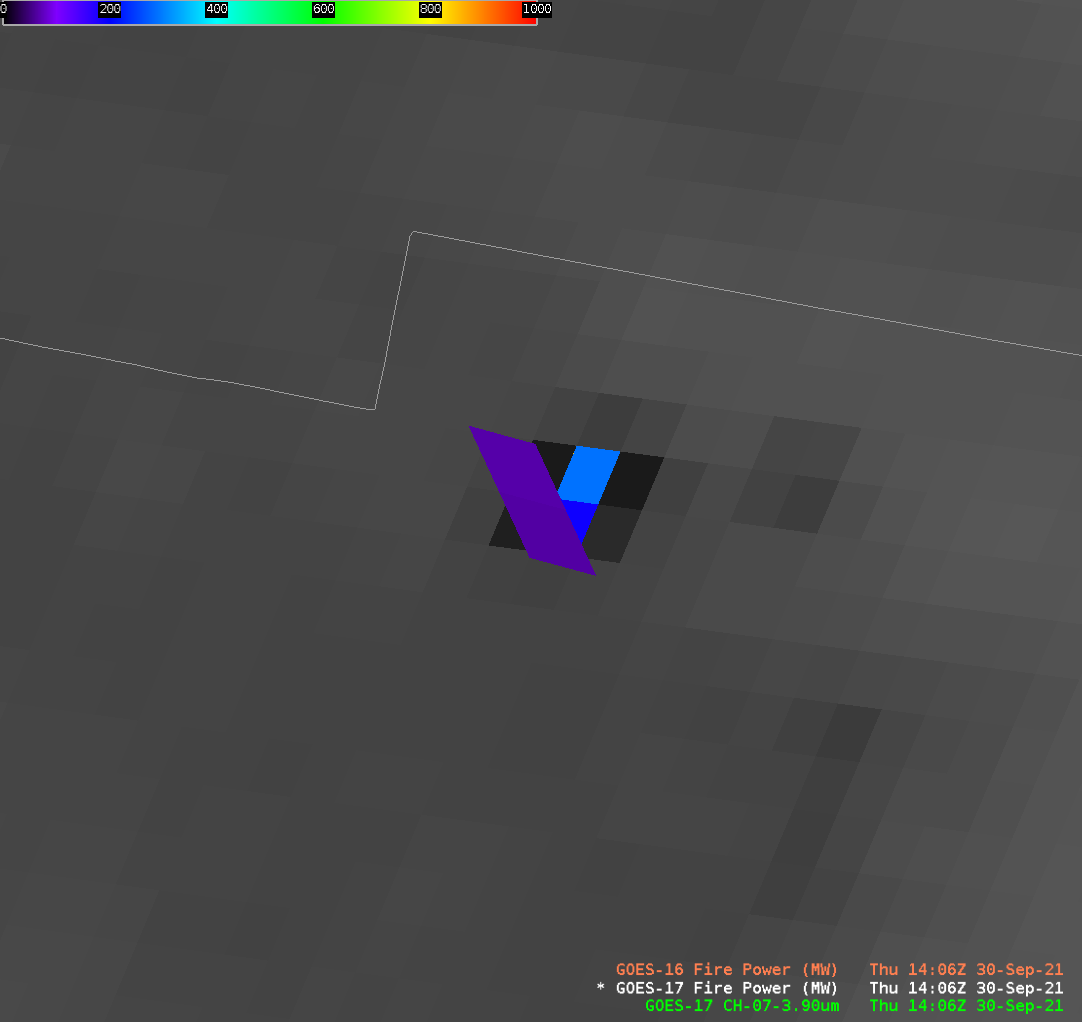
As of 1400 UTC on 30 September, GOES-17 Level 2 products are flowing into National Weather Service forecast offices via the Satellite Broadcast Network (SBN). An example of the improvement of GOES-17 v. GOES-16 is shown in the toggle above that samples the KNP Complex fire in Tulare County California (click here... Read More
GOES-17 Shortwave Infrared imagery (3.9 µm), GOES-17 Fire Power and GOES-16 Fire Power, 1406 UTC, 30 September 2021 (Click to enlarge)
As of 1400 UTC on 30 September, GOES-17 Level 2 products are flowing into National Weather Service forecast offices via the Satellite Broadcast Network (SBN). An example of the improvement of GOES-17 v. GOES-16 is shown in the toggle above that samples the KNP Complex fire in Tulare County California (click here for a toggle that is not so zoomed in!). The GOES-17 shortwave IR shows warm pixels associated with the fire; GOES-17 Fire Power aligns with the GOES-17 pixels, and show much larger values (approximately 3x greater) than the GOES-16 products from the same time.
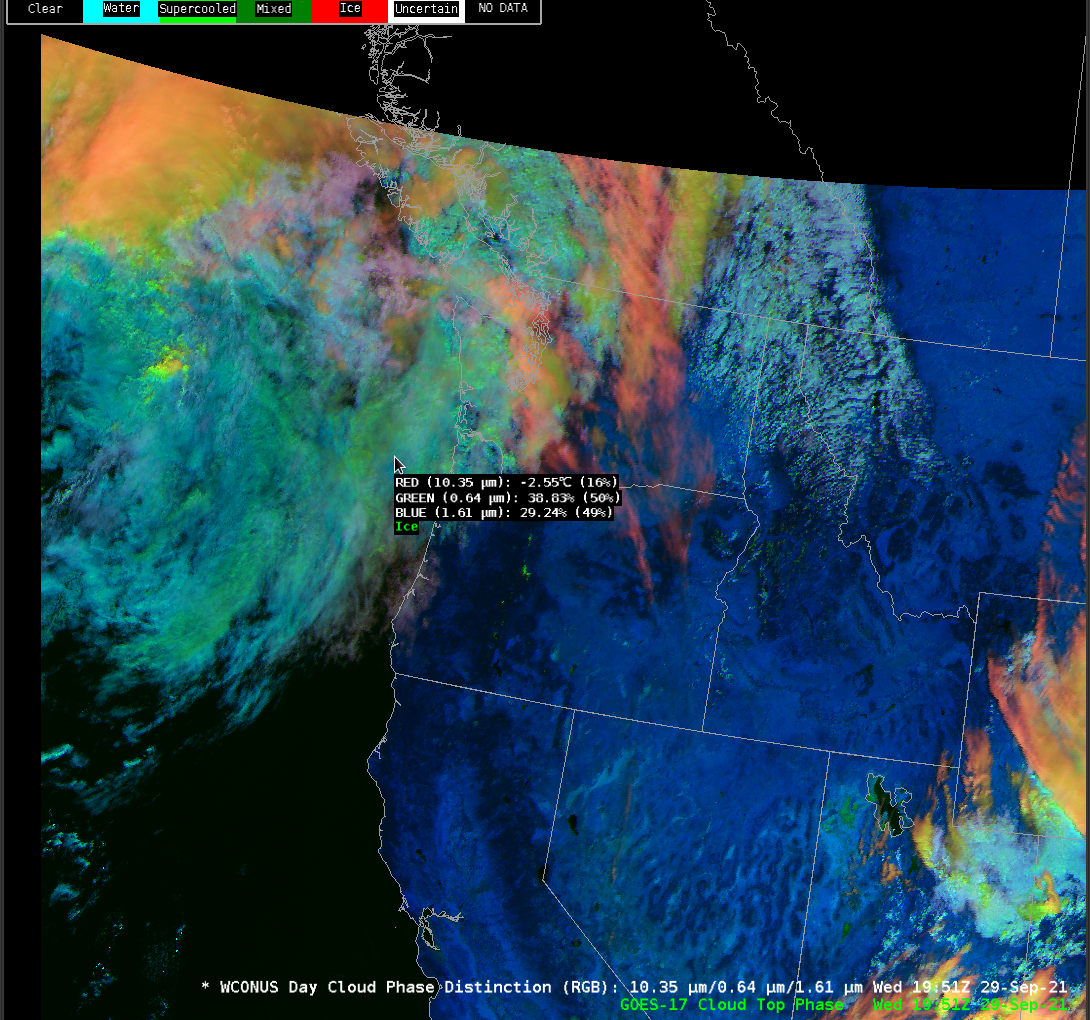
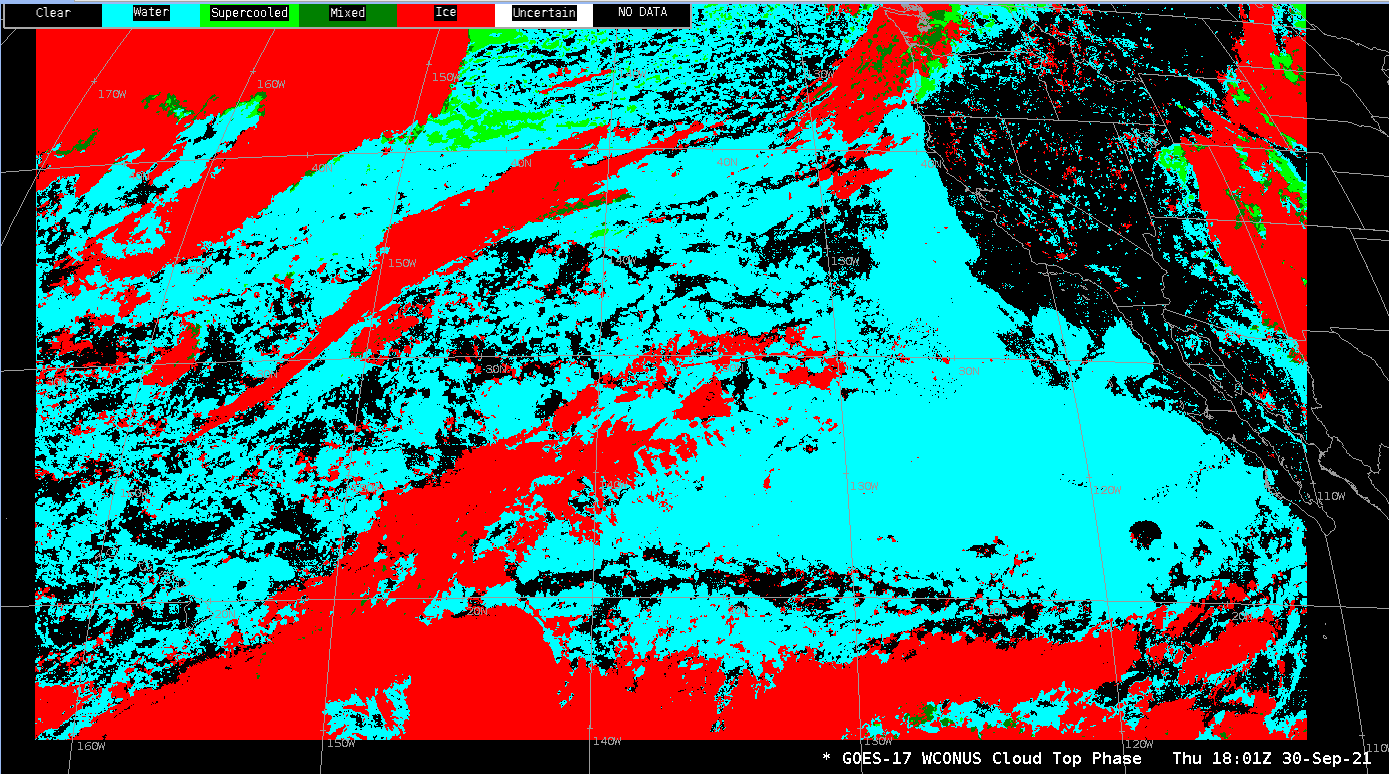
A further utility of Level 2 products is shown below, from 29 September. The Day Cloud Phase Distinction RGB includes ABI Band 5, the 1.61 ‘snow-ice’ band that indicates glaciation by a change in reflectance at that band. Thus, the color of the RGB can change where ice crystals are present. There is a Level 2 product, however, that computes what the phase most likely is, and that is shown in a toggle at 1951 UTC below. Visual inspection of an RGB may not be enough to ascertain cloud type, particularly on this day for the clouds off the coast of Oregon. A good practice is to load the Level 2 product underneath the image so that sampling can give a quantitative estimate, as shown at bottom.
Day Cloud Phase Distinction, 1731 – 1956 UTC on 29 September 2021 (Click to enlarge)Toggle between the GOES-17 Day Cloud Phase Distinction RGB and the level 2 Cloud Phase product, 1951 UTC on 29 September 2021 (Click to enlarge)GOES-17 Day Cloud Phase Distinction RGB with Cloud Phase beneath, sampled (Click to enlarge)
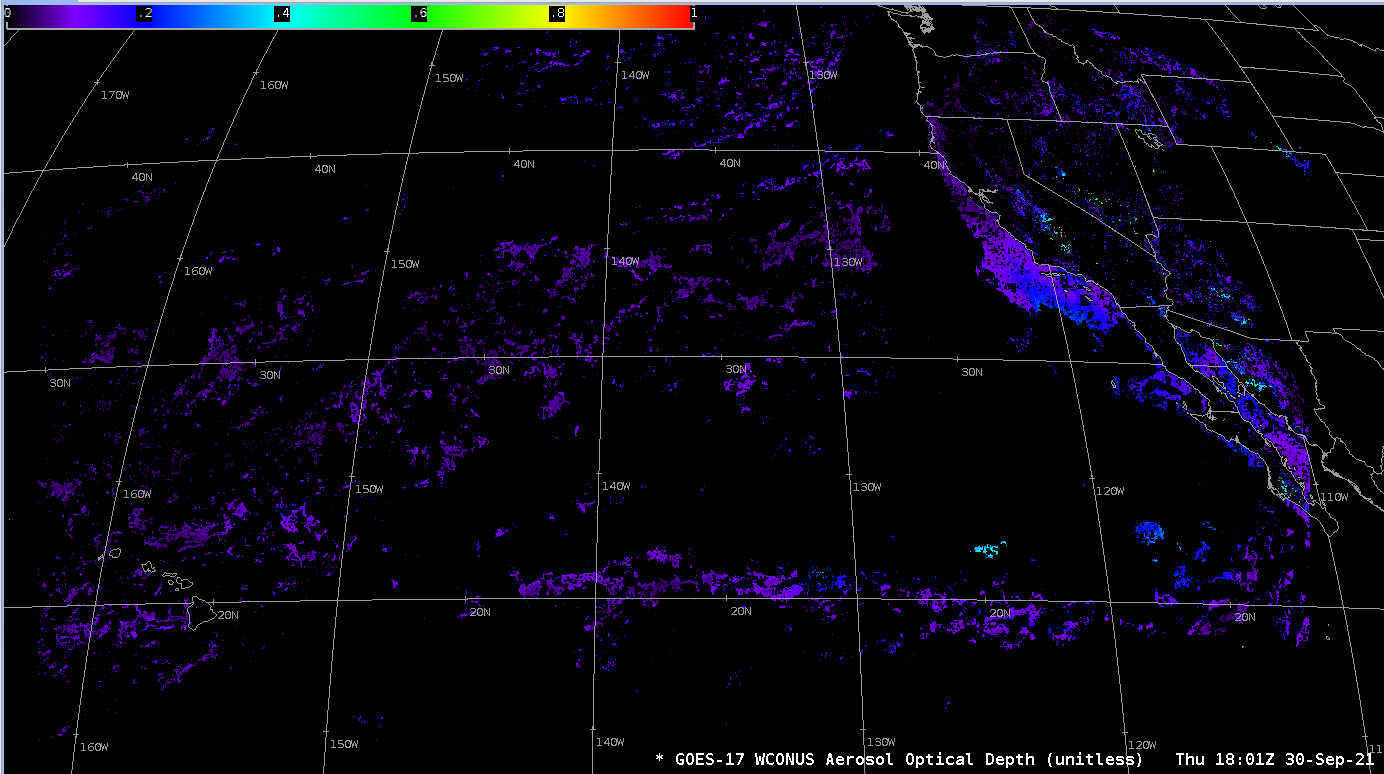
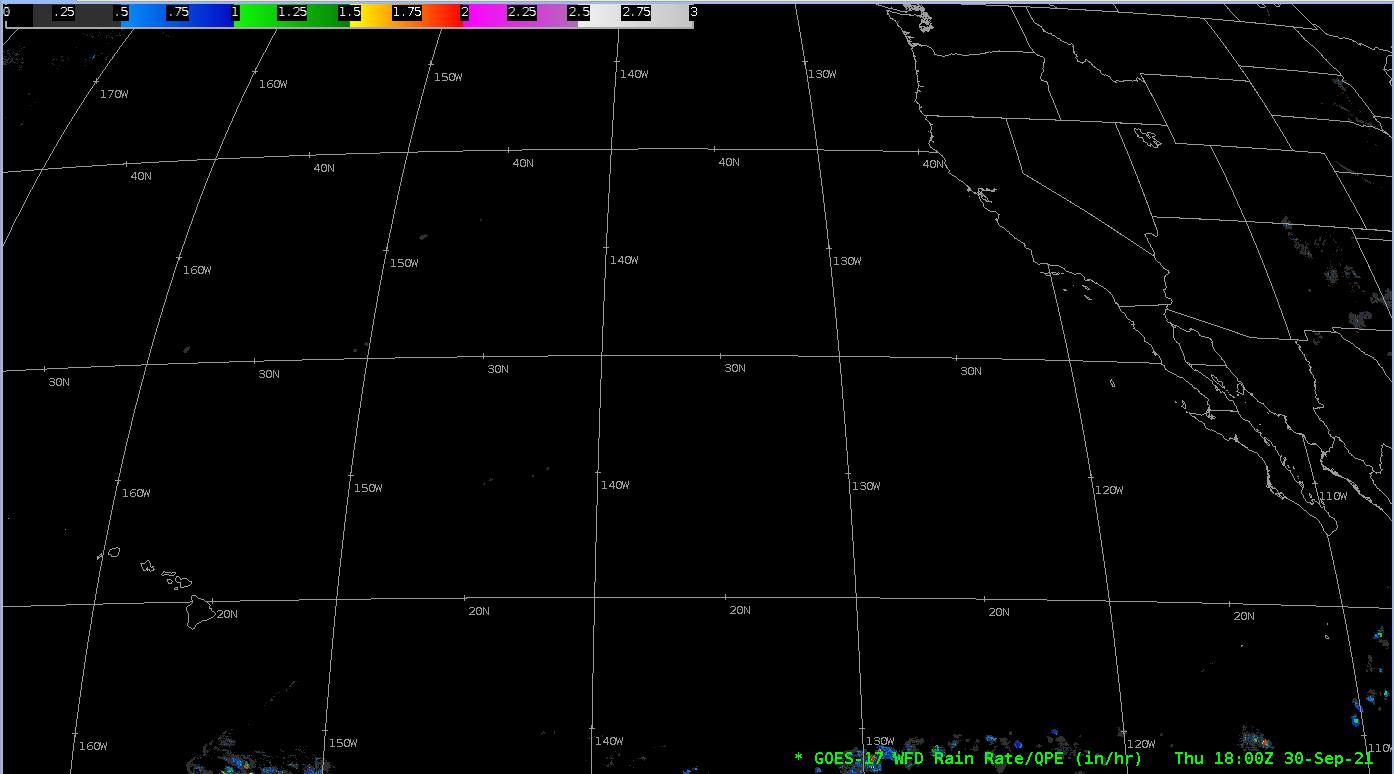
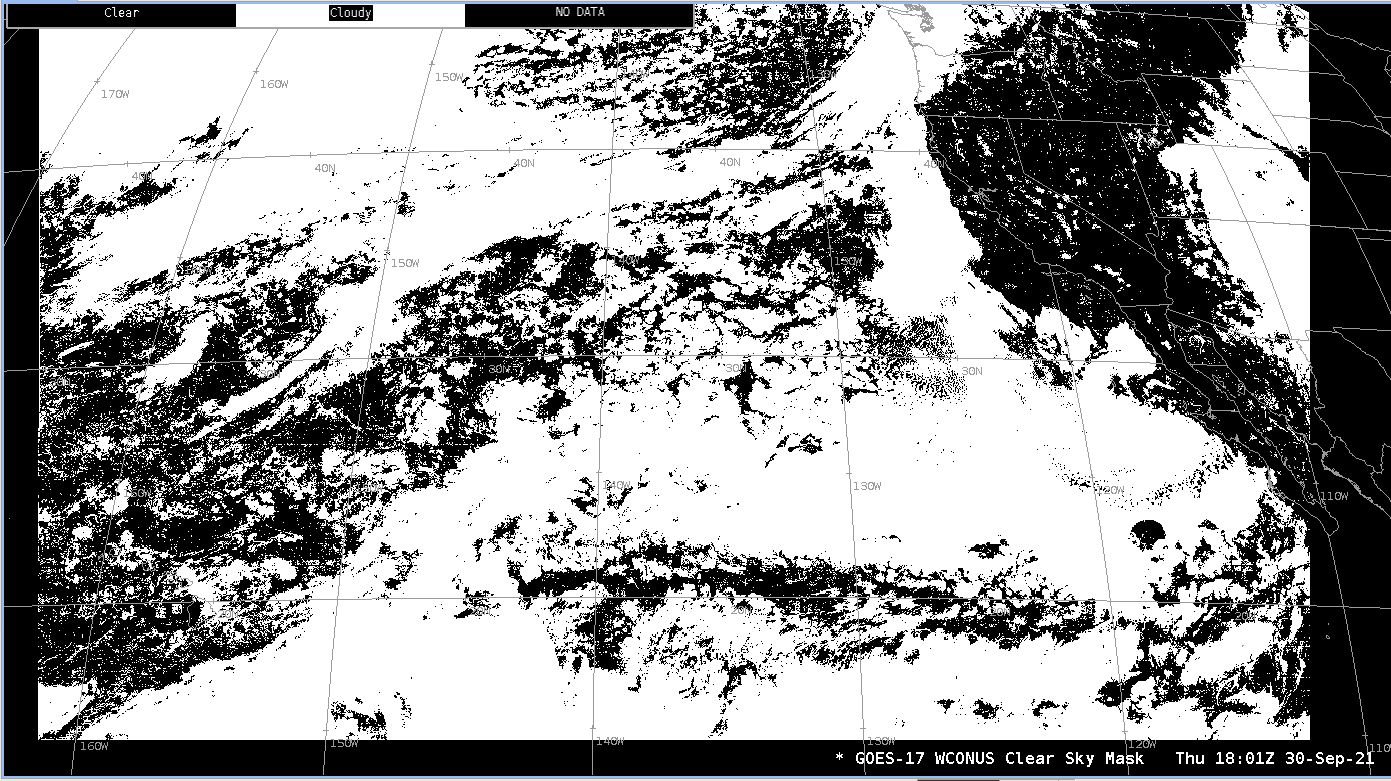
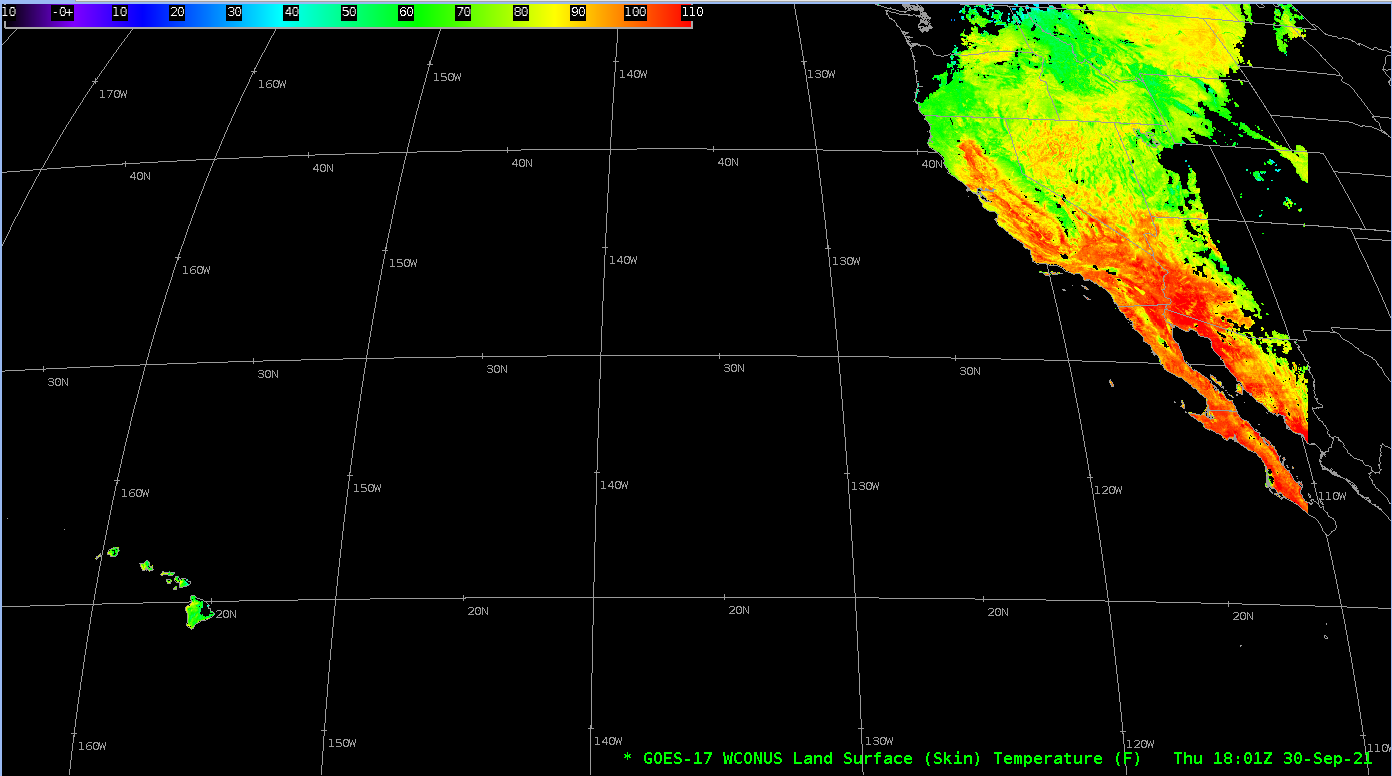
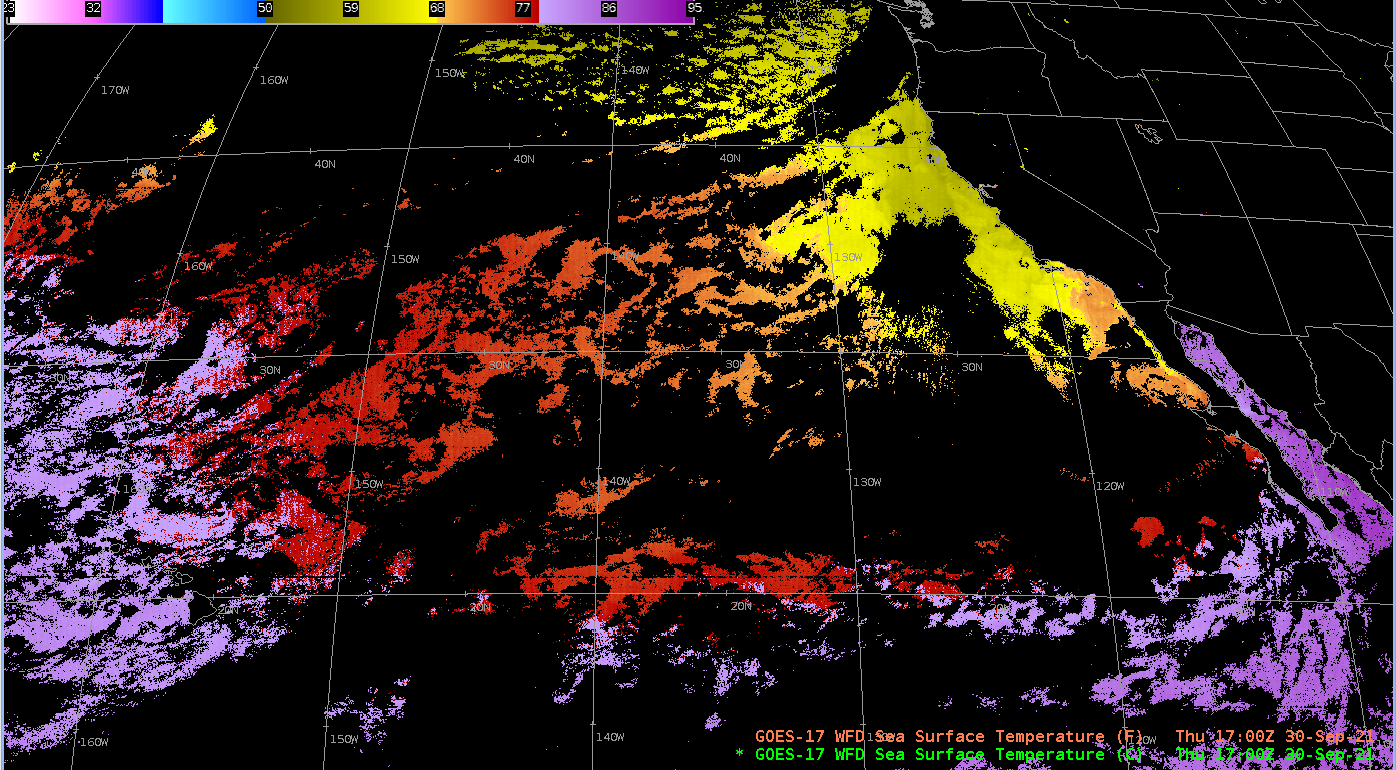
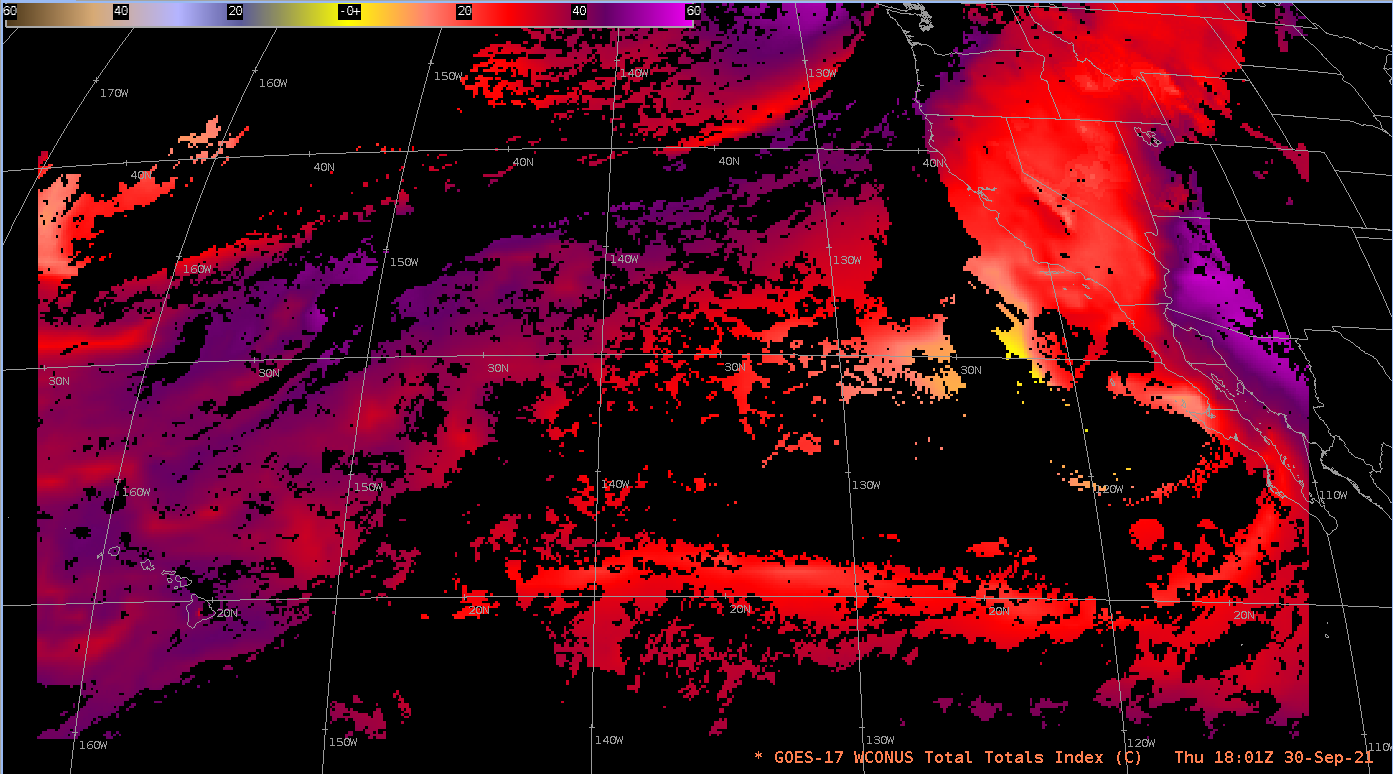
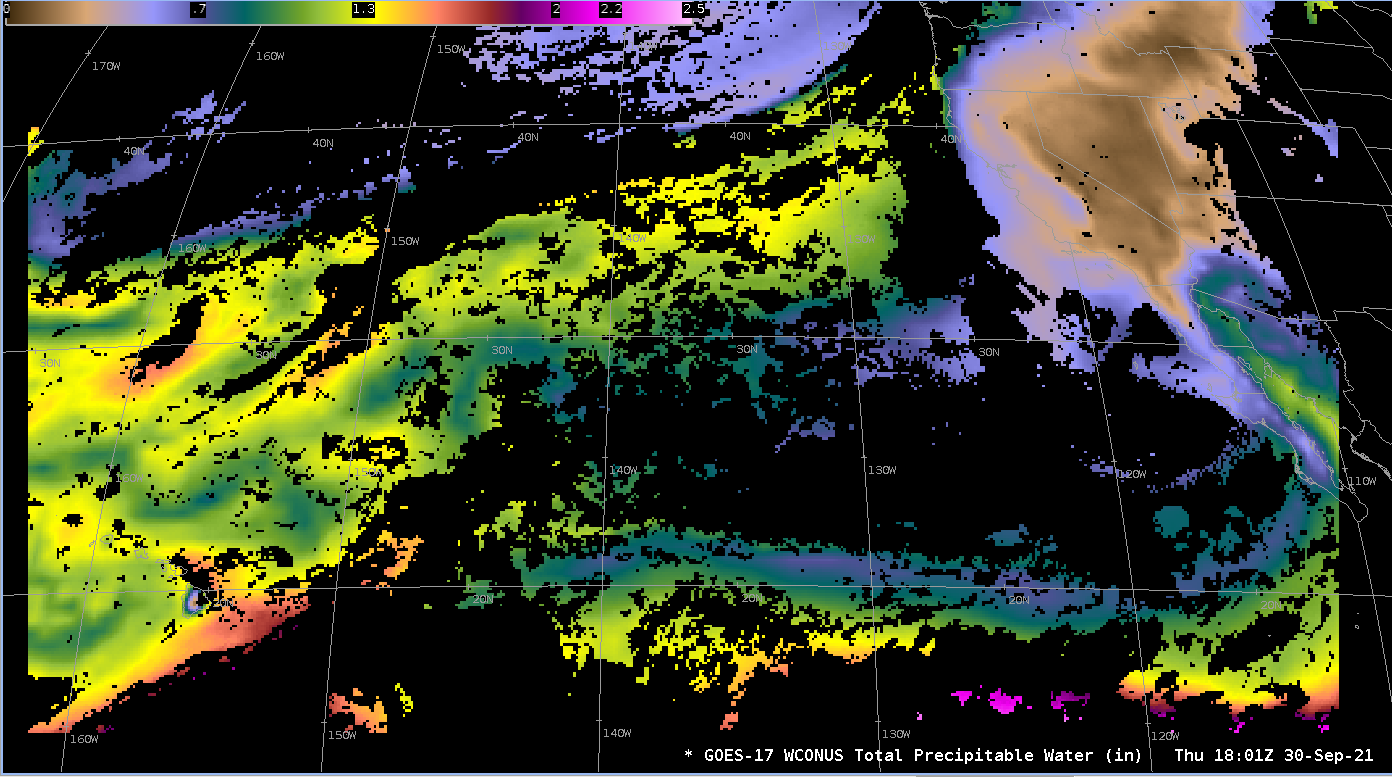
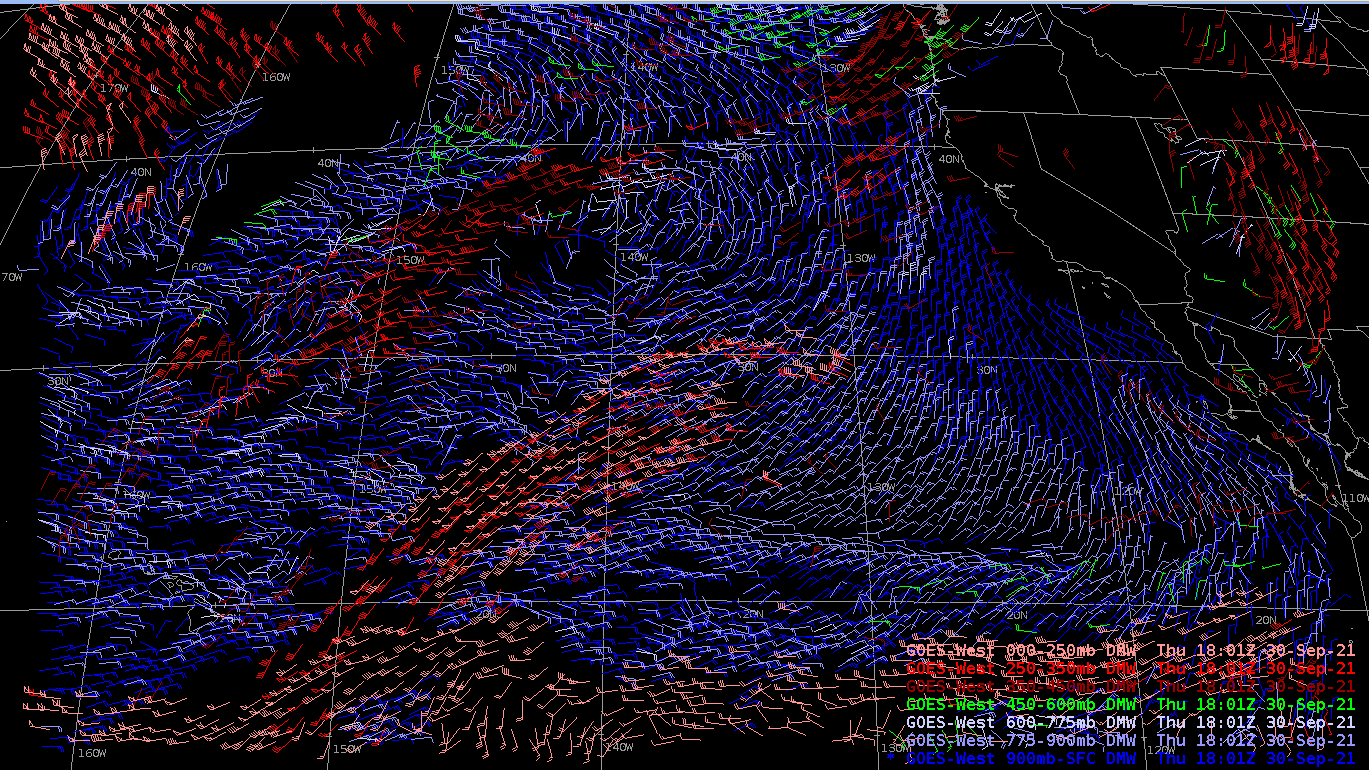
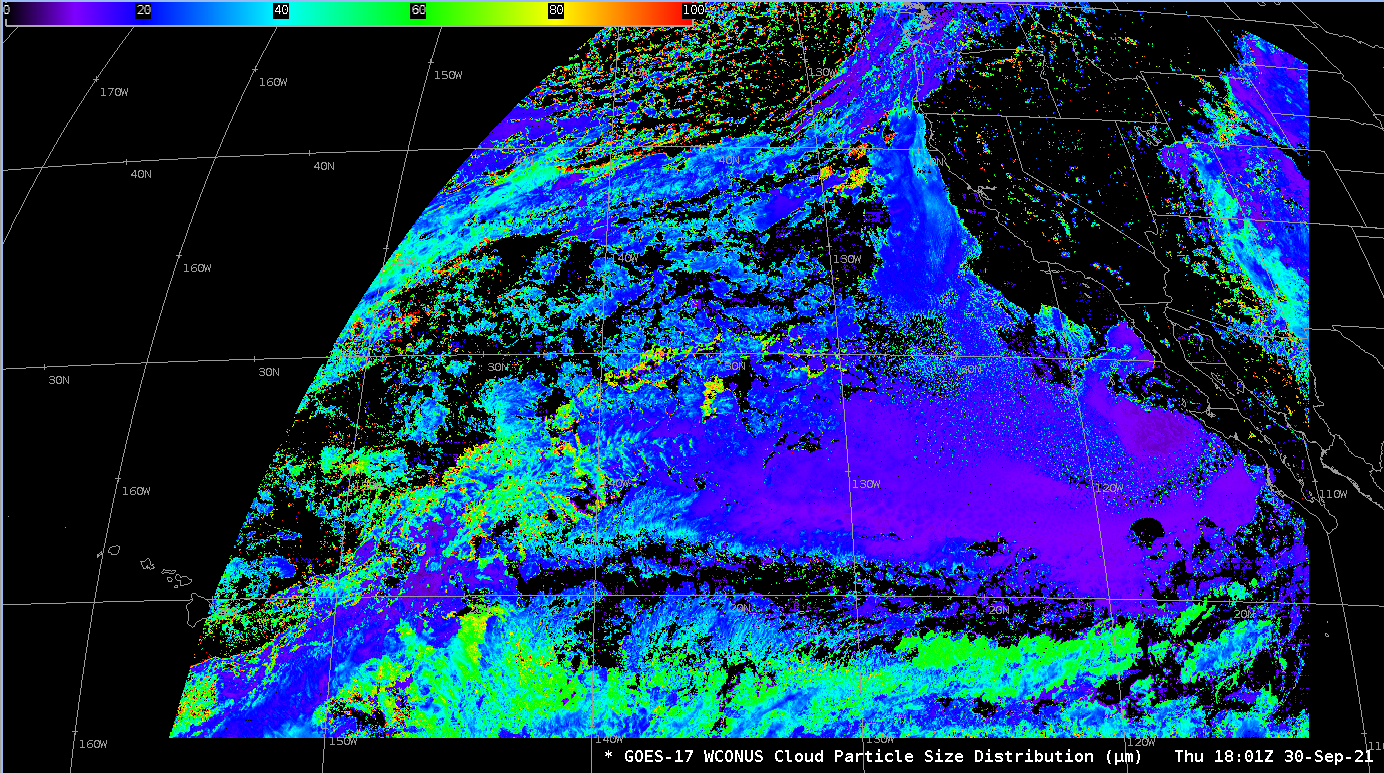
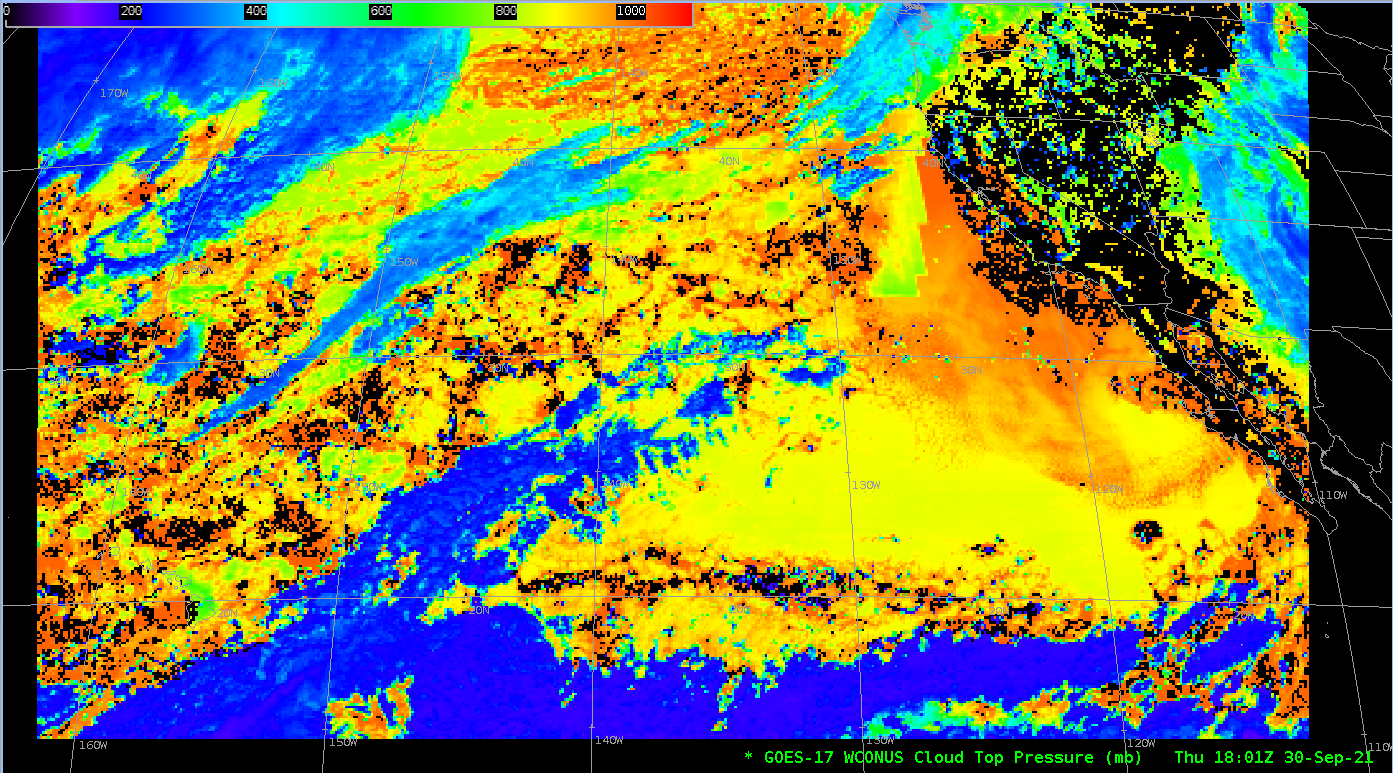
GOES-17 Level 2 Products (and a 0.64 µm Band 2 visible image) at 1801 UTC on 30 September 2021 (Click to enlarge)
Special Note: Users of GOES-17 Level 2 Products must remember that, depending on the time and day, Level 2 Products may be affected by degraded ABI band quality, an issue related to the GOES-17 Loop Heat Pipe that is not performing up to spec. For more information on the Loop Heat Pipe and it effect on GOES-17 imagery, visit this site and this site.

