Heavy rainfall and snowfall in Southern California
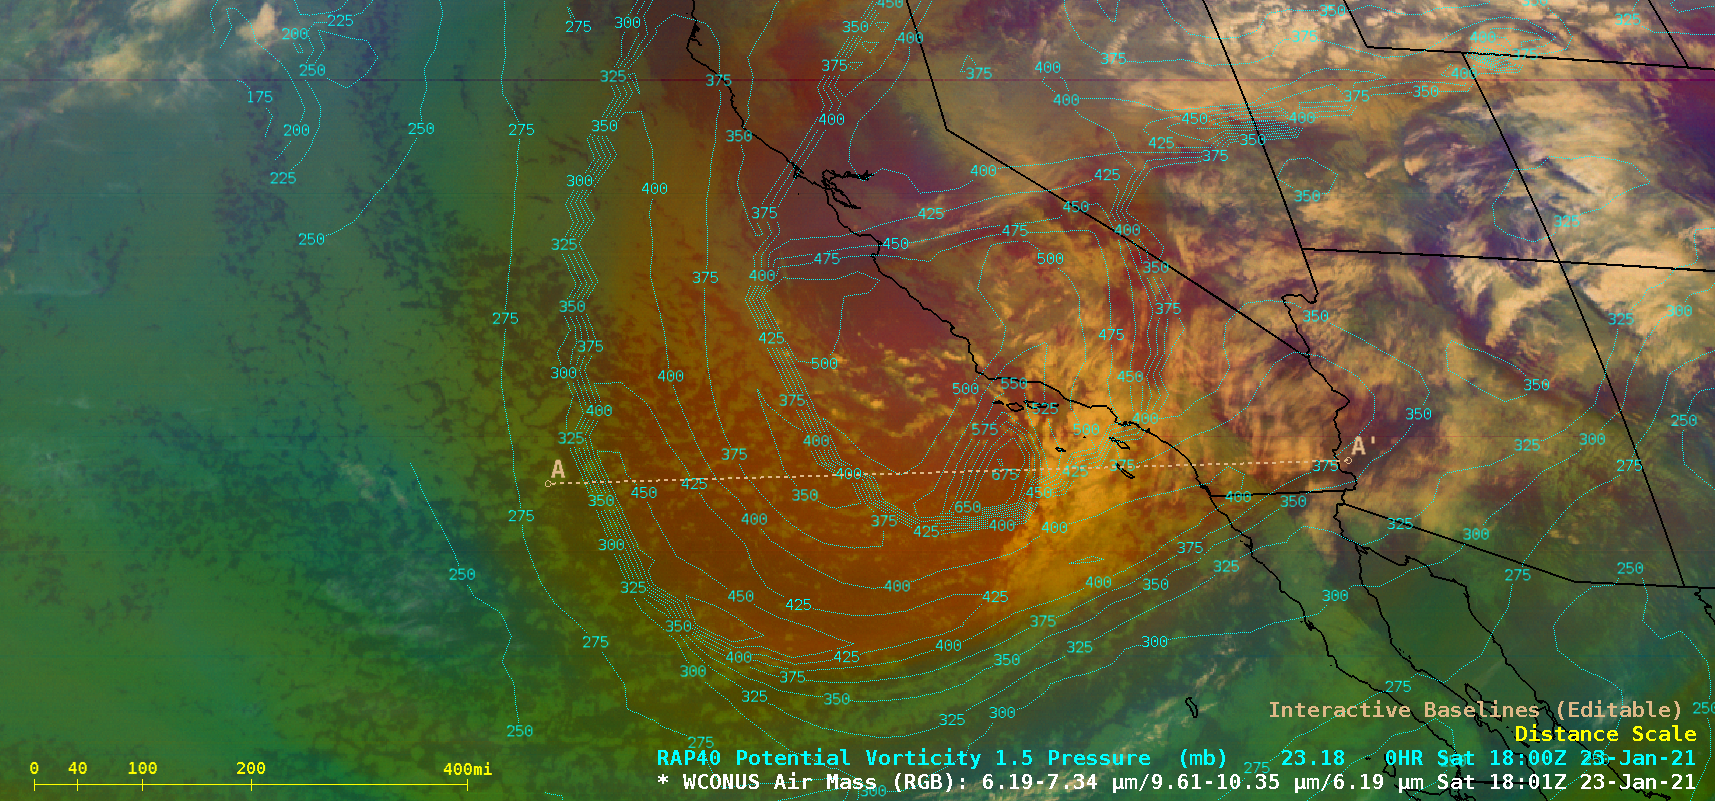
![GOES-17 Air Mass RGB images, with contours of PV1.5 pressure [click to play animation | MP4]](https://cimss.ssec.wisc.edu/satellite-blog/images/2021/01/210123_goes17_airMassRGB_pv1.5pressure_Southern_California_anim.gif)
GOES-17 Air Mass RGB images, with contours of PV1.5 pressure [click to play animation | MP4]
A west-to-east oriented cross section of RAP40 model fields along Line A-A’ (below) depicted the descending dynamic tropopause at 19 UTC.
![Cross section of RAP40 model fields along line A-A' [click to enlarge]](https://cimss.ssec.wisc.edu/satellite-blog/images/2021/01/210123_19utc_ruc40_lineA_cross_section.png)
Cross section of RAP40 model fields along line A-A’ [click to enlarge]
![GOES-17 Mid-level Water Vapor (6.9 µm) images, with plots of hourly surface weather type [click to play animation | MP4]](https://cimss.ssec.wisc.edu/satellite-blog/images/2021/01/210123_goes17_waterVapor_SoCal_anim.gif)
GOES-17 Mid-level Water Vapor (6.9 µm) images, with plots of hourly surface weather type [click to play animation | MP4]
![GOES-17 Mid-level Water Vapor (6.9 µm) image at 2301 UTC, with GLM Groups plotted in red [click to enlarge]](https://cimss.ssec.wisc.edu/satellite-blog/images/2021/01/G17_WV_GLM_CA_23JAN2021_B9_2021023_230117_GOES-17_0001PANEL_FRAME0000097.GIF)
GOES-17 Mid-level Water Vapor (6.9 µm) image at 2301 UTC, with GLM Groups plotted in red [click to enlarge]
![GOES-17 Mid-level Water Vapor (6.9 µm) image at 0246 UTC, with GLM Groups plotted in red [click to enlarge]](https://cimss.ssec.wisc.edu/satellite-blog/images/2021/01/G17_WV_GLM_CA_23JAN2021_B9_2021024_024617_GOES-17_0001PANEL_FRAME0000142.GIF)
GOES-17 Mid-level Water Vapor (6.9 µm) image at 0246 UTC, with GLM Groups plotted in red [click to enlarge]
===== 24 January Update =====
![GOES-17 Day Snow-Fog RGB images [click t play animation | MP4]](https://cimss.ssec.wisc.edu/satellite-blog/images/2021/01/210124_goes17_daySnowFogRGB_SoCal_anim.gif)
GOES-17 Day Snow-Fog RGB images [click to play animation | MP4]
Suomi NPP VIIRS True Color RGB and False Color RGB images (below) showed the snow cover (shades of cyan) at 2036 UTC.
![Suomi NPP VIIRS True Color RGB and False Color RGB images [click to enlarge]](https://cimss.ssec.wisc.edu/satellite-blog/images/2021/01/210124_2036utc_suomiNPP_viirs_trueColorRGB_SoCal_anim.gif)
Suomi NPP VIIRS True Color RGB and False Color RGB images [click to enlarge]