This website works best with a newer web browser such as Chrome, Firefox, Safari or Microsoft
Edge. Internet Explorer is not supported by this website.
This morning brought a line of severe weather, rain, and thunderstorms to parts of Texas into Louisiana. The system moves eastward, already delivering on a threat of severe weather. As of 2:08 PM CDT (19:08Z) today, October 27, 2021, there is an active tornado warning in multiple parishes throughout Southern... Read More
This morning brought a line of severe weather, rain, and thunderstorms to parts of Texas into Louisiana. The system moves eastward, already delivering on a threat of severe weather. As of 2:08 PM CDT (19:08Z) today, October 27, 2021, there is an active tornado warning in multiple parishes throughout Southern Louisiana. The system will continue to move through the Gulf Region through Thursday.
A “line” system associated with severe weather moves over East Texas into Louisiana as seen in this 5-minute GOES-16 ABI Band 2 animation (visible wavelength, 0.64 microns). The ABI Band 2 data has spatial resolution at 0.5 km, making it useful for the analysis of small-scale clouds in rapidly changing weather systems such as this one.
1-minute Mesoscale Domain Sector GOES-16 (GOES-East) “Red” Visible (0.64 µm) images (above) include time-matched plots of SPC Storm Reports — and showed severe thunderstorms movng eastward across Missouri and Illinois during the late afternoon and early evening hours on 24 October 2021. Most of these storms were developing along and ahead of an advancing cold front (surface analyses), and they produced several tornadoes including a... Read More
GOES-16 “Red” Visible (0.64 µm) images, with SPC Storm Reports plotted in red [click to play animation | MP4]
1-minute Mesoscale Domain Sector GOES-16 (GOES-East) “Red” Visible (0.64 µm) images (above)include time-matched plots of SPC Storm Reports — and showed severe thunderstorms movng eastward across Missouri and Illinois during the late afternoon and early evening hours on 24 October 2021. Most of these storms were developing along and ahead of an advancing cold front (surface analyses), and they produced several tornadoes including a long-track EF-3 in Missouri/Illinois (NWS St. Louis) and a long-track EF-2 in Missouri (NWS Kansas City).
The corresponding 1-minute GOES-16 “Clean” Infrared Window (10.35 µm) images (below) extended into the nighttime hours, and displayed coldest cloud-top infrared brightness temperatures in the -60 to -70ºC range (red to black enhancement).
GOES-16 “Clean” Infrared Window (10.35 µm) images, with SPC Storm Reports plotted in blue [click to play animation | MP4]
A sequence of two intense storms in the north Pacific Ocean, noted in the GOES-17 airmass RGB below, has drawn moisture into the northwestern United States. A MIMIC (Morphed Integrated Microwave Imagery at CIMSS) Total Precipitable Water rocking animation, above (rocking animation from this site), shows the development of a ribbon... Read More
MIMIC Total Precipitable water, rocking animation from 0000 UTC on 11 October to 2300 UTC on 21 October (click to enlarge)
A sequence of two intense storms in the north Pacific Ocean, noted in the GOES-17 airmass RGB below, has drawn moisture into the northwestern United States. A MIMIC (Morphed Integrated Microwave Imagery at CIMSS) Total Precipitable Water rocking animation, above (rocking animation from this site), shows the development of a ribbon of moisture that moved into the northwestern United States.
GOES-17 Airmass RGB with/without 0900 UTC analysis of fronts/pressure (Click to enlarge)
Advected Layer Precipitable Water (ALPW, from this website), differentiates the moisture into layers. At 1200 UTC, one moisture axis was right across the Bay Area of California, with 20-24 mm of moisture in the sfc-850 mb layer, 10-12 mm of moisture in the 850-700 mb layer, and 5 or 6 mm in the 700-500 mb layer.
Microwave estimates of total precipitable water in layers: Surface-850 mb, 850-700 mb, 700-500 mb, 500-300 mb, ca. 1200 UTC on 22 October 2021 (Click to enlarge)
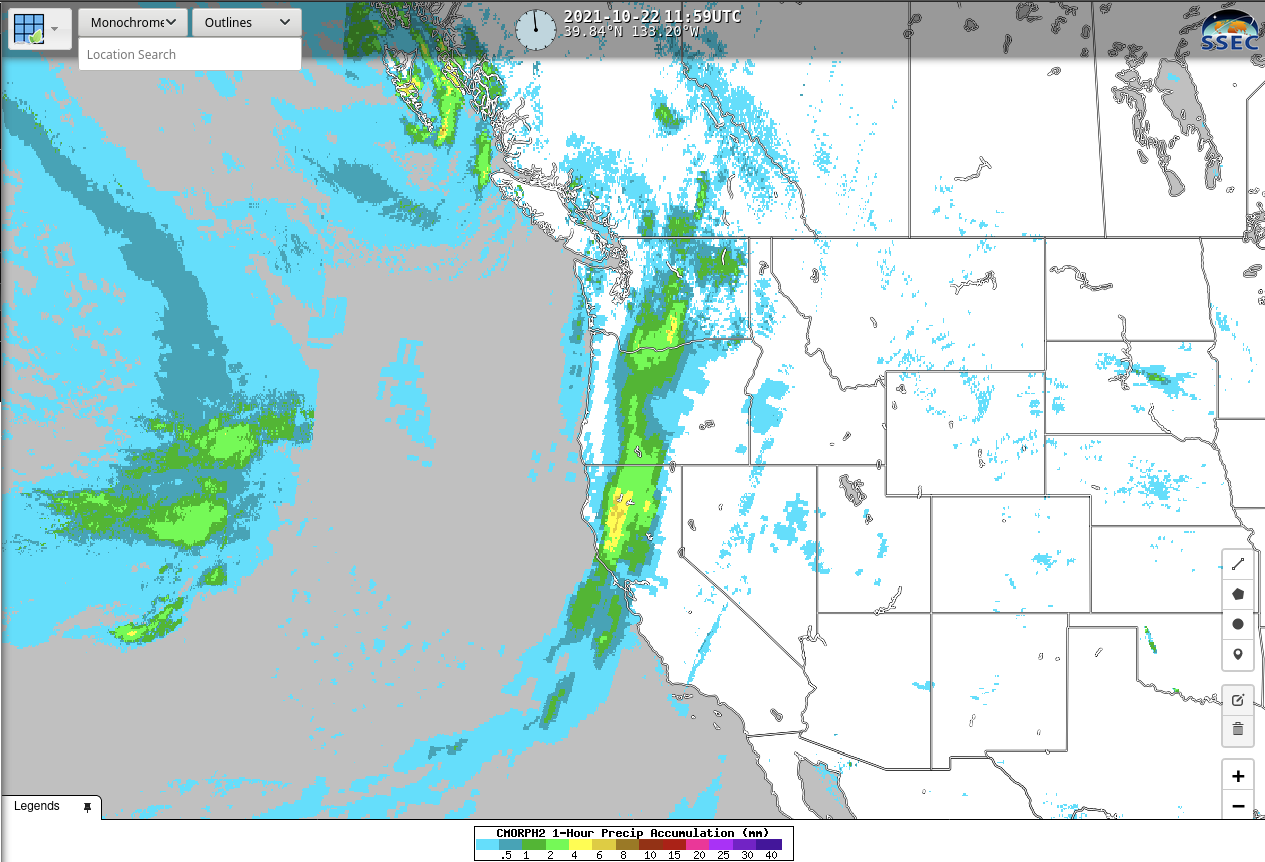
Accumulated 1-hour precipitation (estimated with CMORPH-2) for the hour ending at 1200 UTC on 22 October, below, shows a ribbon of rain from just north of the Bay Area to central Oregon; largest amounts over northern California are 6-8 mm for the one hour. CMORPH-2 estimates of precipitation are available at RealEarth.
CMORPH estimates of 1-hour rainfall ending at 1200 UTC on 22 October 2021 (Click to enlarge)
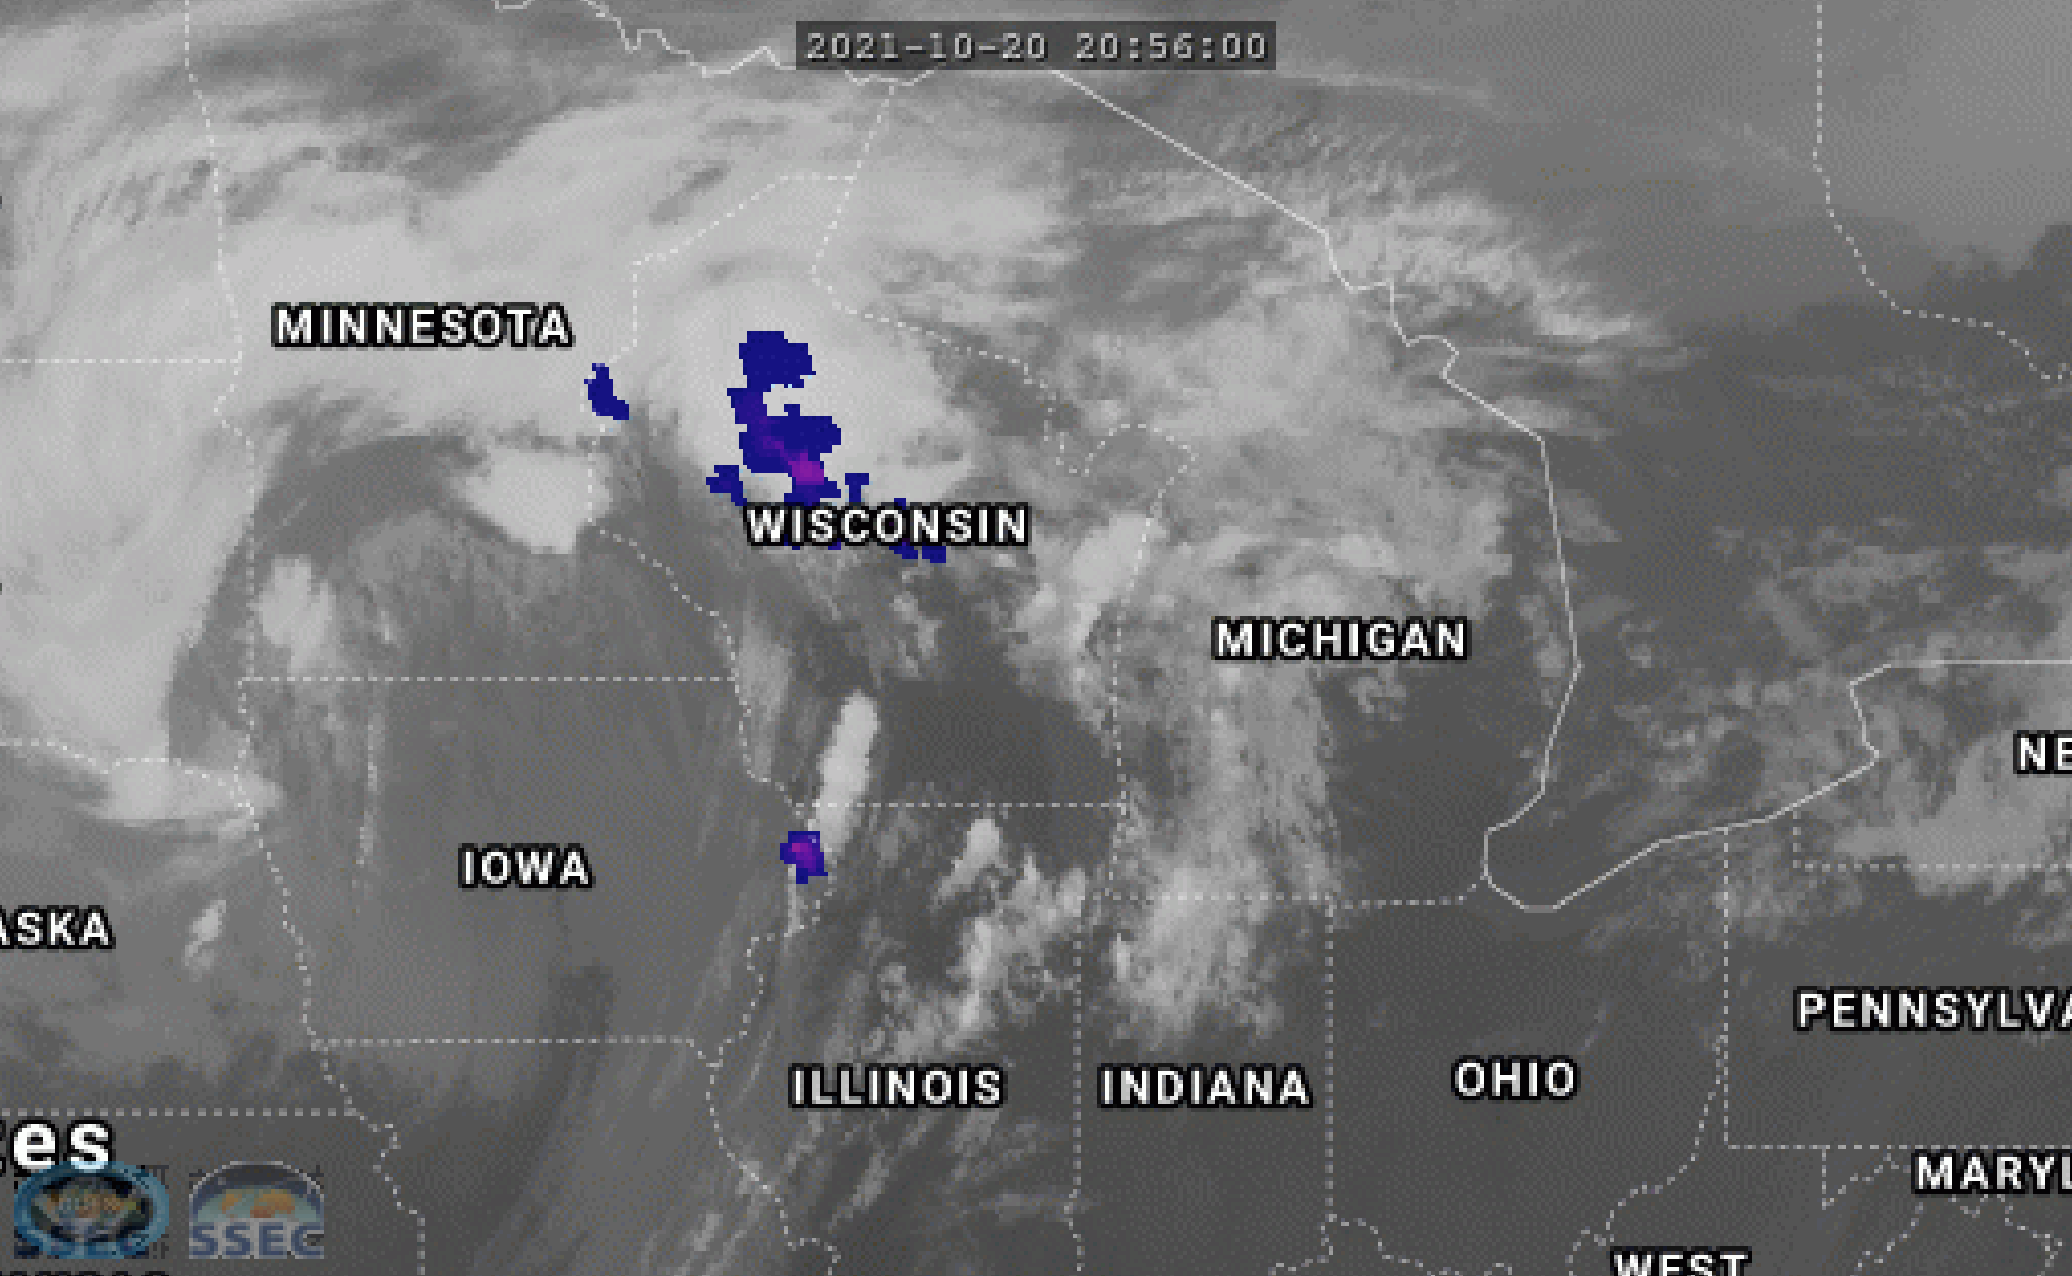
Cooler temperatures across the Midwest are often heralded by thunderstorms. Yesterday evening and last night, a system brought rain and lightning to parts of Iowa, Minnesota, Wisconsin, Illinois, and Michigan, moving over Ohio by Thursday morning. RealEarth, a web-based visualization platform developed at UW-Madison, can display data from GOES-16 to... Read More
Cooler temperatures across the Midwest are often heralded by thunderstorms. Yesterday evening and last night, a system brought rain and lightning to parts of Iowa, Minnesota, Wisconsin, Illinois, and Michigan, moving over Ohio by Thursday morning. RealEarth, a web-based visualization platform developed at UW-Madison, can display data from GOES-16 to monitor such events. RealEarth’s data archives usually go back at least 24-hours which provides temporal context to weather events.
RealEarth is a free data discovery and visualization platform developed at SSEC/CIMSS at the University of Wisconsin-Madison. It is available at realearth.ssec.wisc.edu.
A 24-hour animation every hour from RealEarth (time in UTC) showing GOES-16 ABI Band 13 with the purple areas representing lightning. More specifically, the purple areas depict Flash Extent Density from the Geostationary Lightning Mapper (GLM) also aboard GOES-16.


