This website works best with a newer web browser such as Chrome, Firefox, Safari or Microsoft
Edge. Internet Explorer is not supported by this website.
CSPP GeoSphere imagery, above, (click here for a direct link to the animation above in CSPP Geosphere; it will remain there for about 2 weeks before the data are overwritten) shows the evolution of Tropical Storm Wanda on 2 November 2021. (Wanda had transitioned to a Subtropical Storm on 31 October). Convection... Read More
GOES-16 Band 2 Visible (0.64 µm) Imagery, 1250 -1740 UTC on 2 November 2021
CSPP GeoSphere imagery, above, (click here for a direct link to the animation above in CSPP Geosphere; it will remain there for about 2 weeks before the data are overwritten) shows the evolution of Tropical Storm Wanda on 2 November 2021. (Wanda had transitioned to a Subtropical Storm on 31 October). Convection developed near the storm center and wrapped about halfway around the center. Dry air is also affecting this storm. A 24-hour animation of MIMIC Total Precipitable Water (from this site), below, shows an absence of deep moisture, with the driest air to the west and south.
MIMIC Total Precipitable Water, 18z 01 Nov – 17z 02 Nov 2021 (Click to enlarge)
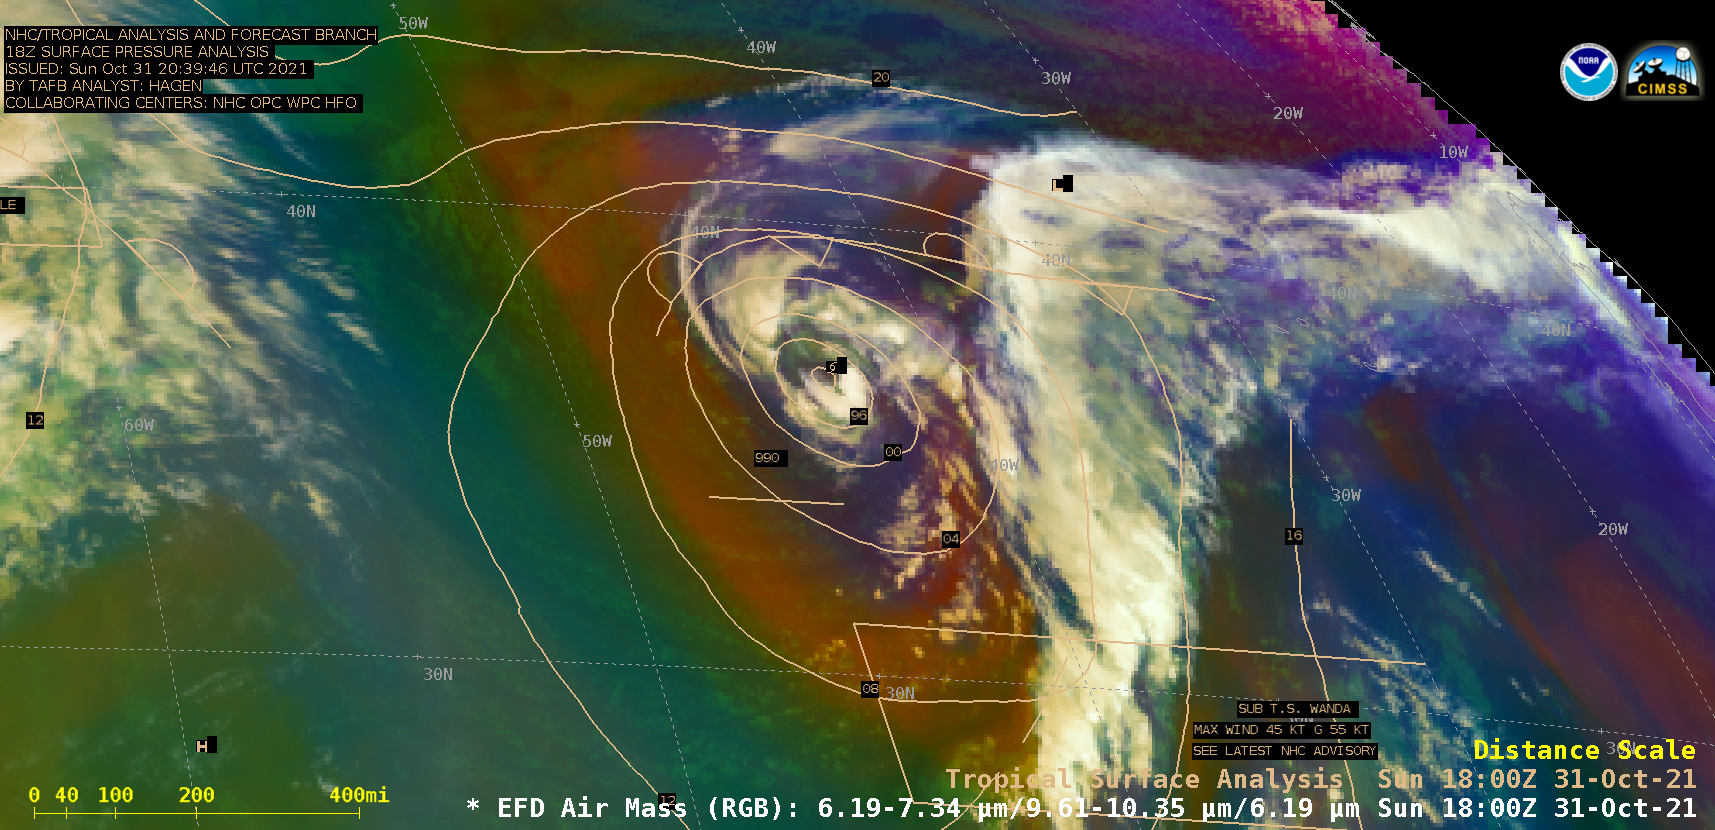
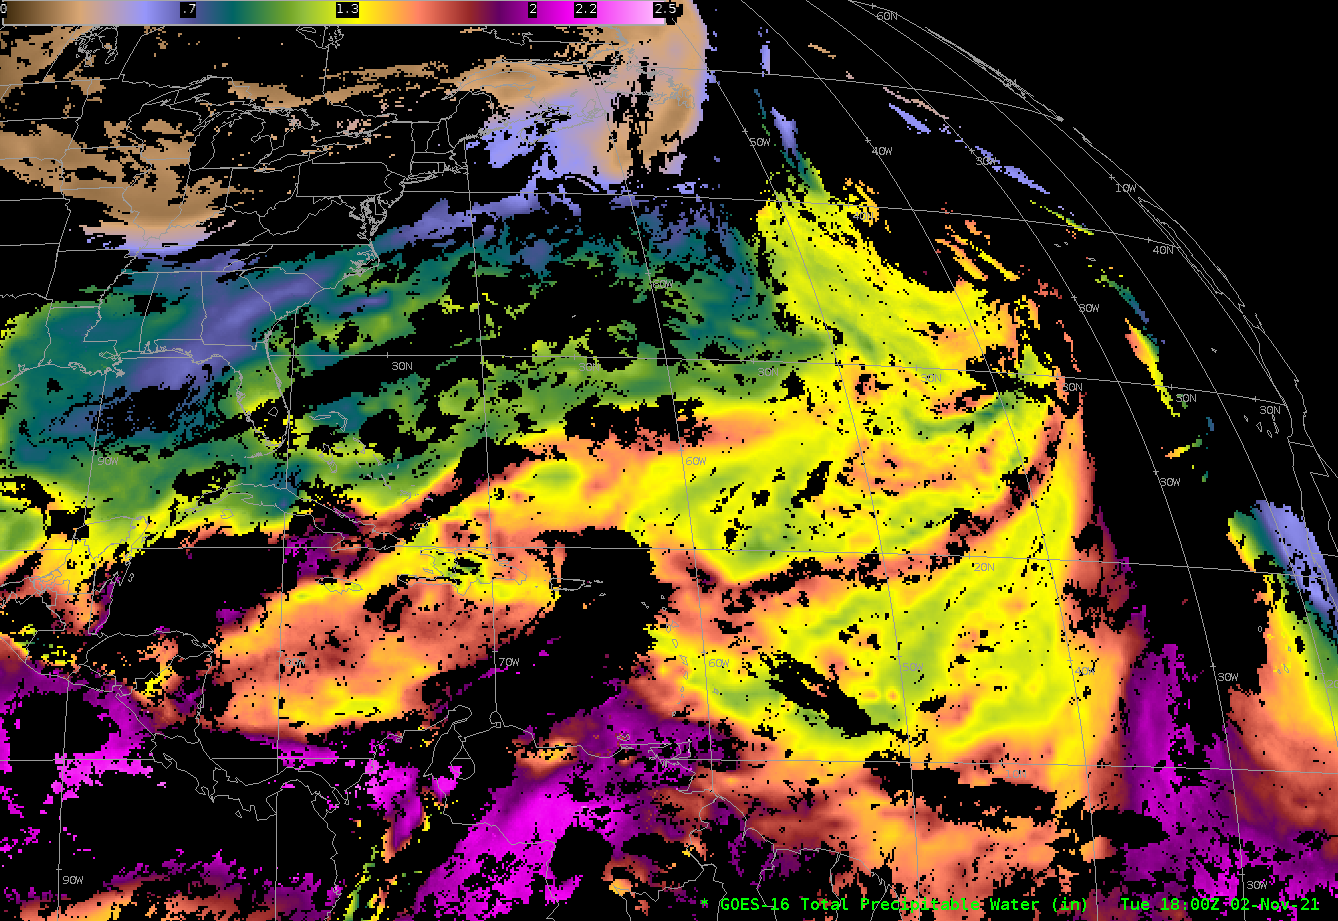
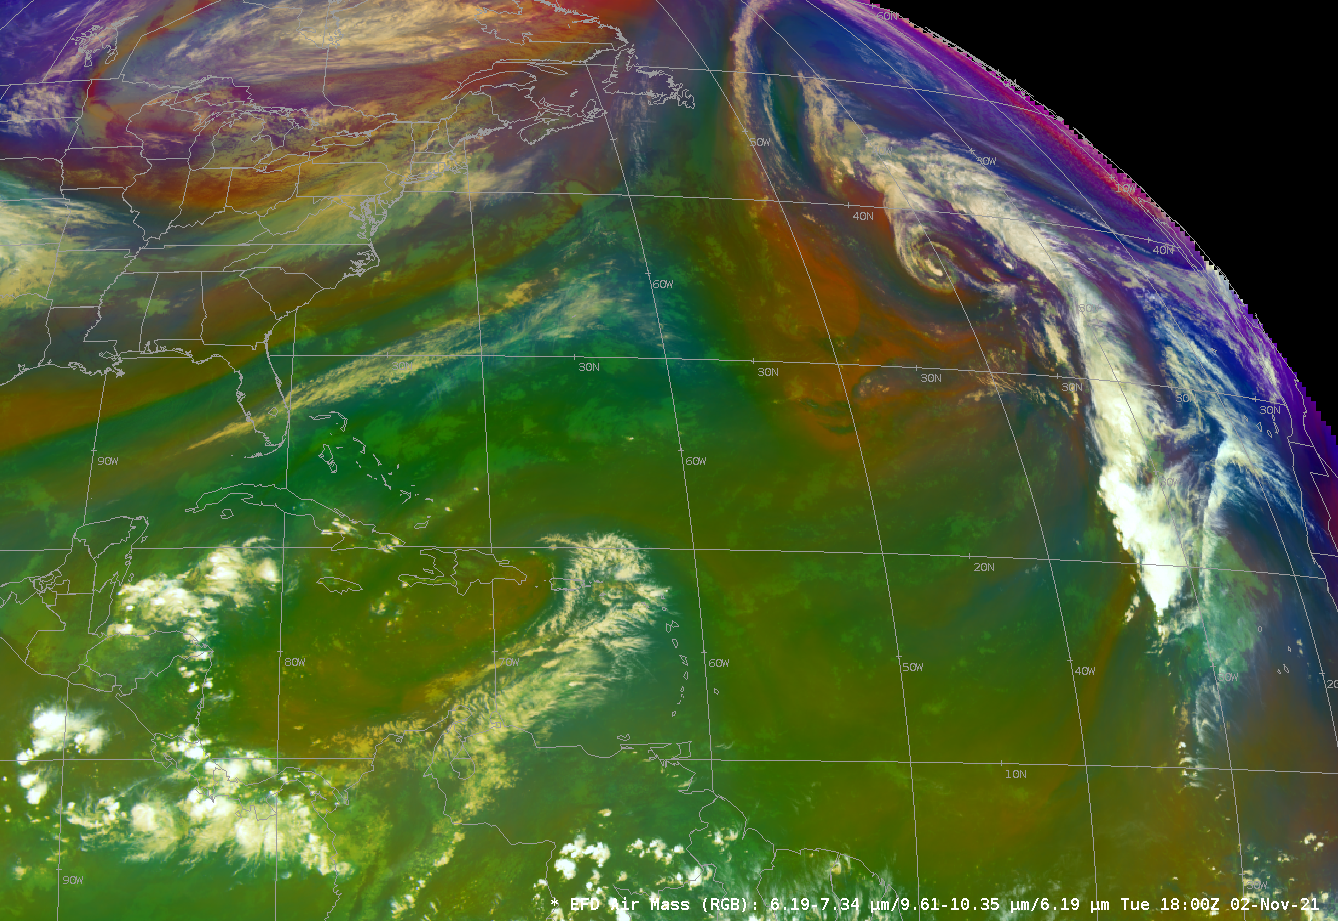
GOES Imagery also shows dry air near Wanda. Both the low-level water vapor (Band 10, 7.34 µm) and the level 2 Total Precipitable Water product (a clear-sky only product) show dry air signatures: for the water vapor imagery, orange and yellow enhancements; for the total precipitable water, yellow and green enhancements signifying values around 1.3″. The airmass RGB shows Wanda far removes from the tropical airmass that is characterized by a deep green color.
GOES-16 Band 10 infrared (7.34 µm) imagery, GOES-16 Total Precipitable Water, and GOES-16 Airmass RGB, all at 1800 UTC on 2 Nov 2021 (Click to enlarge)
1-minute Mesoscale Domain Sector GOES-16 (GOES-East) “Red” Visible (0.64 µm) and “Clean” Infrared Window (10.35 µm) images (above) showed areas of deep convection near the center of Subtropical Storm Wanda over the North Atlantic Ocean on 31 October 2021. The circulation of a “Nor’easter” mid-latitude cyclone on 26-27 October (storm summary) remained intact long enough to begin acquiring subtropical... Read More
GOES-16 “Red” Visible (0.64 µm) and “Clean” Infrared Window (10.35 µm) images [click to play animated GIF | MP4]
1-minute Mesoscale Domain Sector GOES-16 (GOES-East) “Red” Visible (0.64 µm) and “Clean” Infrared Window (10.35 µm) images (above) showed areas of deep convection near the center of Subtropical Storm Wanda over the North Atlantic Ocean on 31 October 2021. The circulation of a “Nor’easter” mid-latitude cyclone on 26-27 October (storm summary) remained intact long enough to begin acquiring subtropical characteristics on 31 October (surface analyses: GIF | MP4].
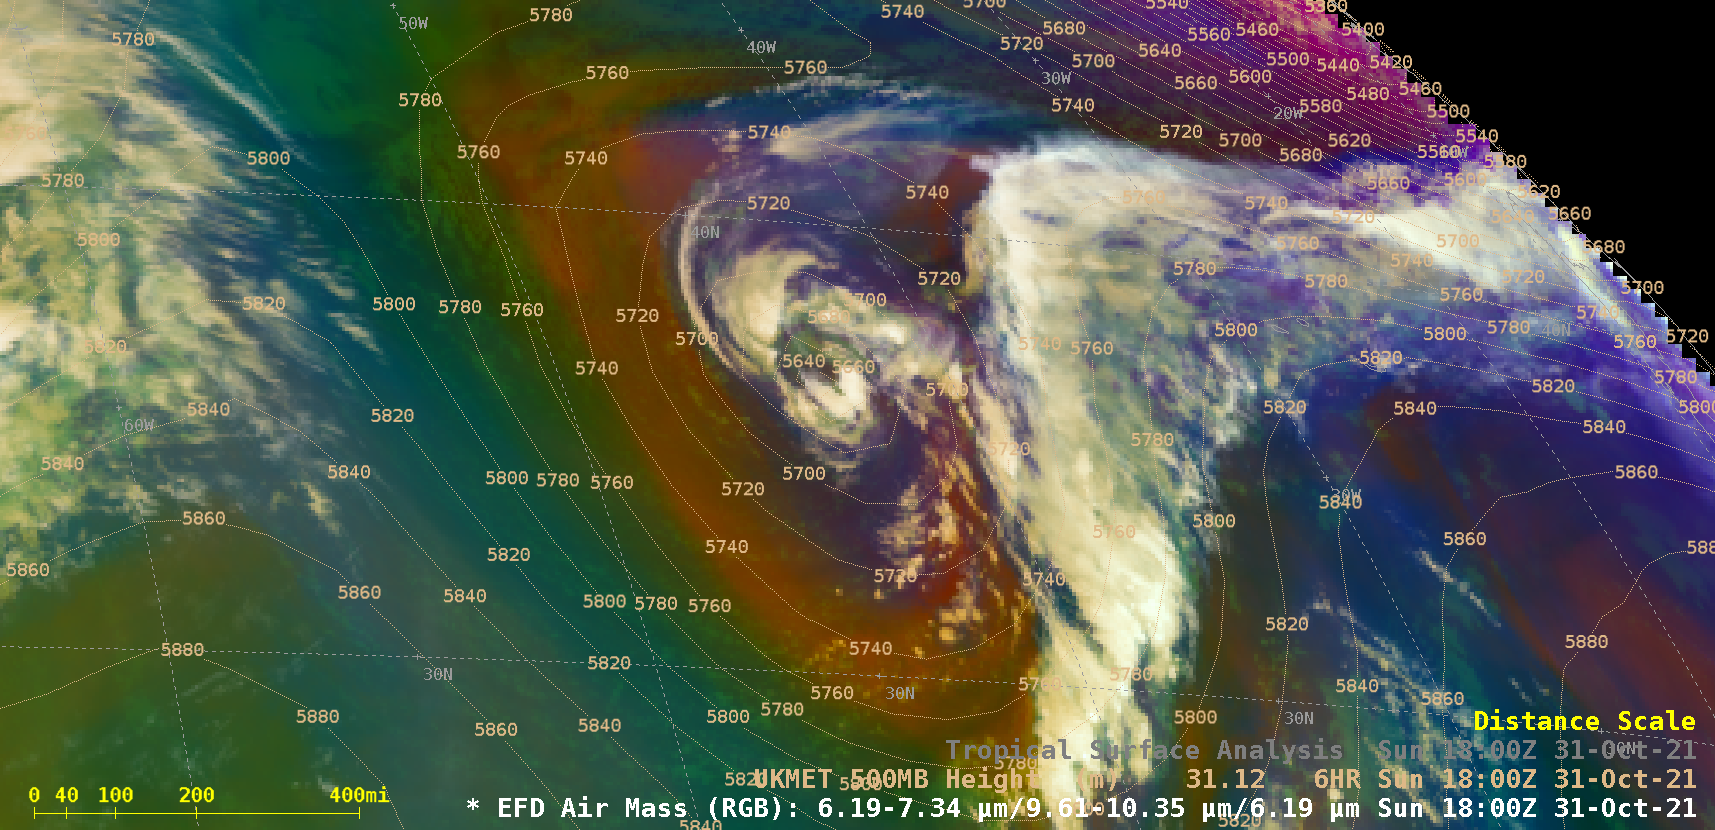
GOES-16 Air Mass RGB images (below) indicated that while the core of Wanda had become separated from nearby baroclinic surface frontal boundaries, the system was still located beneath a middle- to upper-tropospheric trough of low pressure (500 hPa height) — so it was not yet a true tropical cyclone. Wanda did transition to a Tropical Storm on 02 November.
GOES-16 Air Mass RGB images, with and without surface analysis plots [click to play animated GIF | MP4]
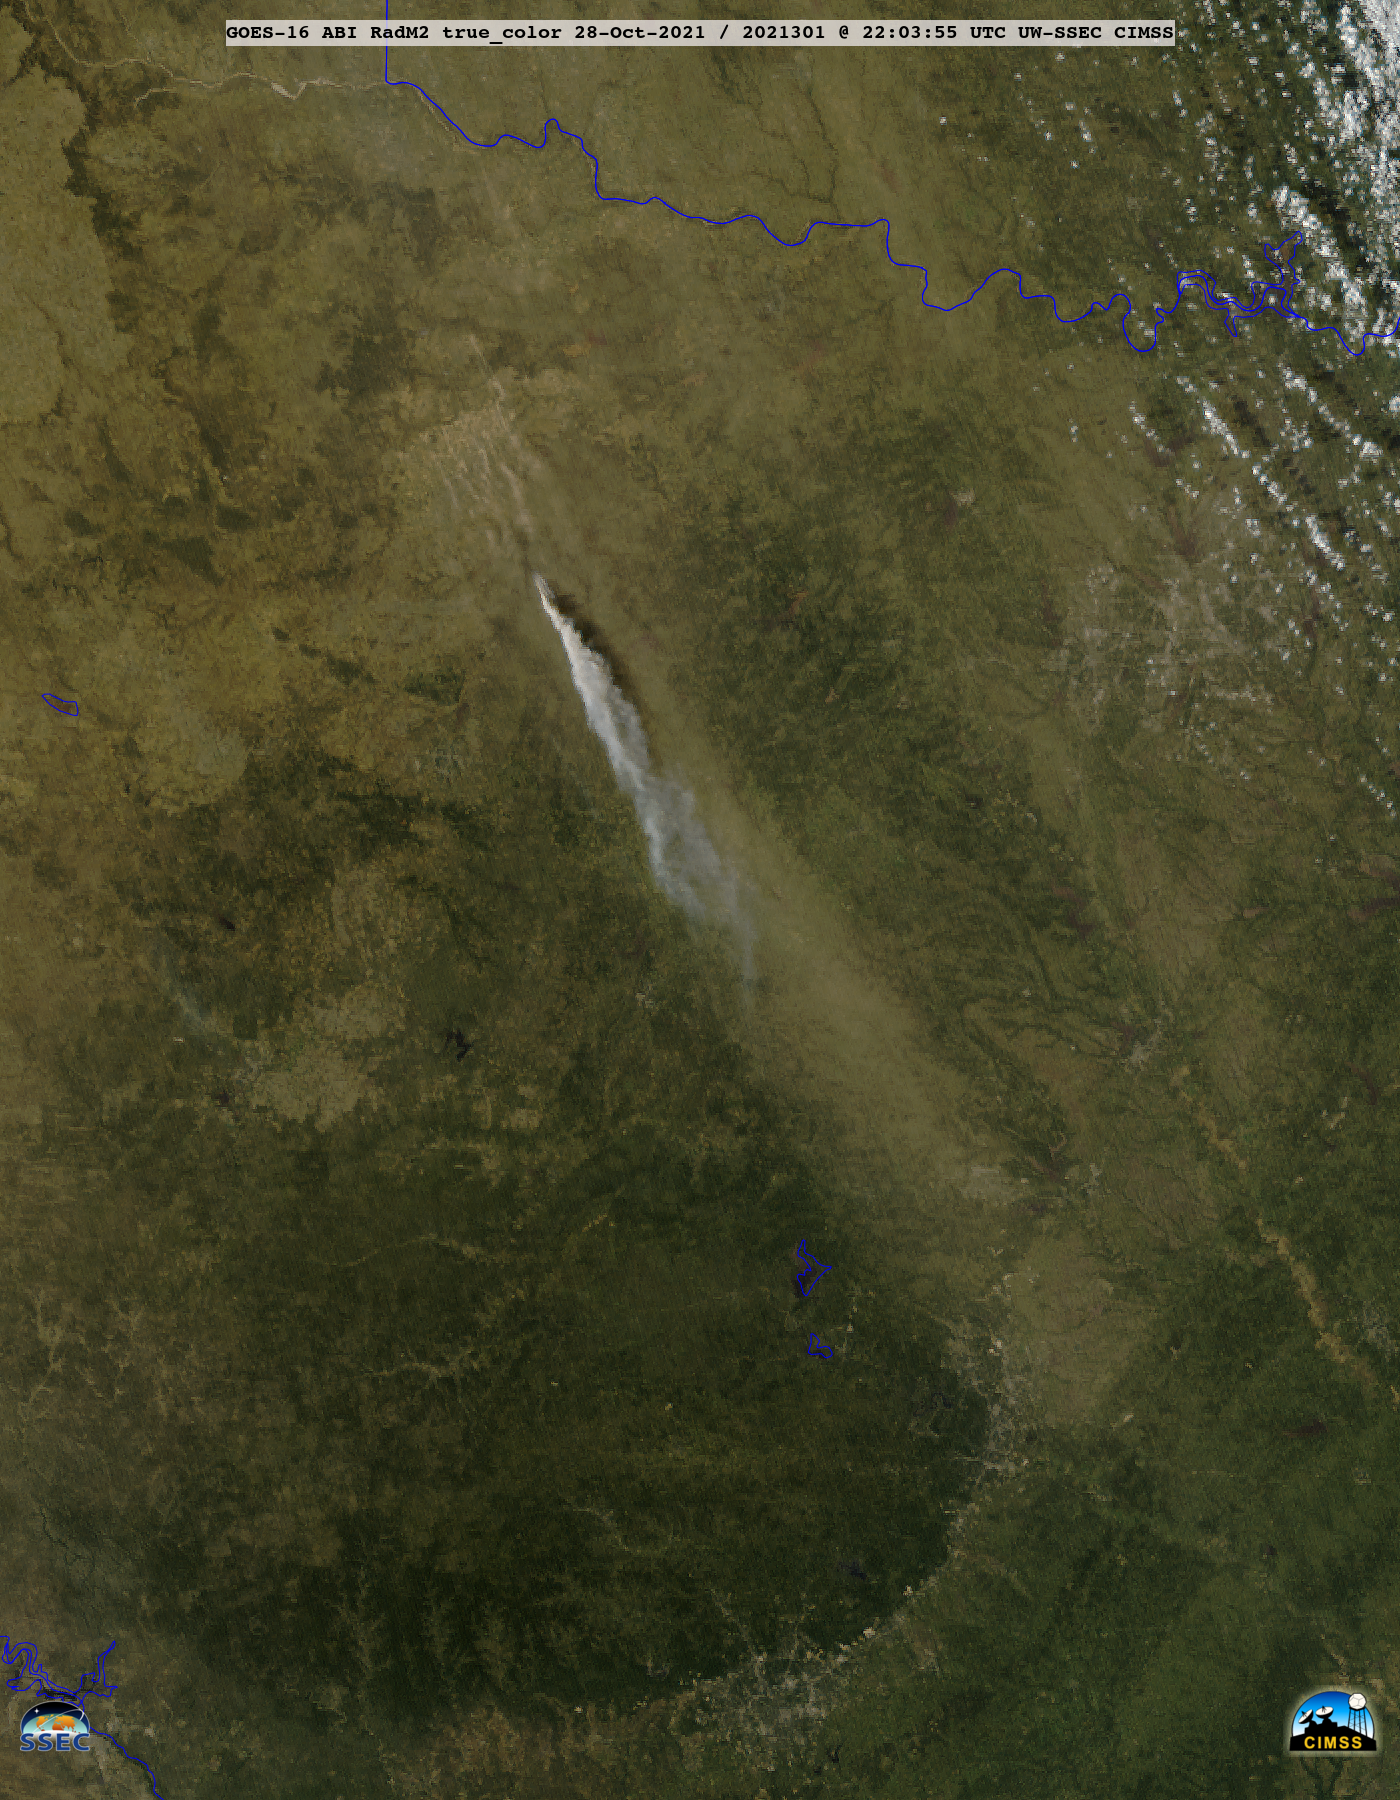
1-minute Mesoscale Domain Sector GOES-16 (GOES-East) True Color RGB images created using Geo2Grid (above) showed a distinct smoke plume associated with the Buck Fire in North Texas on 28 October 2021. The fire spread rapidly toward the southeast, driven by strong northwesterly winds gusting in excess of 40 knots. Note that the brighter white smoke plume was... Read More
GOES-16 True Color RGB images [click to play animated GIF | MP4]
1-minute Mesoscale Domain Sector GOES-16 (GOES-East) True Color RGB images created using Geo2Grid(above) showed a distinct smoke plume associated with the Buck Fire in North Texas on 28 October 2021. The fire spread rapidly toward the southeast, driven by strong northwesterly winds gusting in excess of 40 knots. Note that the brighter white smoke plume was embedded within broader plumes of blowing dust (shades tan to light brown).
In a sequence of 1-minute GOES-16 “Red” Visible (0.64 µm) and Shortwave Infrared (3.9 µm) images along with 5-minute Fire Temperature and Fire Power derived products — all with an overlay of 5-minute Visible Derived Motion Winds(below), the maximum surface 3.9 µm brightness temperature sensed with this fire was 138.7ºC (which is the saturation temperature for the ABI Band 7 detectors), the peak Fire Temperature exceeded 2900 K and the Fire Power reached 1800 MW (the Fire Temperature and Fire Power derived products are components of the GOES Fire Detection and Characterization Algorithm FDCA). Derived Motion Winds tracked the smoke plume moving southeastward at speeds up to 49 knots.
GOES-16 Visible, Shortwave Infrared, Fire Temperature, and Fire Power with an overlay of Derived Motion Winds [click to play animated GIF | MP4]
It was a little bit breezy for some of y’all today, wasn’t it? Here are some of the highest official gusts we’ve seen across the area as of 5PM: #txwx#sjtwx
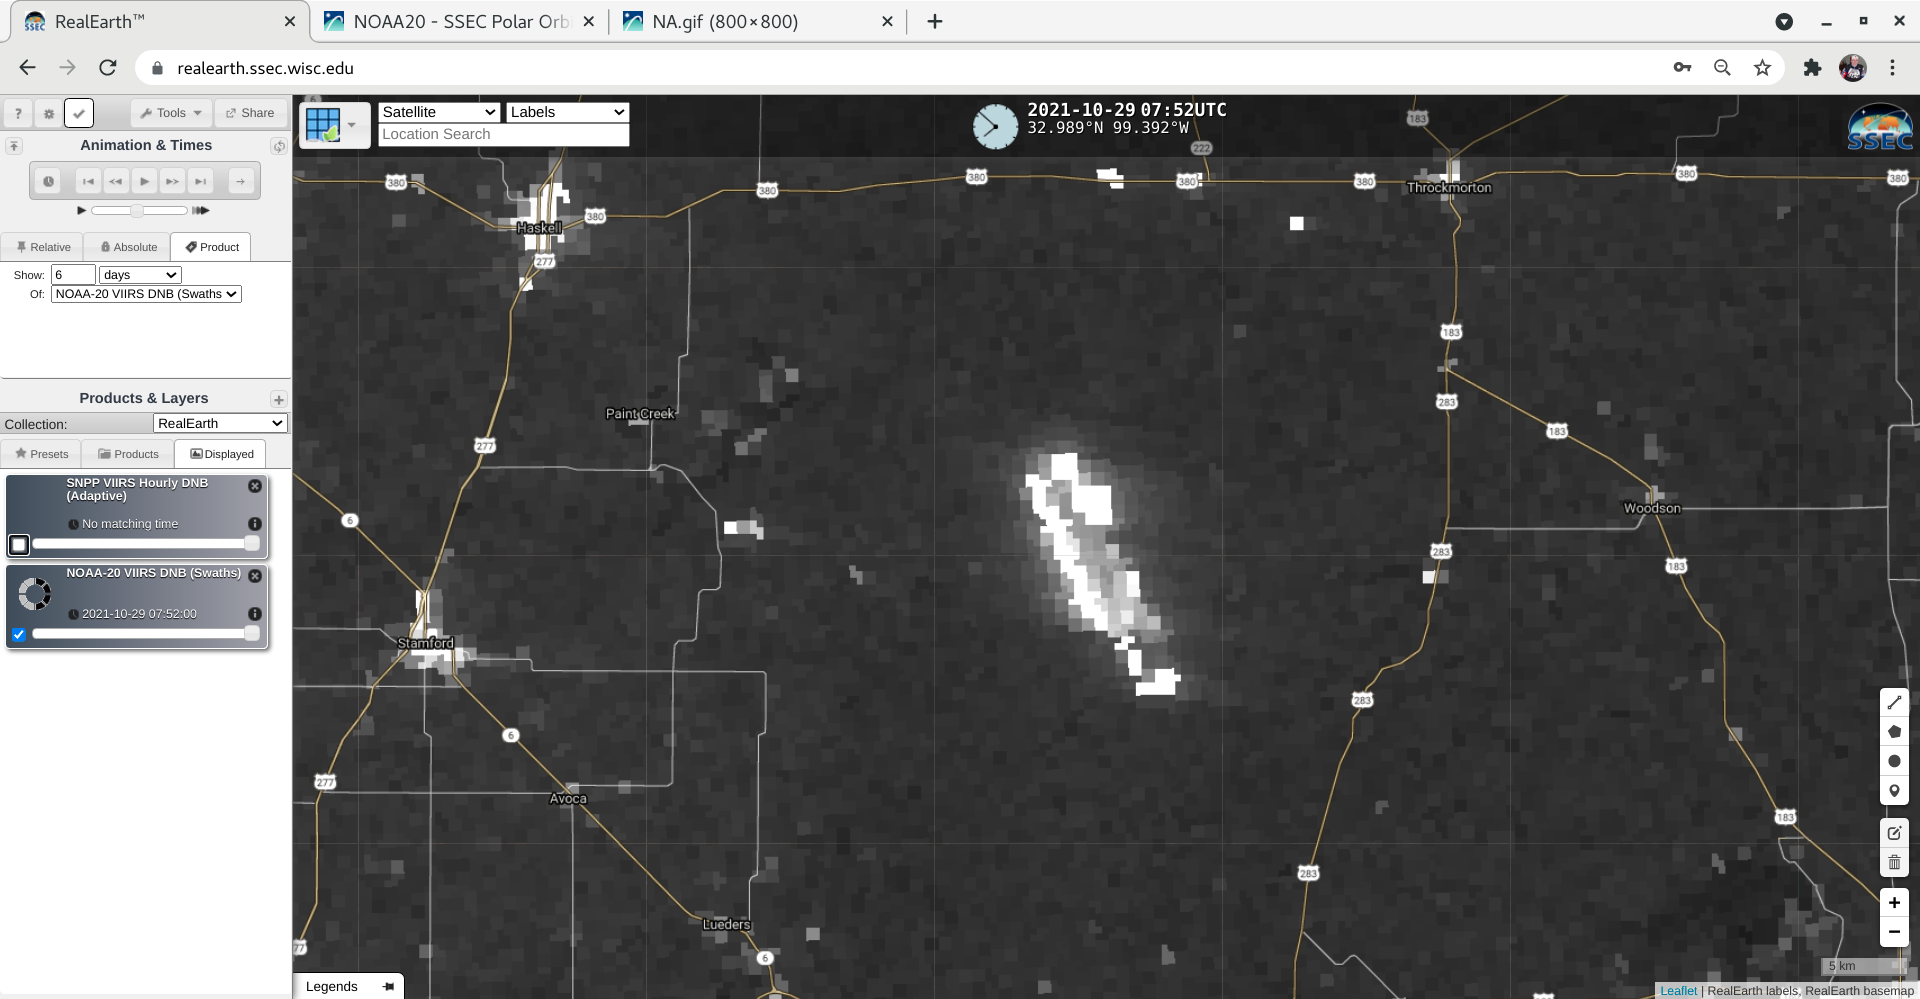
NOAA-20 VIIRS DayNight Band image at 0816 UTC [click to enlarge]
During the subsequent nighttime hours, the bright glow of the Buck Fire could be seen on a NOAA-20 VIIRS Day/Night Band image at 0816 UTC or 3:16 am CDT, as viewed using RealEarth(above).
The fire continued to burn into the following day — and the burn scar could be seen in NOAA-20 VIIRS True Color and False Color images (below).
NOAA-20 VIIRS True Color and False Color RGB images [click to enlarge]
GOES-16 True Color RGB images (below) again displayed a long smoke plume that was transported southeastward.
GOES-16 True Color RGB images [click to play animated GIF | MP4]
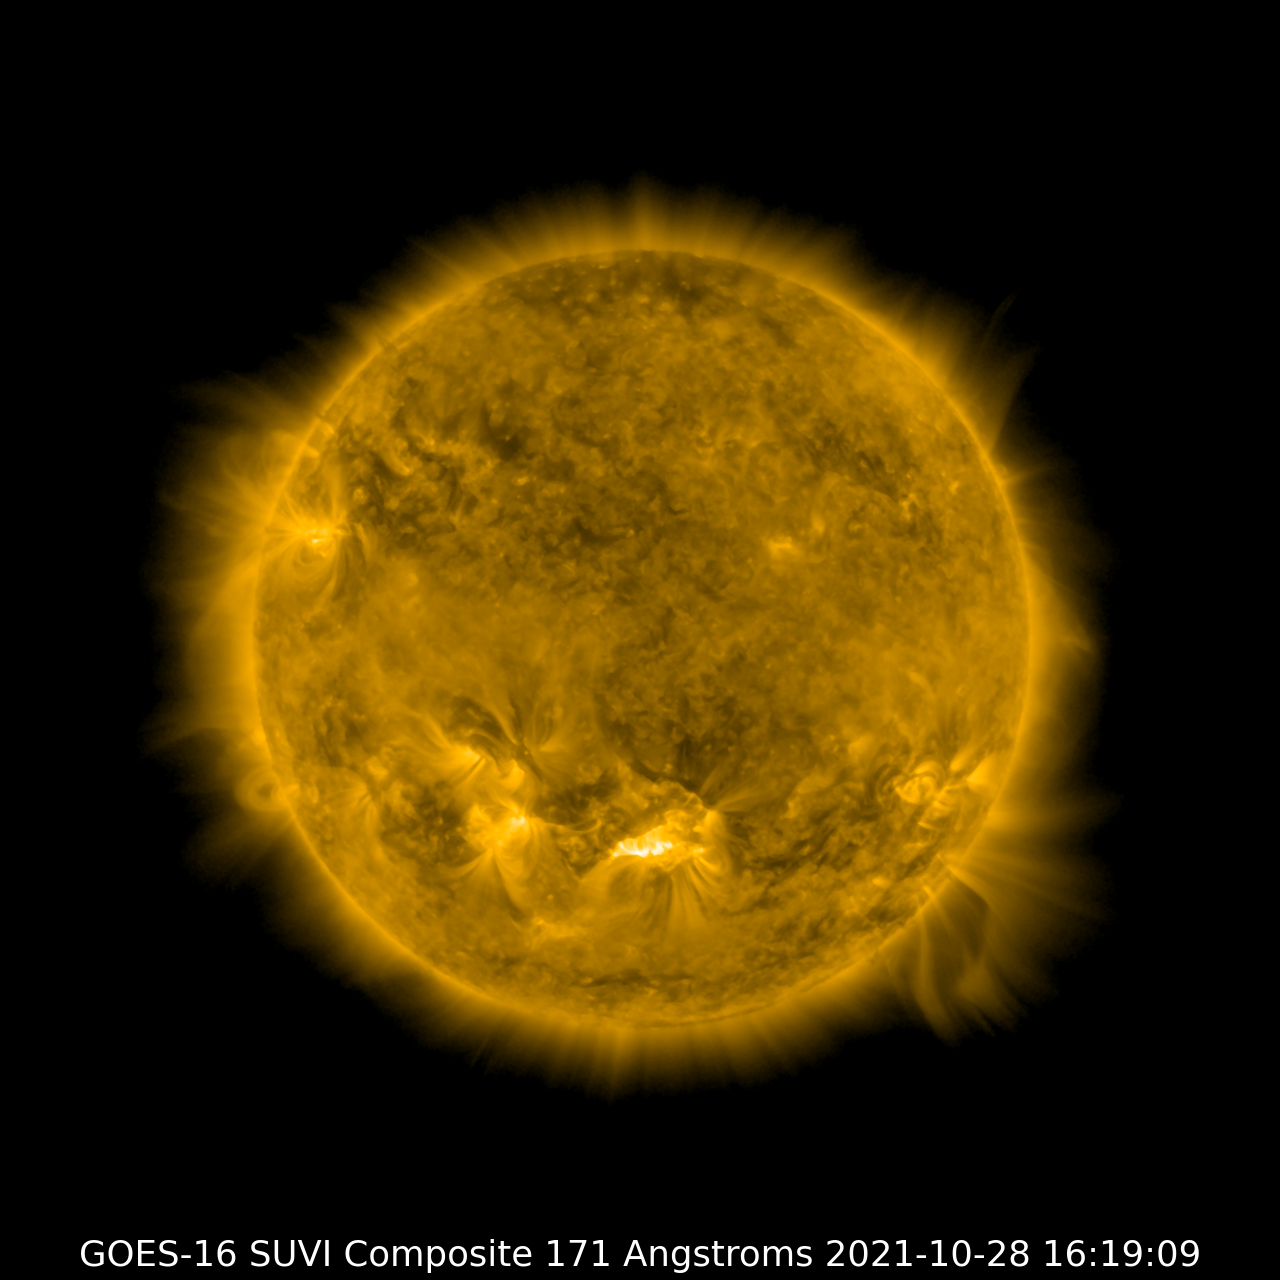
Sometimes space weather can be just as noteworthy as weather on Earth. There was an X1 solar flare on October 28, 2021, at 10:35AM CDT (15:35Z) detected by the GOES Solar Ultraviolet Imager (SUVI). The GOES-16 and 17 satellites each house the SUVI, which is an extreme ultraviolet telescope that... Read More
Sometimes space weather can be just as noteworthy as weather on Earth. There was an X1 solar flare on October 28, 2021, at 10:35AM CDT (15:35Z) detected by the GOES Solar Ultraviolet Imager (SUVI). The GOES-16 and 17 satellites each house the SUVI, which is an extreme ultraviolet telescope that detects photons that are not detectable from the Earth’s surface.
This type of X1 solar flare event can affect Earth’s conditions. Today’s solar flare is associated with a “strong” R3 radio blackout in which high frequency radio communication can be impaired. The NOAA Space Weather Prediction Center (SWPC) is responsible for observing and forecasting flares. More information is available here.
The GOES-16 Solar Ultraviolet Imager (SUVI) detects a solar flare at 304 Å occurring at 15:35Z October 28, 2021.The same flare from SUVI observed at 171 Å.
This SWPC site shows solar animations at various wavelengths and updates in real-time.
NOAA SWPC is also in charge of monitoring and forecasting aurora (the northern lights, aurora borealis, or southern lights, aurora australis). Aurora occur as a result of solar flare activity that releases energy into Earth’s magnetic field. NOAA Space Weather has issued a “G3” geomagnetic storm watch, predicting aurora visible as far south as Pennsylvania, Iowa, and Oregon through this Saturday October 30. More information on aurora and aurora forecasts can be found here.
To visualize different characteristics of the sun, CIMSS scientists have built a webapp tool called an “RGB maker” for SUVI data in which data at three different wavelengths are combined to create an image. You can find the tool here. (Note for users: select your red, green, and blue wavelengths and then combine channels. General users can ignore adjusting the scale and gamma factors.)
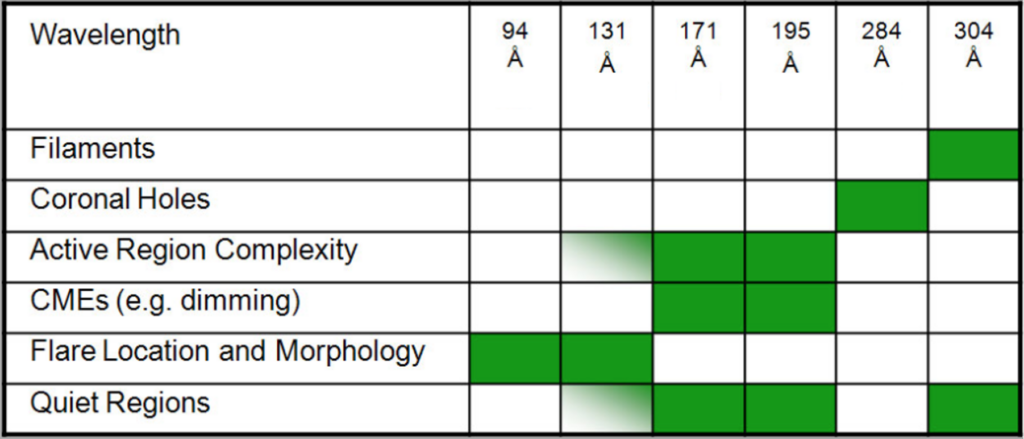
The SUVI RBG maker functions similarly to how traditional Red Green Blue satellite composites are created, only it combines from the six SUVI bands. Those band wavelengths are: 94 Å, 131 Å, 171 Å, 195 Å, 284 Å, and 304 Å. [One Å (pronounced Angstrom) is equal to 0.0001 microns or 1e-10 meters.] The table below lists the type of solar phenomena that are observable with each band.
Six wavelength bands detect solar phenomenon on SUVI. Space weather forecasters use this data to observe solar flares and monitor Coronal Mass Ejections (CMEs), for example.
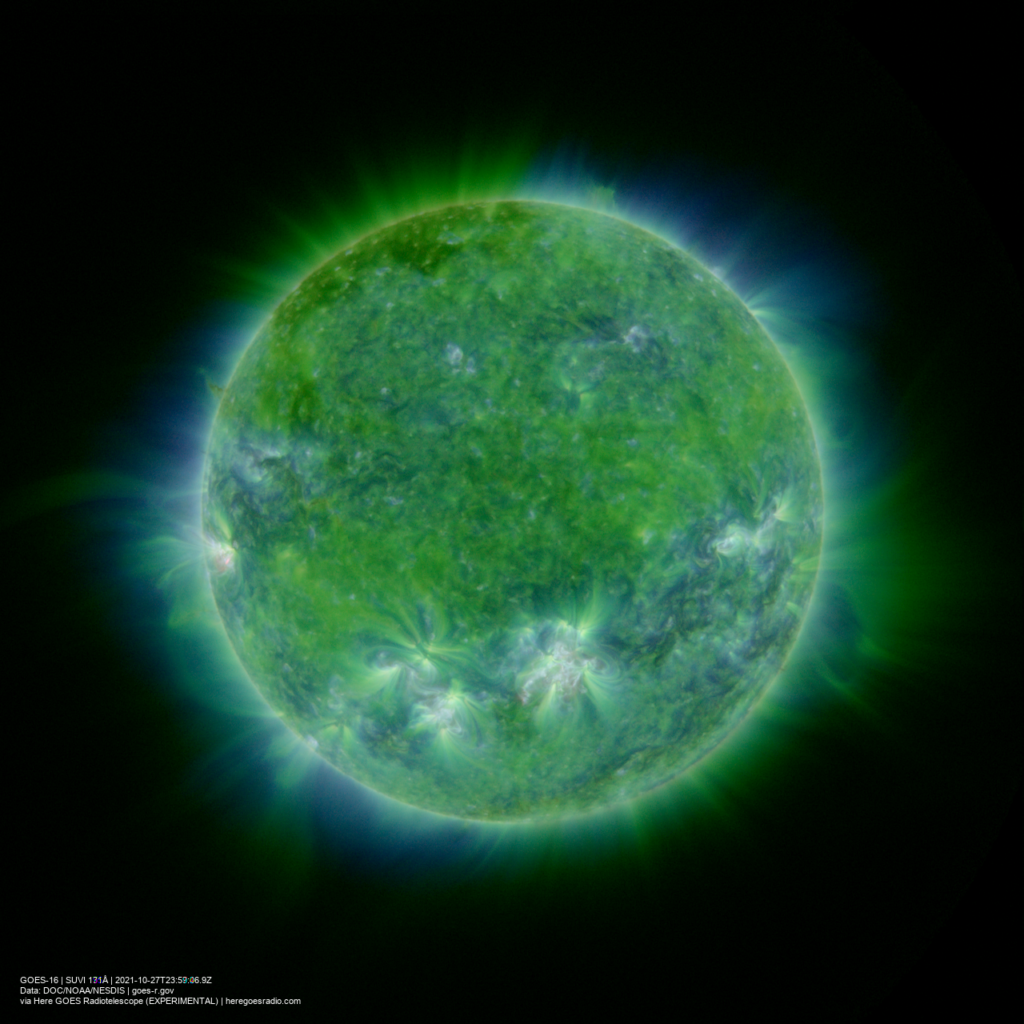
Here are some examples of solar RBG composites created with the CIMSS SUVI RGB maker.
A SUVI composite made with the CIMSS RGB maker combining channels 131 Å, 171 Å, and 195 Å.
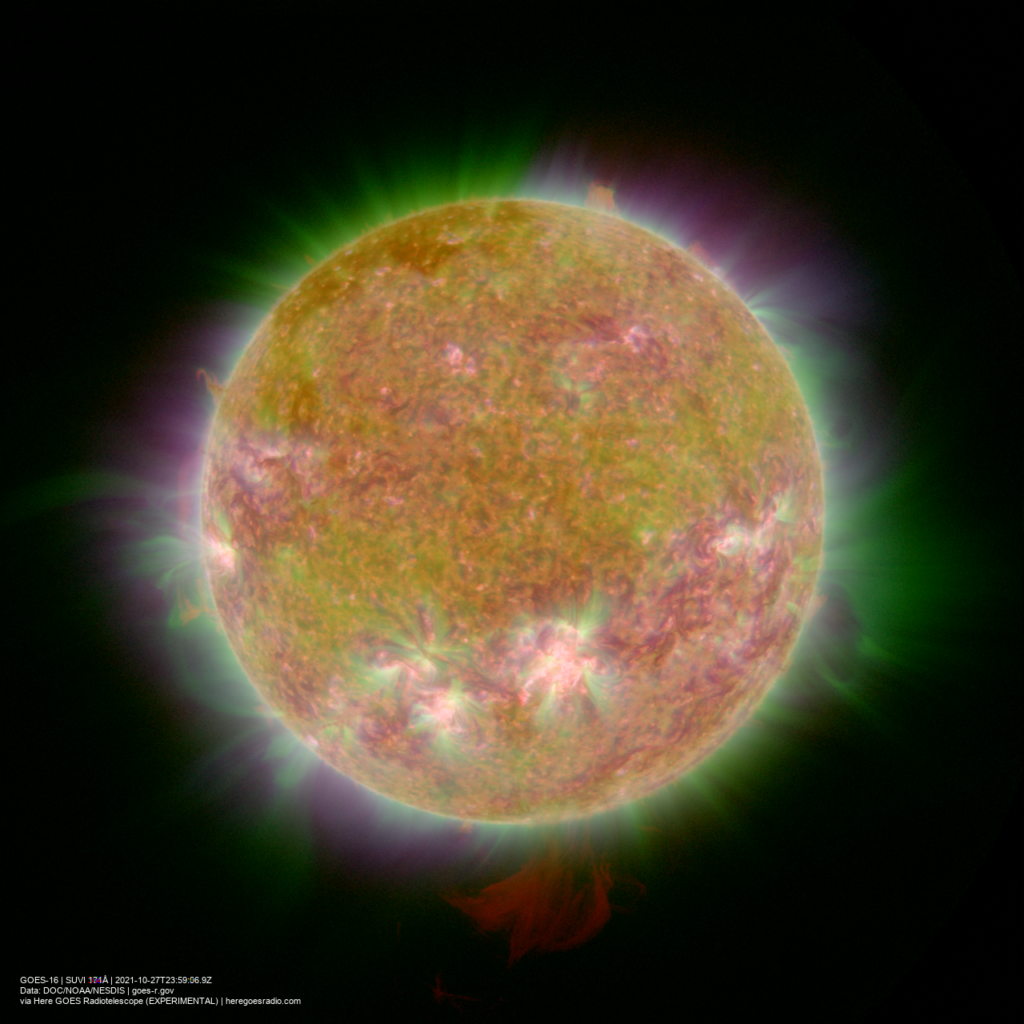
A SUVI composite made with the CIMSS RGB maker combining channels 304 Å, 171 Å, and 195 Å.


