This website works best with a newer web browser such as Chrome, Firefox, Safari or Microsoft
Edge. Internet Explorer is not supported by this website.
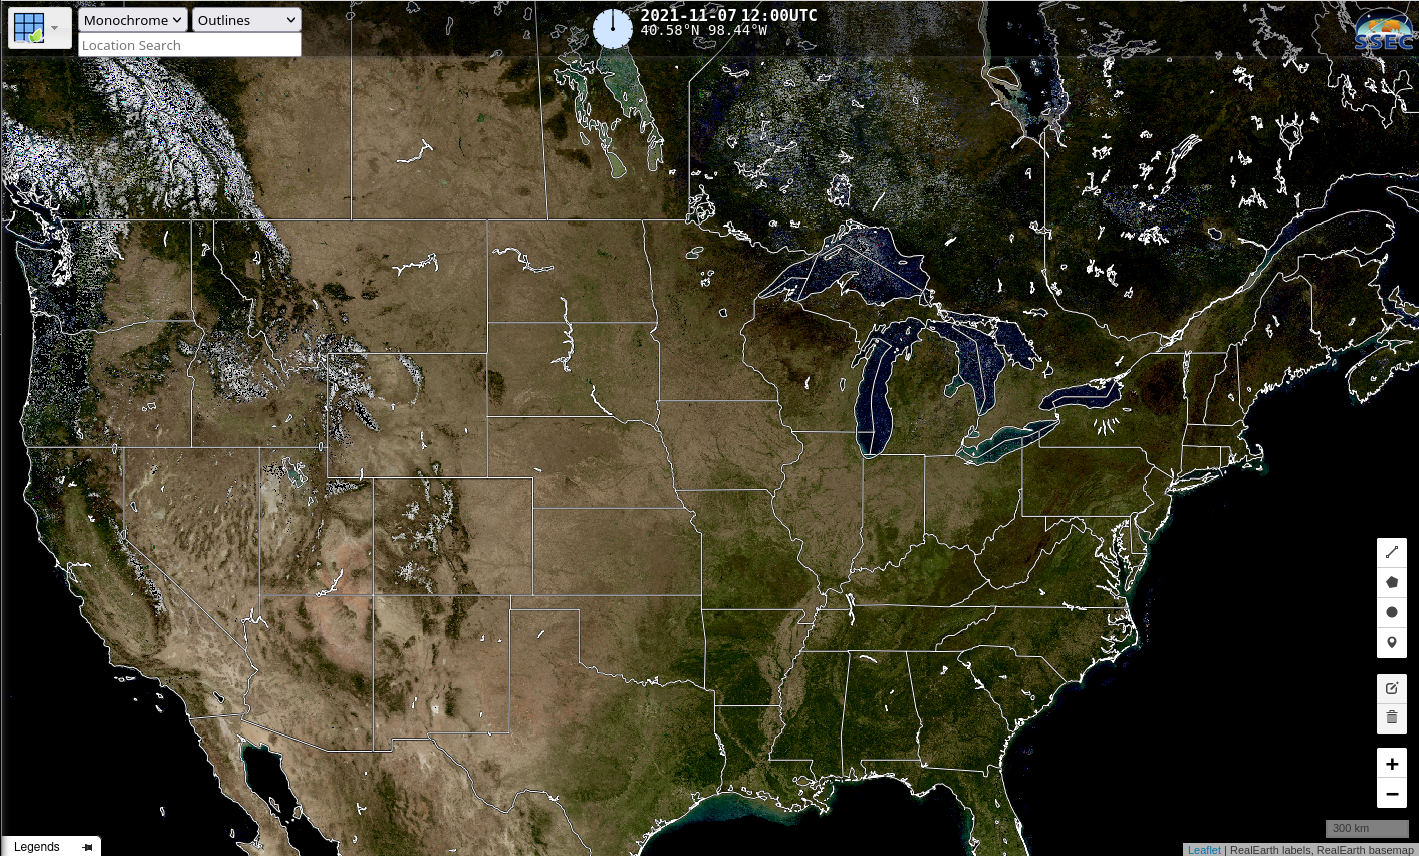
A MODIS-based true-color cloud-free image, above, from SSEC’s Real Earth (link) shows a distinct lack of snow cover — for early November!!! — over the USA and Canada. These BRDF (Bidirectional Reflectance Distribution Function) fields account for sun angle, viewing angle and surface type; data over the past 16 days are used in... Read More
BRDF Imagery from MODIS, 7 November 2021 (Click to enlarge)
A MODIS-based true-color cloud-free image, above, from SSEC’s Real Earth (link) shows a distinct lack of snow cover — for early November!!! — over the USA and Canada. These BRDF (Bidirectional Reflectance Distribution Function) fields account for sun angle, viewing angle and surface type; data over the past 16 days are used in this computation. Monitor these fields at the RealEarth link in the coming weeks to see the inevitable (albeit delayed!) increase in snow cover over North America!
Imagery from the NOAA/CIMSS Volcanic Monitoring website (link) shows derived Ash loading (above) from the 3 November eruption of Karymsky on the Kamchatka peninsula. The website identified an eruption beginning around 0720 UTC, with an obvious eruptive plume by 0740 UTC. In addition to Ash Loading, shown above, Ash Height... Read More
Himawari-8 derived Ash Loading, 0440 – 1230 UTC on 3 November 2021
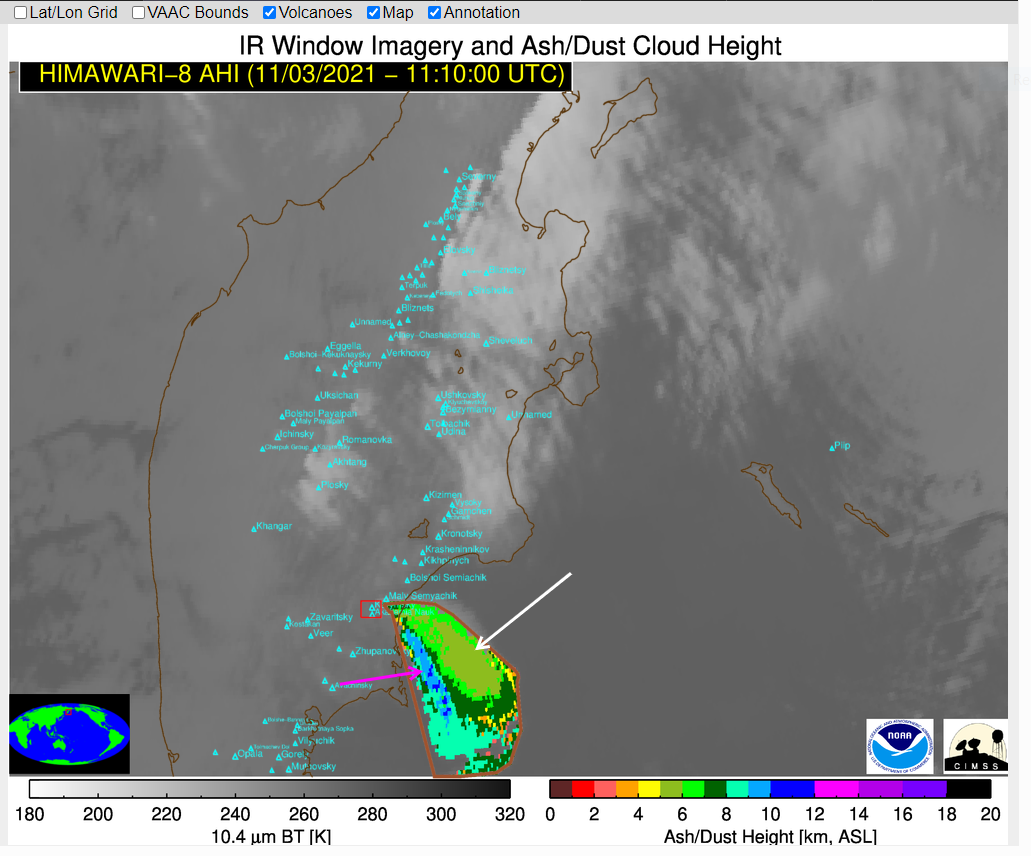
Imagery from the NOAA/CIMSS Volcanic Monitoring website (link) shows derived Ash loading (above) from the 3 November eruption of Karymsky on the Kamchatka peninsula. The website identified an eruption beginning around 0720 UTC, with an obvious eruptive plume by 0740 UTC. In addition to Ash Loading, shown above, Ash Height (click here for an 8-h mp4 animation) was also derived; a still image from 1110 UTC, below, shows two separate plumes, one around 6 km (indicated by the white arrow), one closer to 10-12 km (indicated by the magenta arrow).
Retrieved Volcanic Ash height, 1110 UTC on 3 November 2021 (Click to enlarge)
In addition to quantitative estimates of ash, Himawari-8 (and GOES-R and GK2A) channels can be combined in RGBs to highlight qualitatitely regions where ash is likely. The animation below (from Scott Bachmeier) shows the Ash RGB. (Click here for a Quick Guide on this RGB)
Himawari-8 Ash RGB Imagery showing the Karymsky Ash Cloud, 0710-1250 UTC 3 November 2021 (click to enlarge)
A tip of the (winter) Hat to Nathan Eckstein, NWS AAWU in Anchorage, for alerting us to this event.
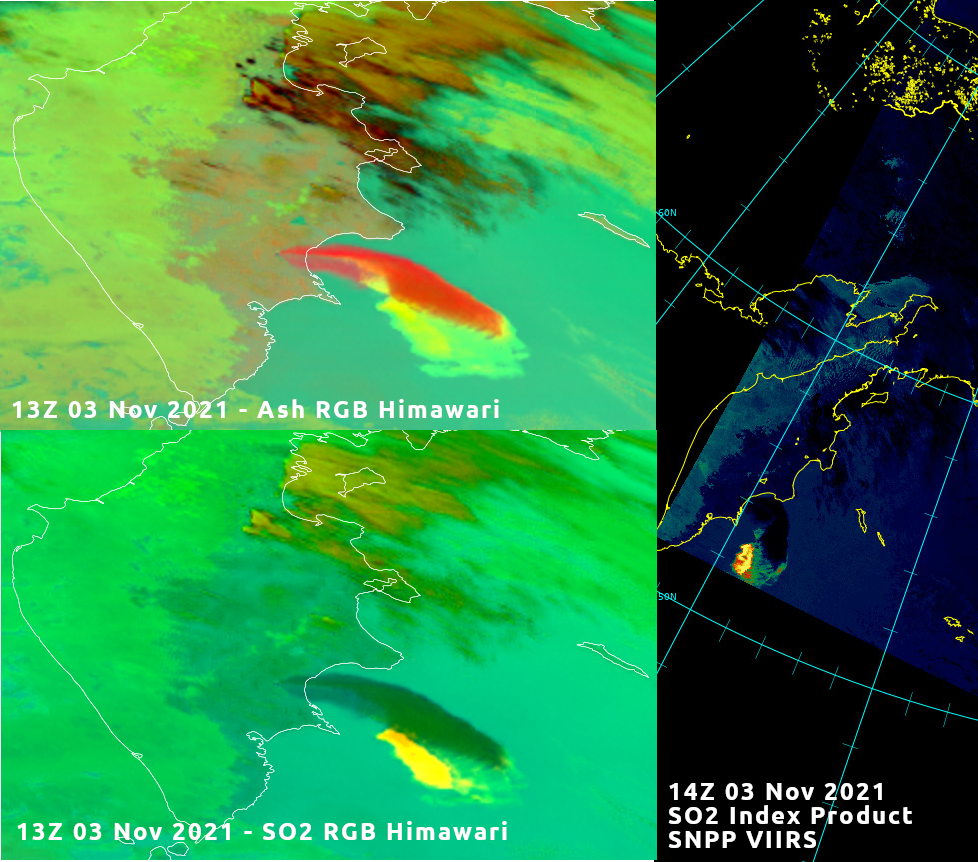
Update: Nate Eckstein sent along the following Himawari imagery time-matched with VIIRS SO2 Index imagery provided by Carl Dierking at GINA. The 1300 UTC RGB imagery suggests that the north (and east, given the projection) side of the plume is rich in ash whereas the southern (and western) part of the plume contains more SO2. The Suomi NPP VIIRS SO2 Index product (more information on that product is here) tells a similar story: most of the SO2 from this eruption is confined to the southwestern portion of the plume.
Himawari-8 RGB products from 1300 UTC on 3 November 2021: Ash RGB (upper left) and SO2 RGB (lower left); a VIIRS SO2 Index image from 1400 UTC on 3 November 2021. (click to enlarge)
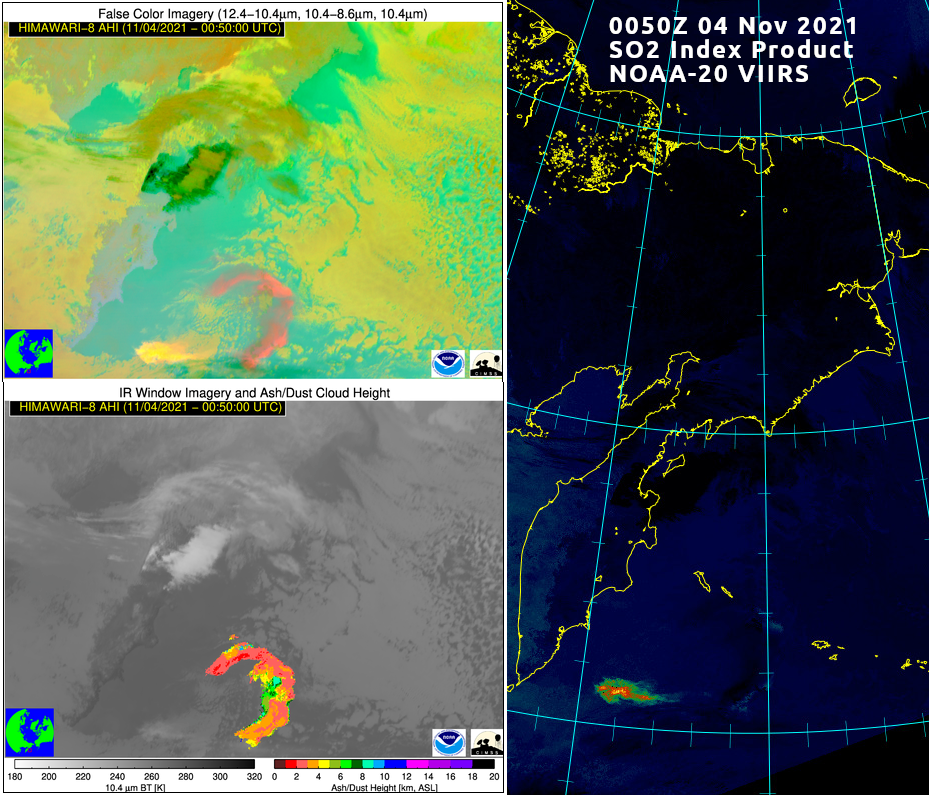
Imagery from later (0050 UTC on 4 November), below, tells a similar story. The SO2 aspect of the plume can be detected in the False Color Imagery below in the upper left — the region of bright yellow to the south of the arcing red feature that is the ash cloud. Ash/Dust Cloud Height (below, bottom left) keys in on that arced feature, and the SO2-rich feature is mostly ignored in the figure. In contrast, the SO2 index product, below on the right, from NOAA-20 VIIRS data at 0050 UTC, shows a strong signal of SO2 — but the arcing ash cloud is barely apparent!
Himawari-8 False Color Imagery, upper left, at 0050 UTC on 4 November 2021; Himawari-8 Derived Ash/Dust Height Product, lower left, also at 0500 UTC on 4 November 2021 (both images from https://volcano.ssec.wisc.edu); NOAA-20 VIIRS SO2 Index, 0500 UTC on 4 November 2021 (Click to enlarge)
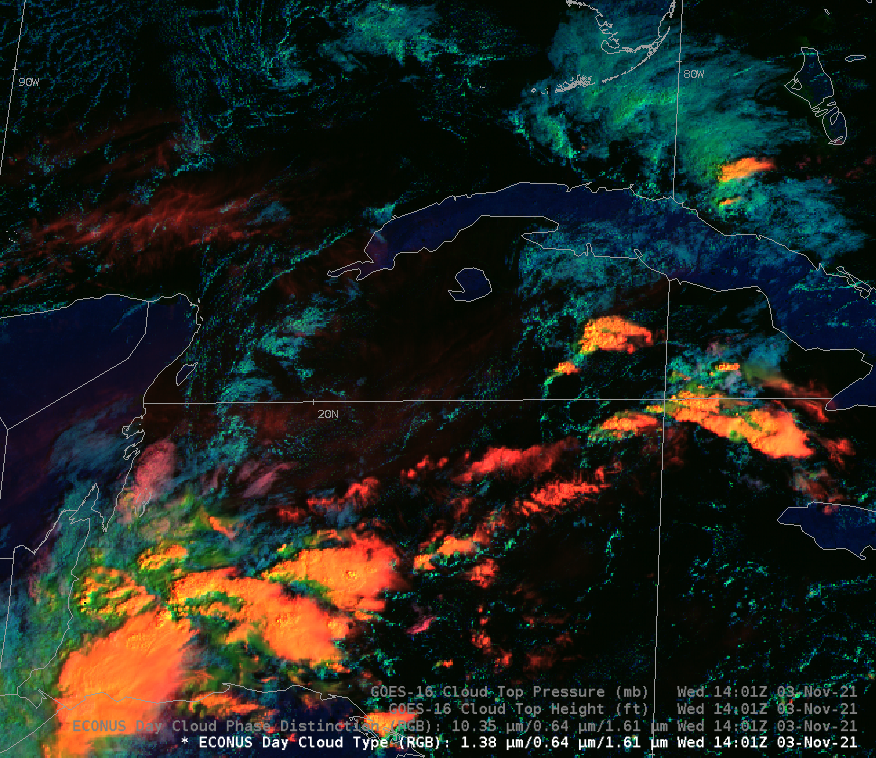
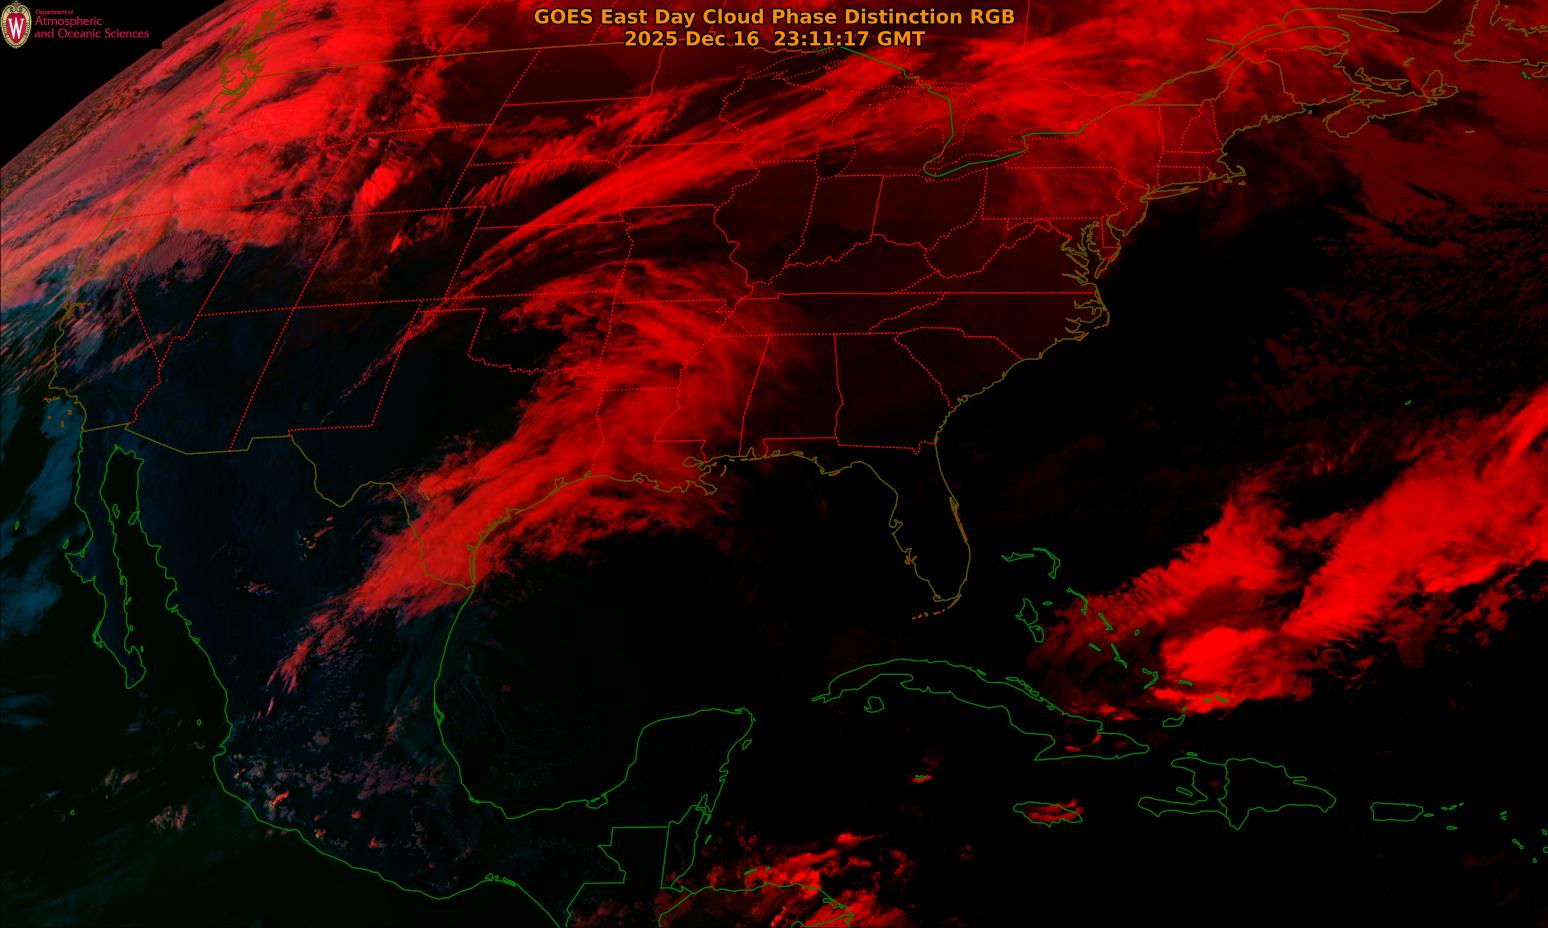
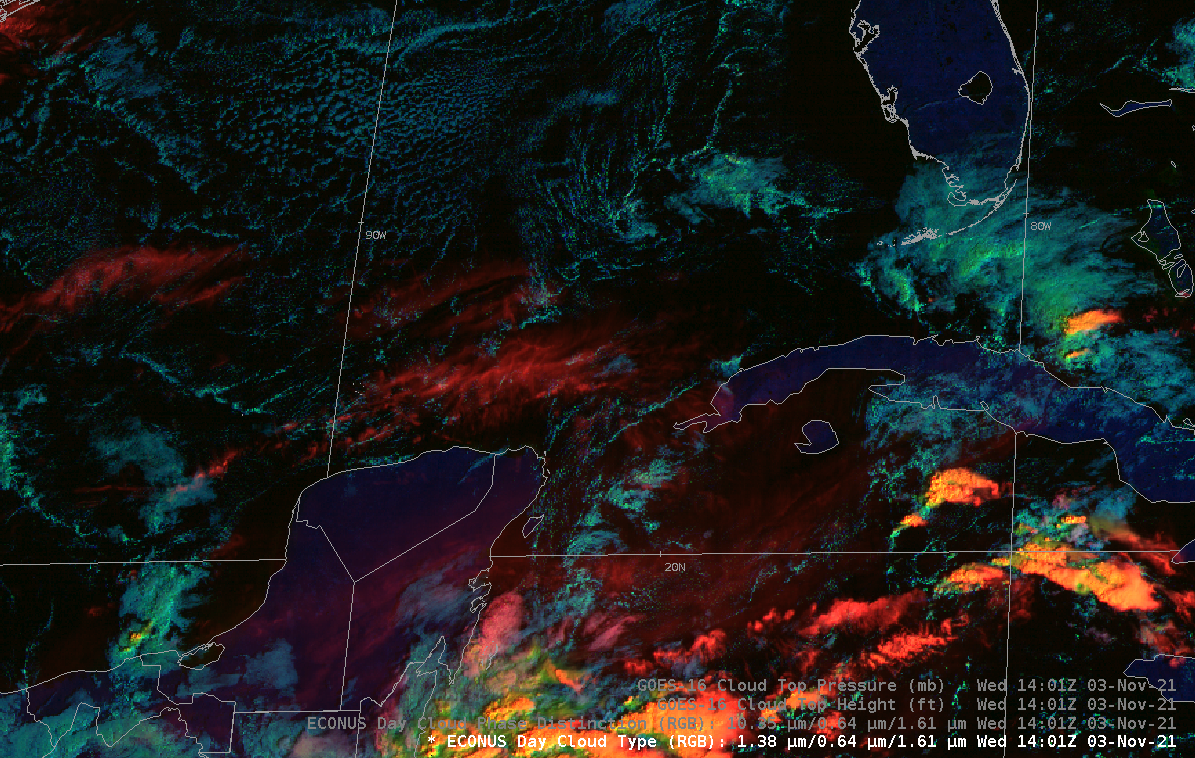
A new RGB will be implemented into AWIPS in the near future: it is scheduled for the next TOWR-S build to be released in December. Developed by NESDIS Geo Senior Scientist and Cirrus Channel (GOES-R Band 4, 1.38 µm) aficionado Dr. Andy Heidinger, the Day Cloud Type RGB starts with... Read More
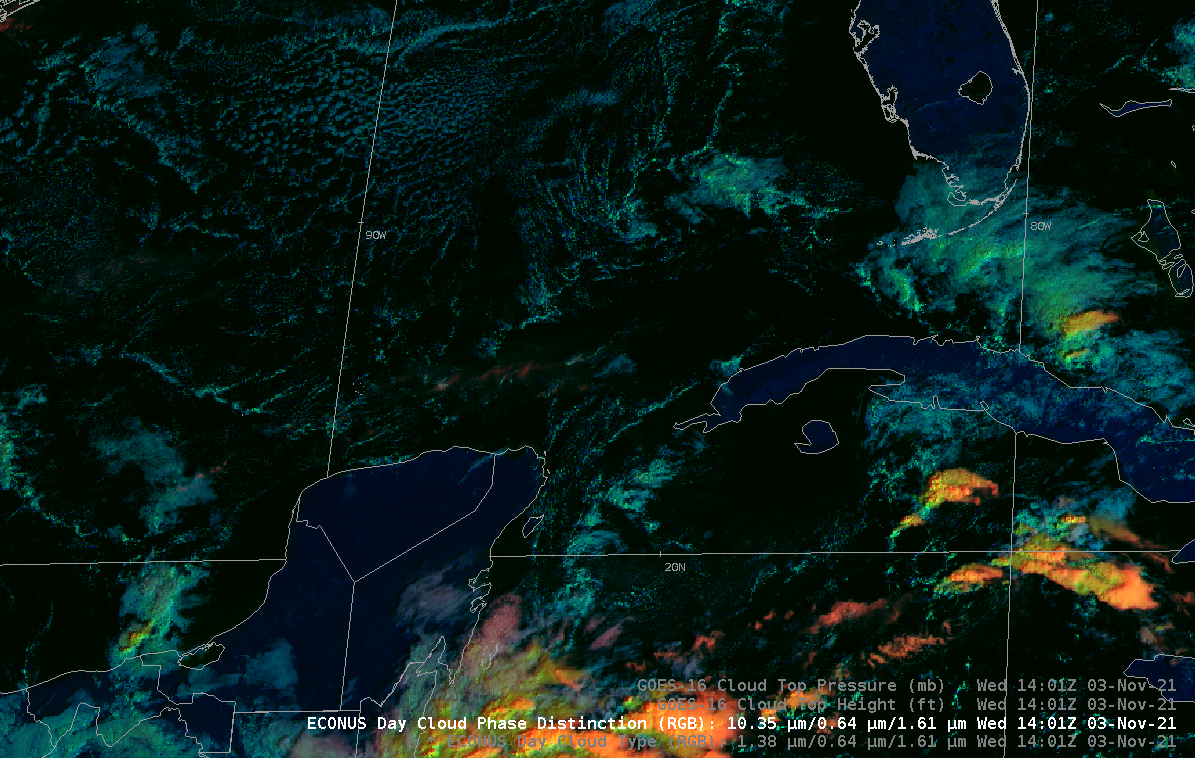
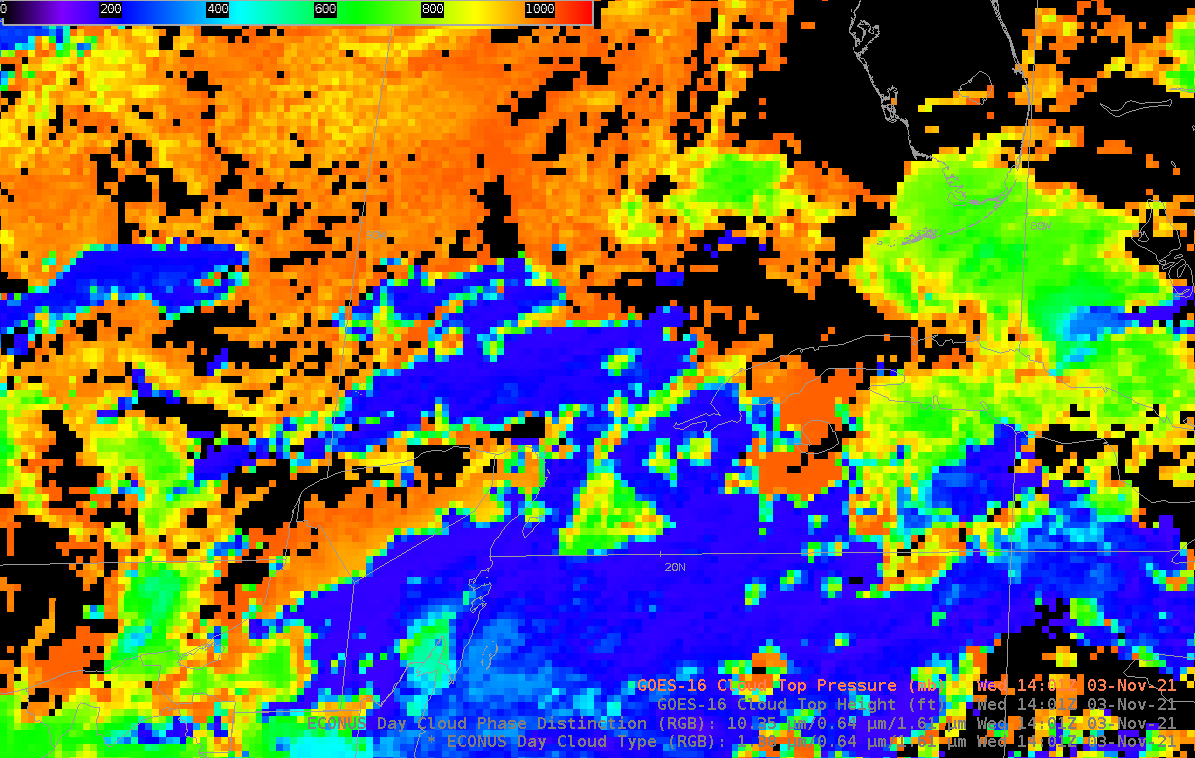
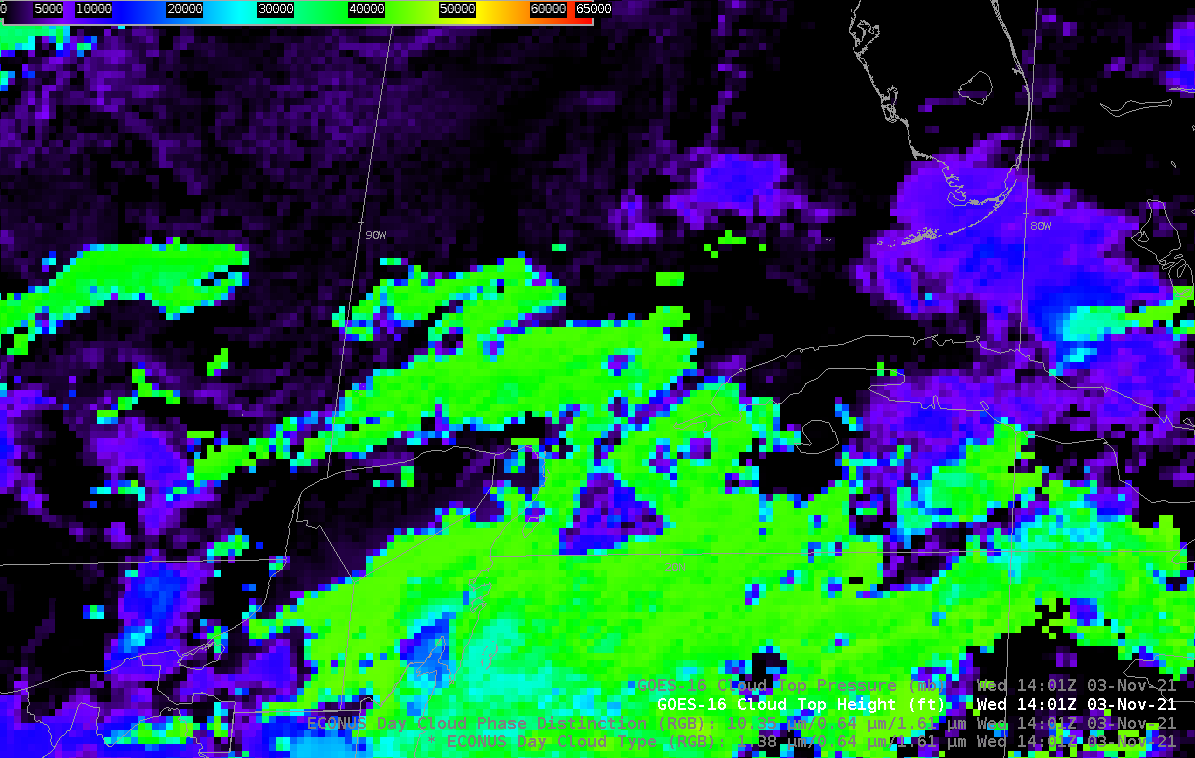
GOES-16 Day Cloud Type RGB, Day Cloud Phase Distinction RGB, Level 2 Cloud Top Pressure, all at 1401 UTC on 3 November 2021 (Click to enlarge)
A new RGB will be implemented into AWIPS in the near future: it is scheduled for the next TOWR-S build to be released in December. Developed by NESDIS Geo Senior Scientist and Cirrus Channel (GOES-R Band 4, 1.38 µm) aficionado Dr. Andy Heidinger, the Day Cloud Type RGB starts with the Day Cloud Phase Distinction RGB (available online here, for example) and substitutes Cirrus Channel (Band 4, 1.38 µm) information for the Band 13 (10.3 µm) Clean Window information in the ‘Red’ component of the RGB. The result is much better detection of thin cirrus in this daytime-only product, as shown in the toggle above that includes the Day Cloud Type and Day Cloud Phase Distinction RGBs as well as the Level 2 Cloud Top Pressure. Note in particular the thin cirrus in the Gulf of Mexico just to the north of the Yucatán Peninsula. Cloud properties for this thin cirrus also show up in the Level Cloud Top Pressure (shown in the toggle above) and in Cloud Top Height.
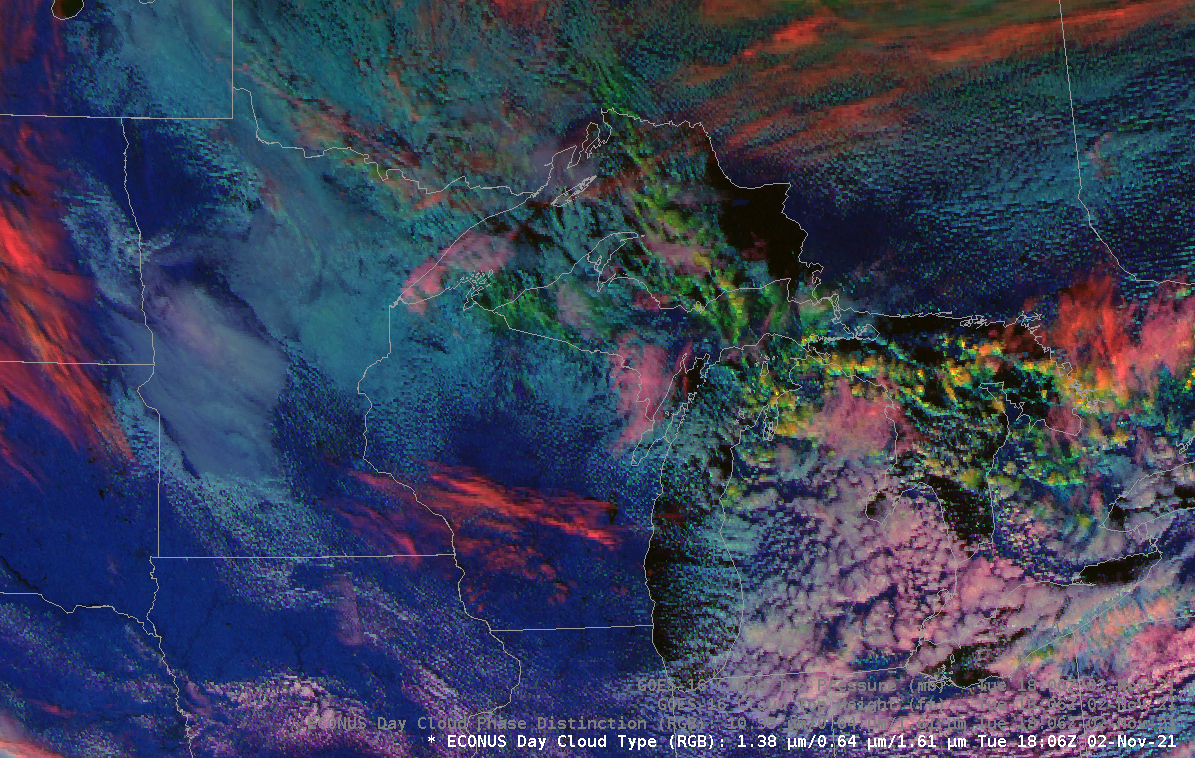
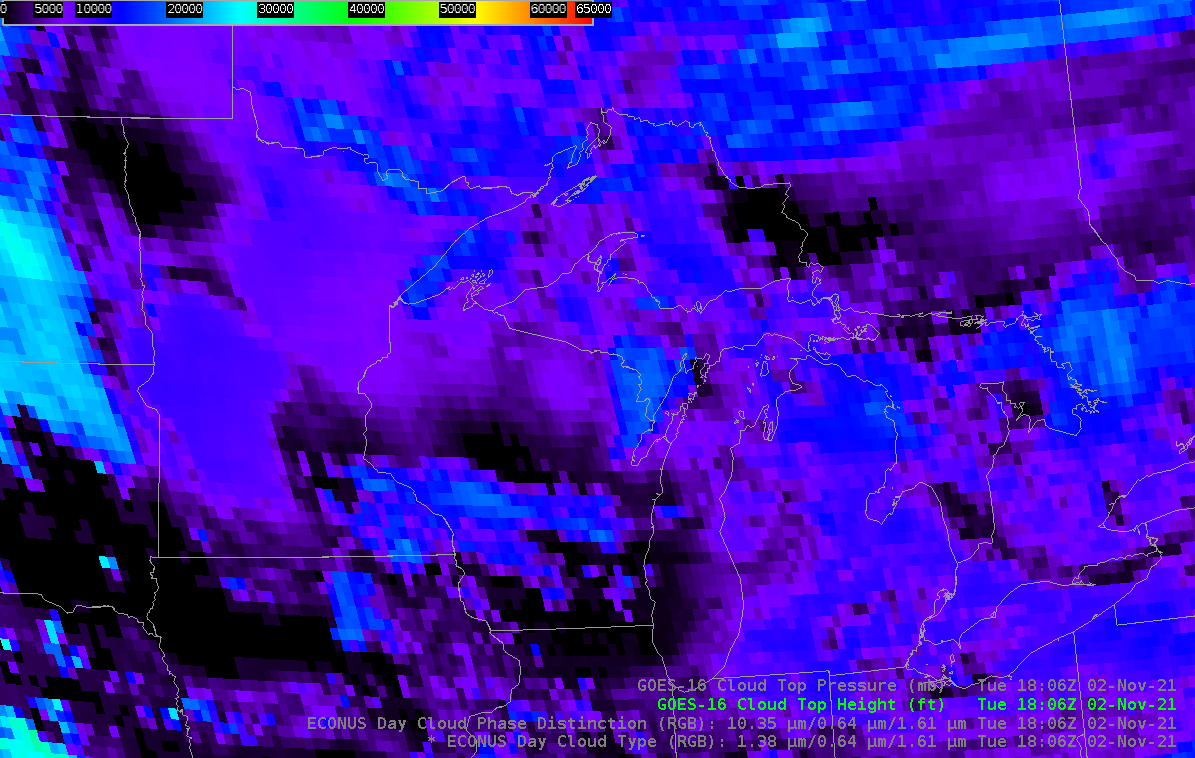
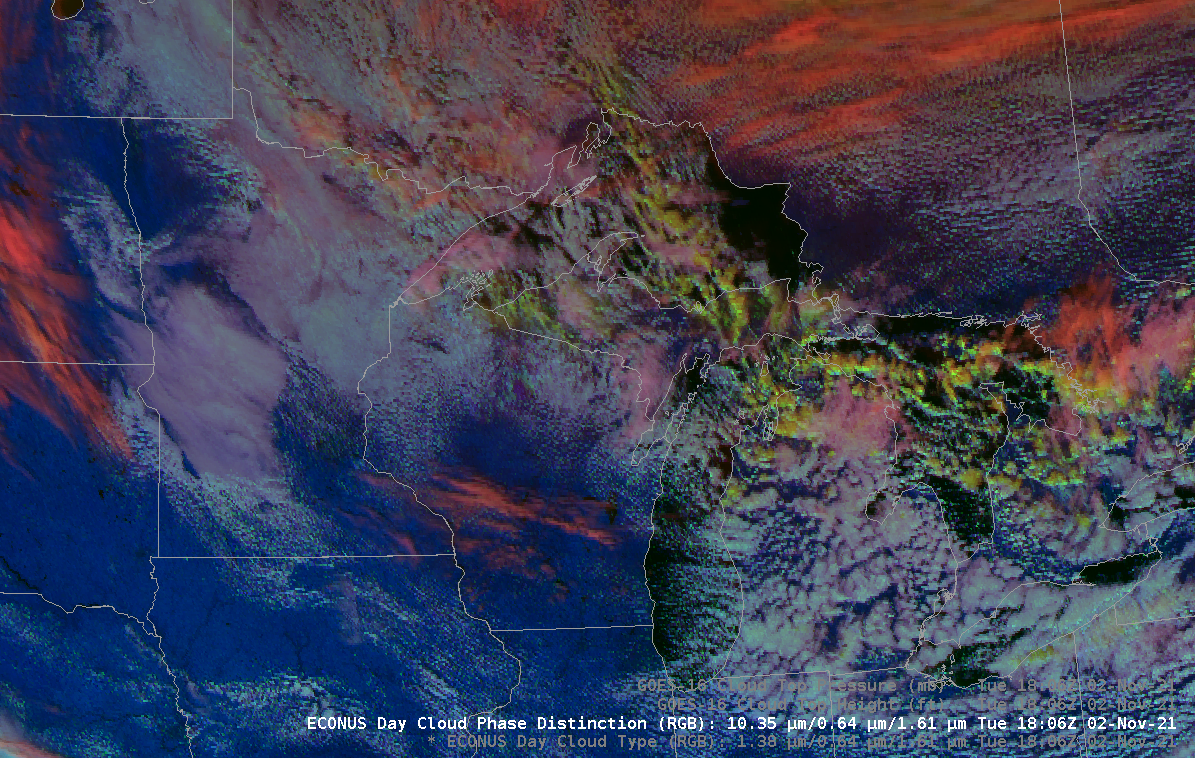
A similar relationship is shown in the toggle below, from 1806 UTC on 2 November. Note the thin cirrus over central Wisconsin, for example: much more obvious in the Day Cloud Type RGB, and present in the Cloud Top Pressure (and Cloud Top Height) product. A similar relationship is apparent over central North Dakota and over northern Ontario: the Day Cloud Type RGB better isolates regions of highest cirrus compared to the Day Cloud Phase Distinction RGB.
GOES-16 Day Cloud Type RGB, Day Cloud Phase Distinction RGB, Level 2 Cloud Top Pressure, all at 1806 UTC on 2 November 2021 (Click to enlarge)
A preliminary Quick Guide for the Day Cloud Type RGB is here. XML Code used to add this RGB to AWIPS is available from the blogpost author.
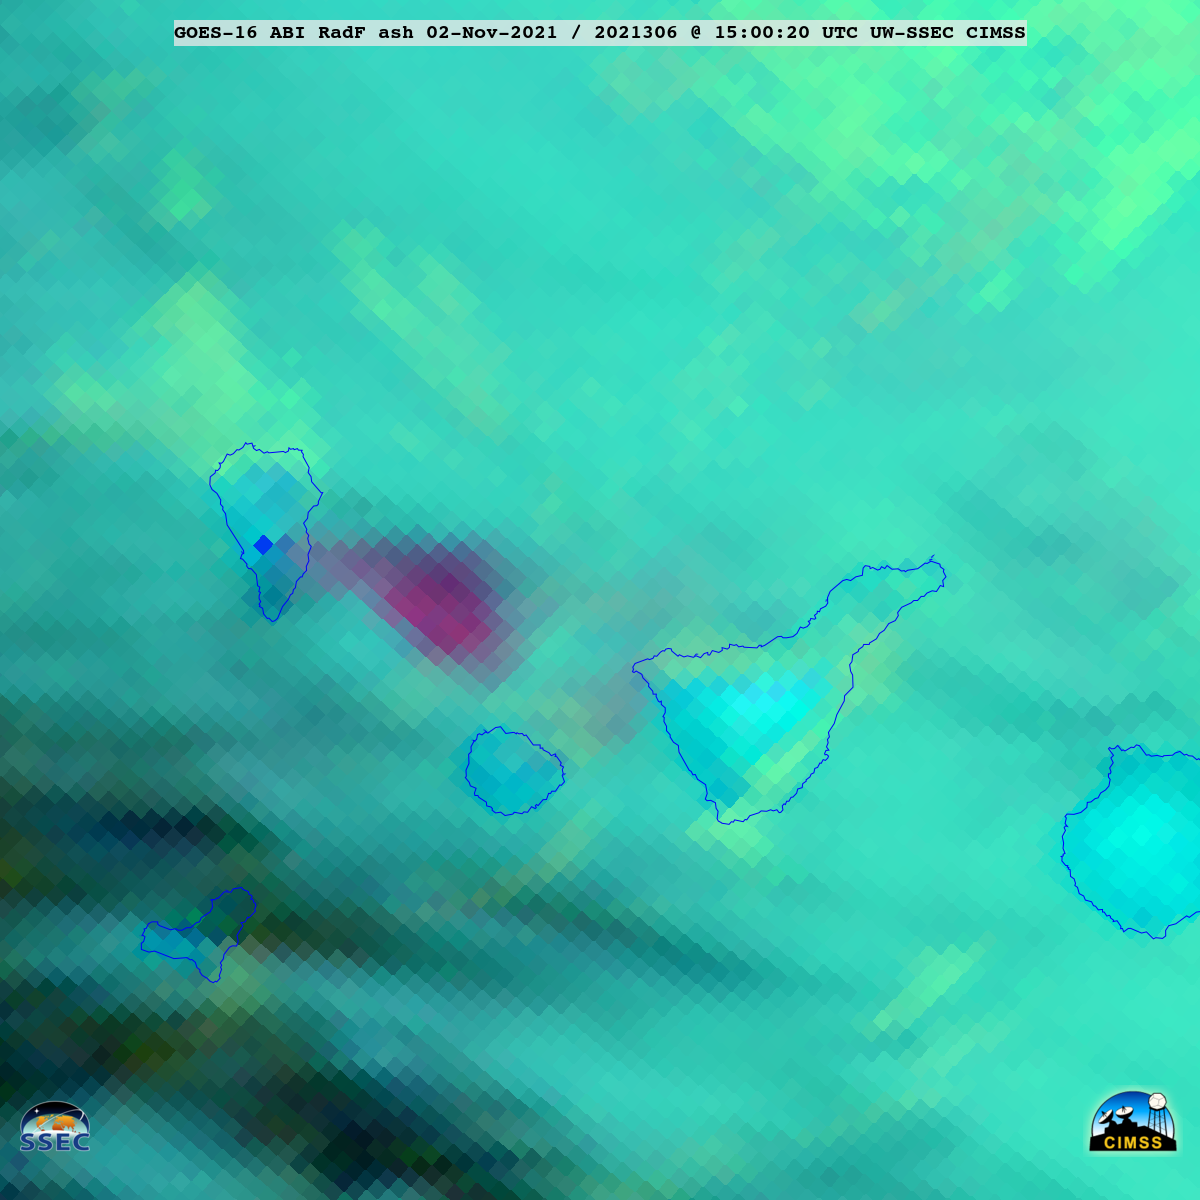
GOES-16 (GOES-East) True Color RGB images created using Geo2Grid (above) showed the east-southeastward drift of ash-laden volcanic clouds from Cumbre Vieja on La Palma in the Canary Islands on 02 November 2021. Since this current eruptive period began on 19 September, intermittent periods of volcanic clouds with an elevated ash content have been observed... Read More
GOES-16 True Color RGB images [click to play animated GIF | MP4]
GOES-16 (GOES-East) True Color RGB images created using Geo2Grid(above) showed the east-southeastward drift of ash-laden volcanic clouds from Cumbre Vieja on La Palma in the Canary Islands on 02 November 2021. Since this current eruptive period began on 19 September, intermittent periods of volcanic clouds with an elevated ash content have been observed — and on this particular day, the darker tan to light brown appearance was an indication that higher ash concentrations were likely.
The corresponding GOES-16 Ash RGB images (below) extended an hour further, past sunset. The hues of pink to purple suggested the presence of higher concentrations of volcanic ash.
GOES-16 Ash RGB images [click to play animated GIF | MP4]
Ash Loading product [click to play animated GIF | MP4]
Compared to previous eruptions on 19 September and 09 October, the Ash RGB signature was more pronounced on this day; this was due to a significantly higher ash loading (above) of larger-radius ash particles (below). These 2 radiometrically-retrieved products are from the NOAA/CIMSS Volcanic Cloud Monitoring site.
Ash Effective Radius product [click to play animated GIF | MP4]


