This website works best with a newer web browser such as Chrome, Firefox, Safari or Microsoft
Edge. Internet Explorer is not supported by this website.
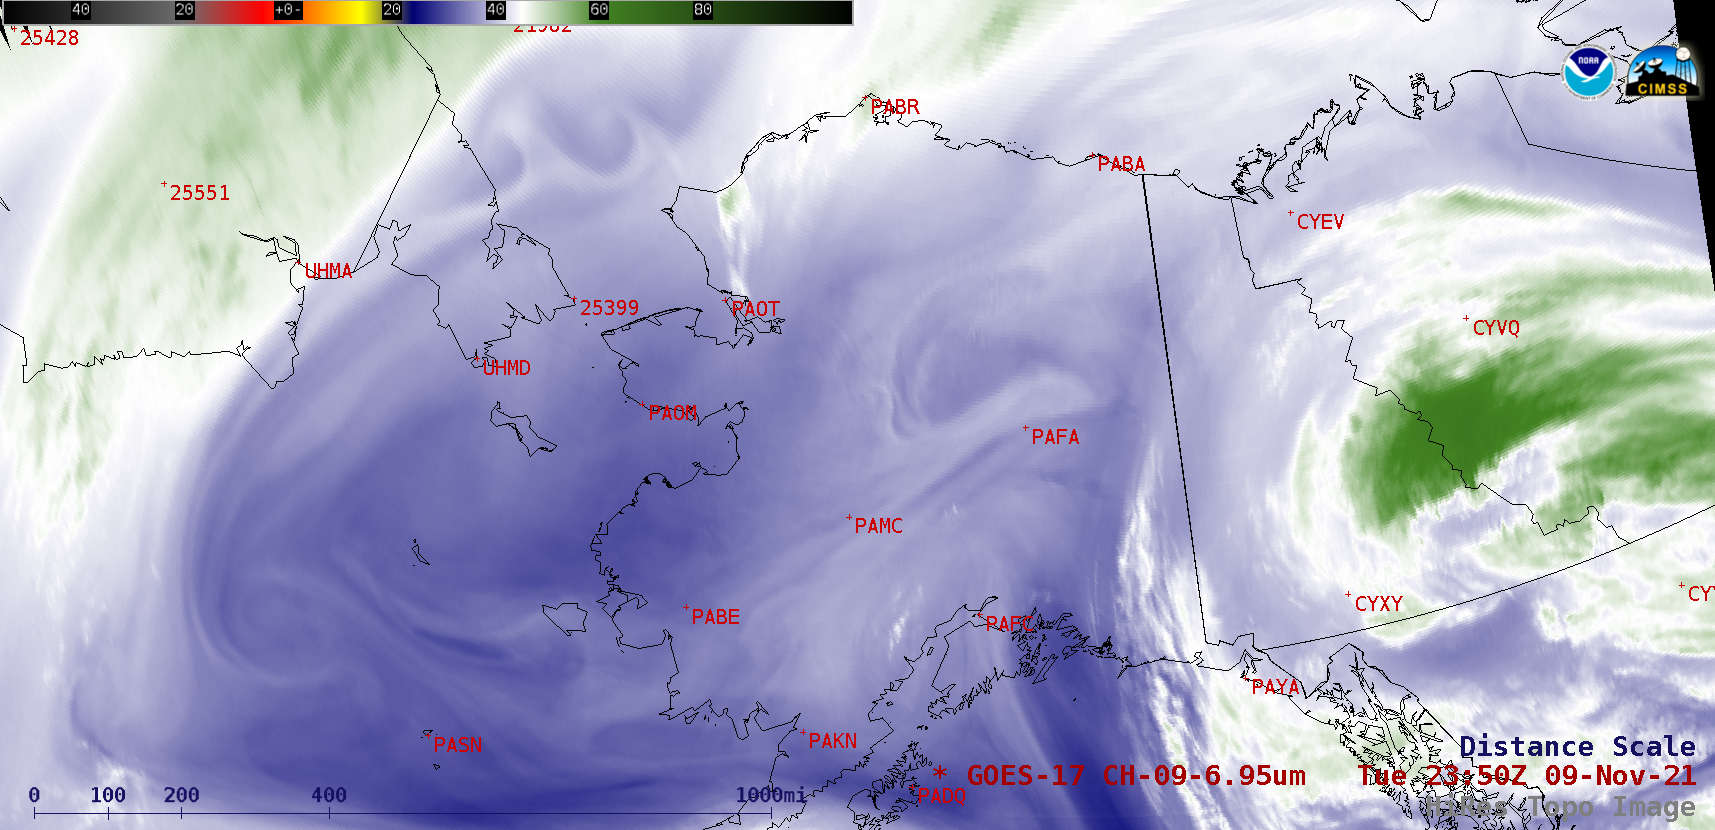
GOES-17 (GOES-West) Mid-level (6.9 µm) Water Vapor images (above) revealed a complex pattern of middle-tropospheric vortices moving slowly west-southwestward over Interior Alaska and the Chukchi / Bering Seas on 09 November 2021. Note that the cold (brighter white) peaks of a few of the higher mountain ranges — including Denali — could... Read More
GOES-17 Mid-level Water Vapor (6.9 µm) images [click to play animated GIF | MP4]
GOES-17 (GOES-West) Mid-level (6.9 µm) Water Vapor images (above) revealed a complex pattern of middle-tropospheric vortices moving slowly west-southwestward over Interior Alaska and the Chukchi / Bering Seas on 09 November 2021. Note that the cold (brighter white) peaks of a few of the higher mountain ranges — including Denali — could be seen.
The presence of a relatively dry air mass across those areas allowed the signature of higher terrain to be evident in Water Vapor images — since a dry air mass has the effect of shifting the peaks of Water Vapor weighting functions to lower altitudes. The weighting function of the 6.9 µm spectral band (calculated from rawinsonde data at 12 UTC on 09 November and 00 UTC on 10 November) is plotted in blue for Fairbanks and Anchorage (below).
GOES-17 water vapor weighting functions for Fairbanks, Alaska [click to enlarge]
GOES-17 water vapor weighting functions for Anchorage, Alaska [click to enlarge]
Plots of GOES-17 parallax direction and magnitude for objects at altitudes of 15,000 feet (4.5 km) and 30,000 feet (9.1 km) are shown below (source), and help to explain the slight north-northwestward shift of the brighter white (colder) high-terrain signature in the Water Vapor imagery.
Plots of GOES-17 parallax direction (green arrows) and parallax magnitude (km, red) for objects at altitudes of 15,000 and 30,000 feet (4.5 and 9.1 km) [click to enlarge]
The Advanced Clear Sky Processor for Ocean algorithm is part of the Community Software Processing Package (CSPP), CIMSS-maintained software that can be applied to Direct Broadcast data, such as those data from NOAA-20 and Suomi-NPP (and other satellites) downloaded at two antennae at CIMSS. CSPP will create AWIPS-ready tiles so that SST information can be... Read More
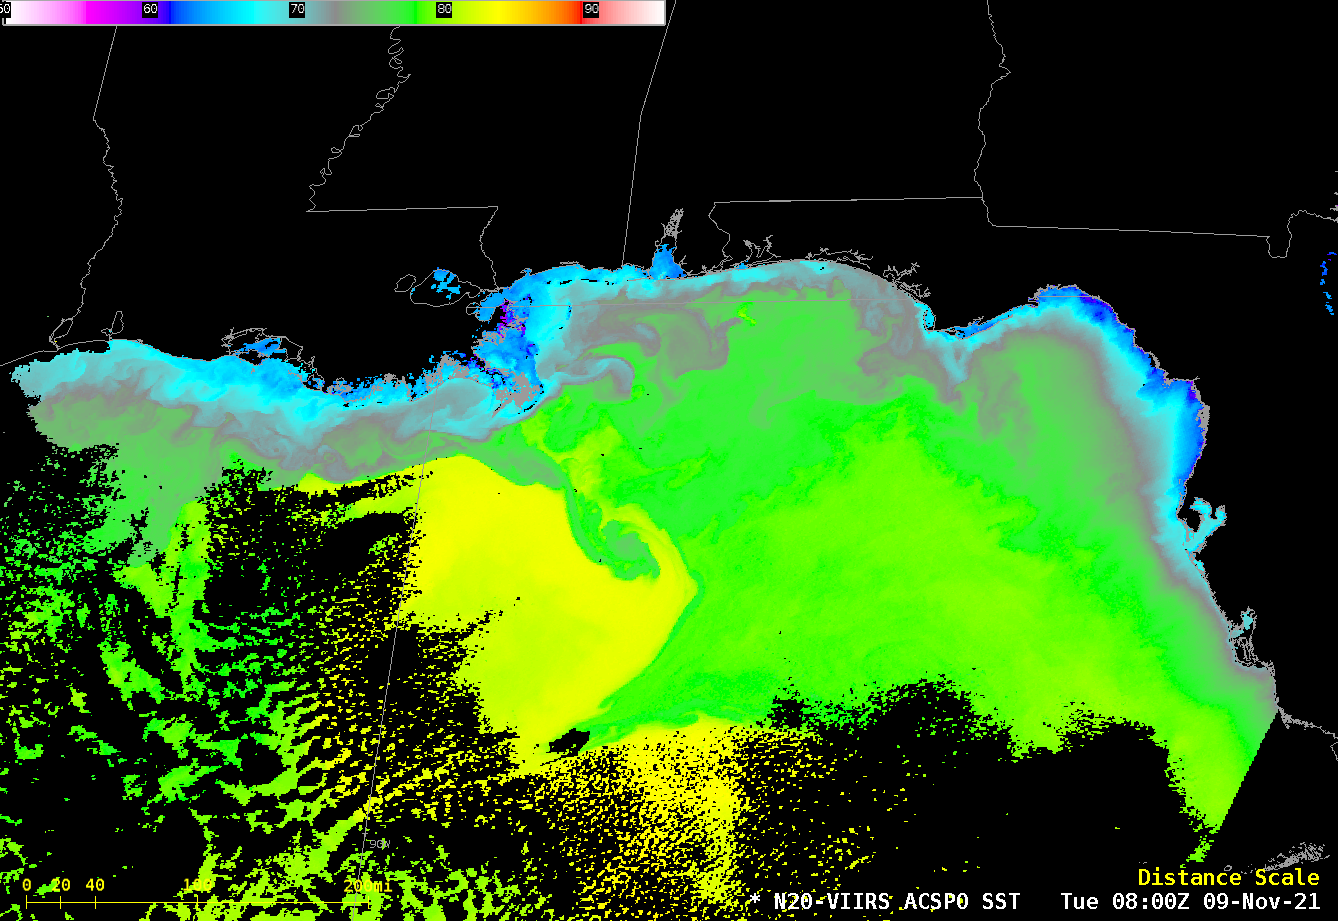
ACSPO SSTs over the northern Gulf of Mexico derived from NOAA-20 VIIRS data, 0800 UTC 09 Nov 2021 (Click to enlarge)
The Advanced Clear Sky Processor for Ocean algorithm is part of the Community Software Processing Package (CSPP), CIMSS-maintained software that can be applied to Direct Broadcast data, such as those data from NOAA-20 and Suomi-NPP (and other satellites) downloaded at two antennae at CIMSS. CSPP will create AWIPS-ready tiles so that SST information can be viewed within AWIPS (as shown above and below) and the AWIPS-ready tiles are available via LDM feed from CIMSS (images — rather large — are also routinely available online: here for the image above, here for the Suomi-NPP-derived image below).
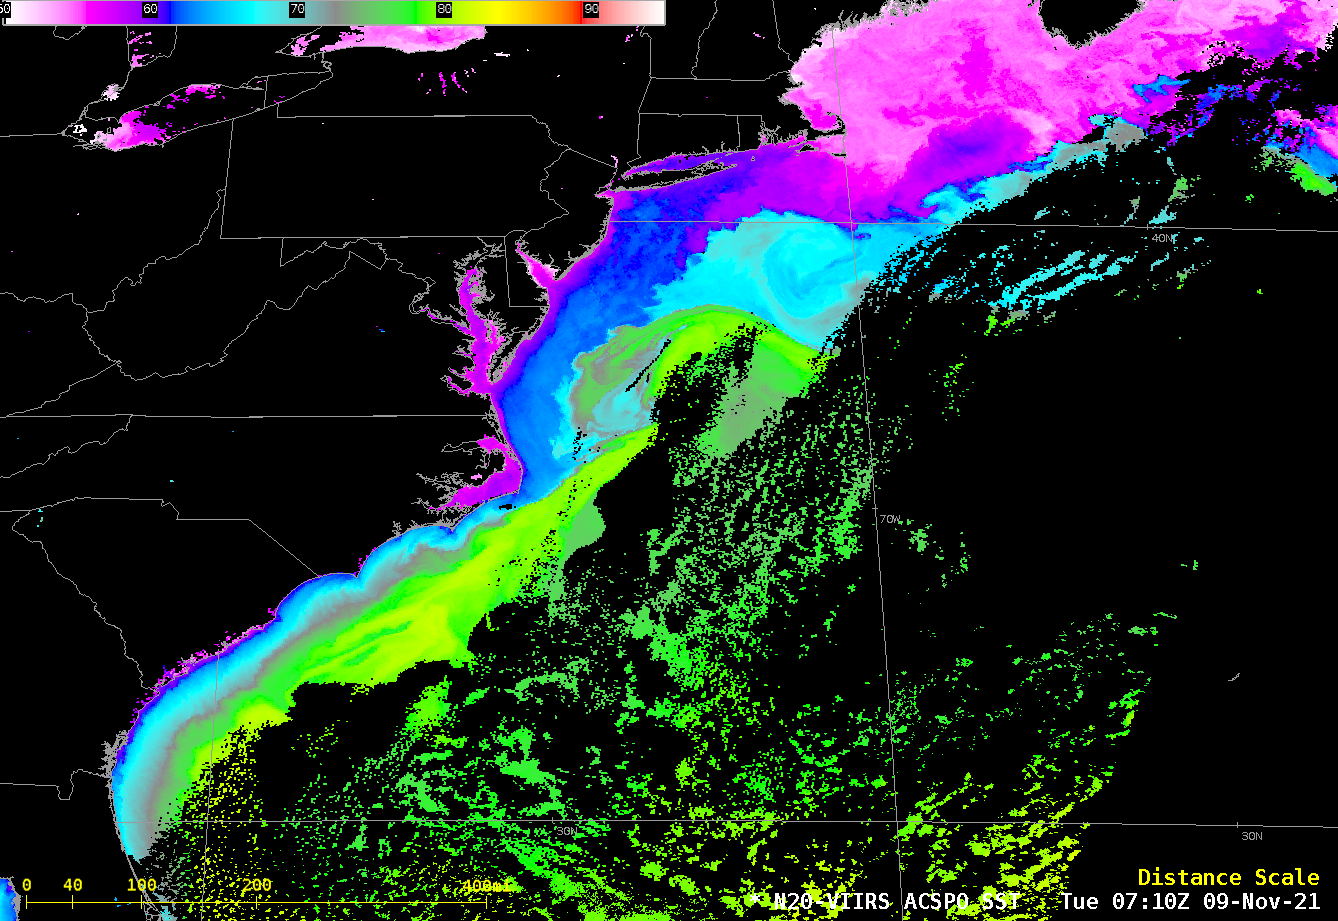
Both SST images show remarkable gradients in sea surface temperature: upper 60s (cyan) to low 80s (yellow) just south of Louisiana in less than 20 miles (above); low 60s (blue) to 80 (chartreuse) to the east of the Outer Banks, also in less than 20 miles (below). The warmest water in the Gulf of Mexico is around 83º F, and shelf water is in the mid-60s. Warmest Gulf Stream waters are around 81º F. Magenta values correspond to temperatures in the 50s.
ACSPO SSTs over the northern Gulf of Mexico derived from Suomi-NPP VIIRS data, 0710 UTC 09 Nov 2021 (Click to enlarge)
On the morning of Sunday, November 7th, numerous elongated hole punch clouds were visible over the Upper Midwest, including parts of Wisconsin, Illinois, Iowa, and Minnesota. Also called fall streak clouds, these are a relatively rare phenomenon that form because of the unusual properties of cloud droplets.While most people know... Read More
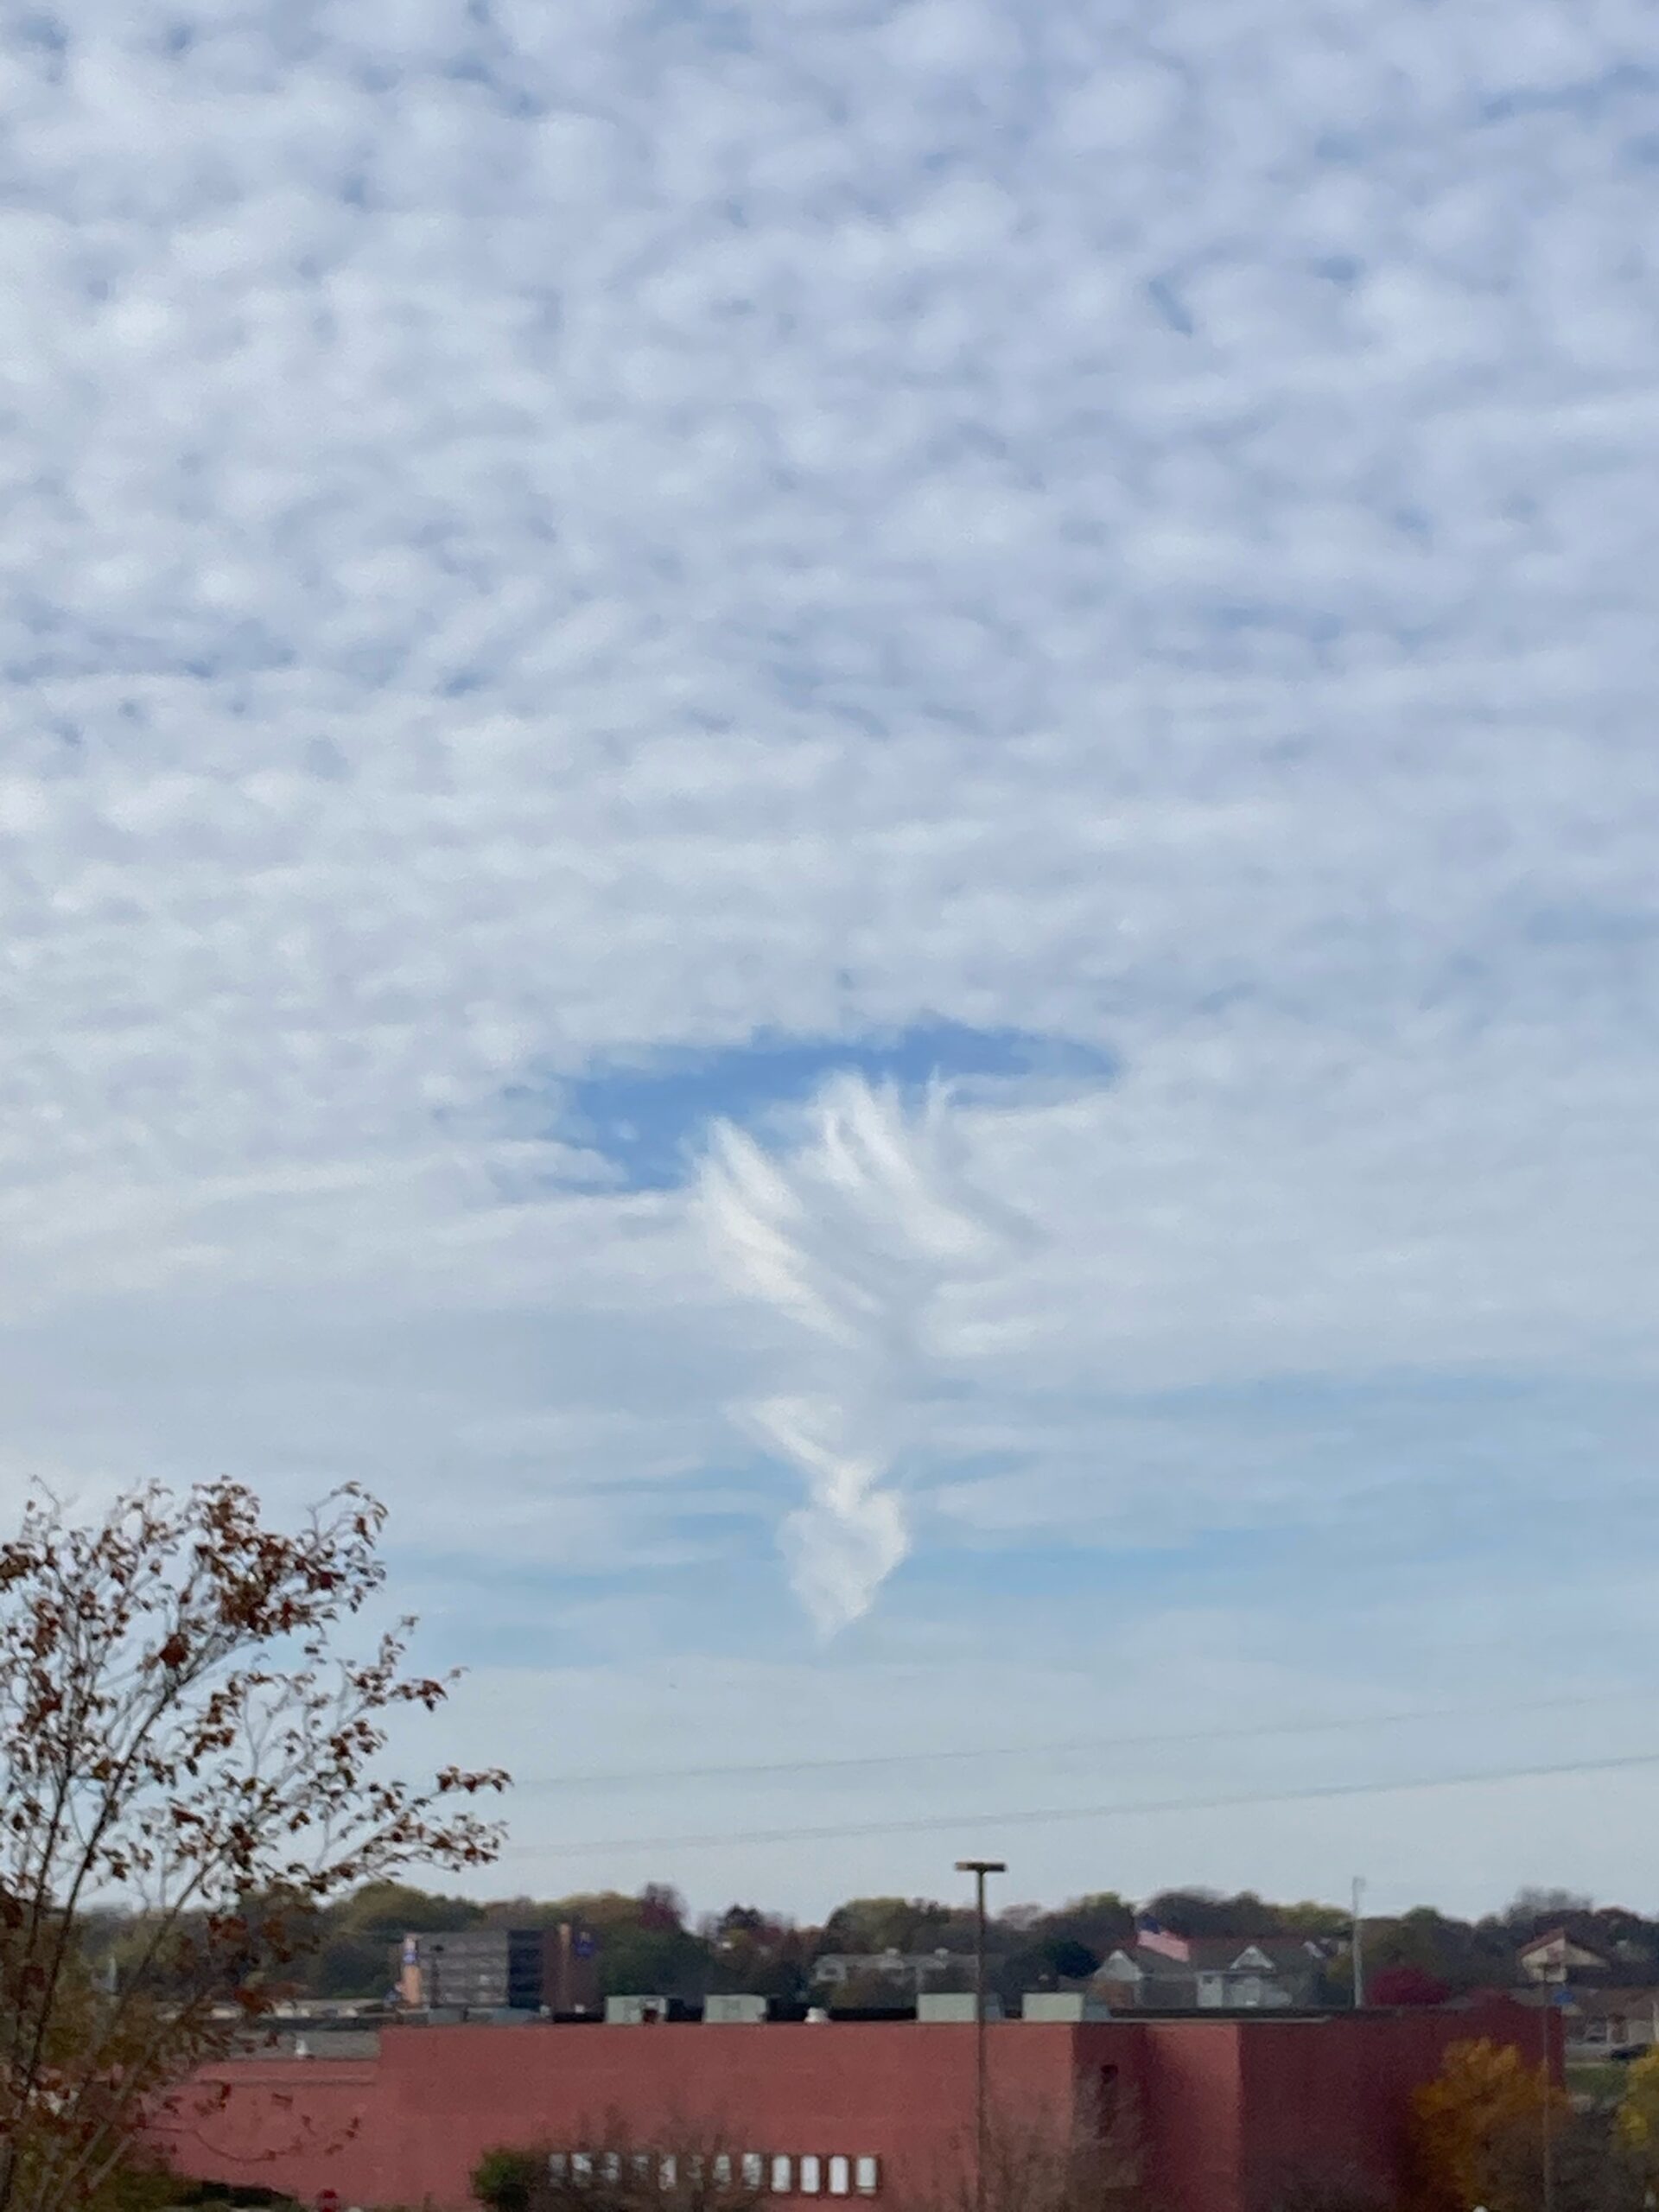
On the morning of Sunday, November 7th, numerous elongated hole punch clouds were visible over the Upper Midwest, including parts of Wisconsin, Illinois, Iowa, and Minnesota. Also called fall streak clouds, these are a relatively rare phenomenon that form because of the unusual properties of cloud droplets.
Photo of a hole punch cloud and the associated fall streaks, taken on the east side of Madison, WI, at 11:20 AM CST on Sunday, November 7th. Photo by the author.
While most people know the freezing temperature of water is 0 °C (32 °F), that’s only true when dealing with a flat surface. A curved droplet has more energy in it due to surface tension squeezing the droplet together, and so the air temperature has to be colder in order to make the droplet cold enough to freeze. As a result, clouds of liquid water below freezing are relatively common, especially in the spring and fall when temperatures at cloud level are just below freezing. These are called supercooled clouds.
Another commonly-known fact about water is if the relative humidity of the air is less than 100%, liquid water will evaporate. Again, that’s not necessarily true for cloud droplets. What is especially interesting is that the relative humidity required to support growth is bigger for a cloud droplet than it is for an ice crystal. Given an environment with both cloud droplets and ice crystals, the droplets will evaporate and the ice crystals will grow. This is known as the Bergeron-Findeisen process and is a key part of forming precipitation from cold clouds.
Both cloud droplets and ice crystals require a nucleus to form. Dust, pollen, and other aerosols are common nuclei. While water can condense on many different aerosols, ice crystals are much more selective. Due to the rigid crystal shape of ice, it can only form on aerosols that have a similar structure. This is, in part, why supercooled clouds are relatively common: there’s just not enough ice nuclei around for ice crystals to form.
That brings us to Sunday morning: a rather large altostratus deck was present across the upper midwest. Even though the surface temperature was approaching 16 °C (60 °F), the clouds were high enough above the surface that their temperature was below freezing. The morning sounding from Davenport, IA, showed that the freezing level was around 3300 m (11,000 ft) above sea level, but airport observations around the region showed that cloud bases were around 5100 m (17,000 ft). Without a sufficient amount of ice nuclei present, they stayed in the liquid phase and were thus supercooled clouds.
1200 UTC (6 AM CST) sounding from Davenport, IA, showing the freezing level was approximately 3300 m (11,000 ft) above sea level. Image from the University of Wyoming sounding archive.
However, numerous aircraft were flying through those clouds as they ascended from or descended into airports across the region. The moisture-rich exhaust from the planes was deposited into the low-pressure wake behind the airplane, where it cooled very quickly and formed ice. Normally, this would form the classic contrails seen behind many aircraft in the sky. However, in this case the contrail served as a nucleation site within the supercooled cloud. The droplets near the ice rapidly evaporated and the ice crystals generated by the airplanes grew even larger. In some cases, the crystals grew so large that they could no longer be supported aloft, and they started falling to the ground as snow. They didn’t reach the ground because the air was warm and dry beneath the cloud, and so the ice crystals either melted and evaporated, or they sublimated (going directly from solid to vapor).
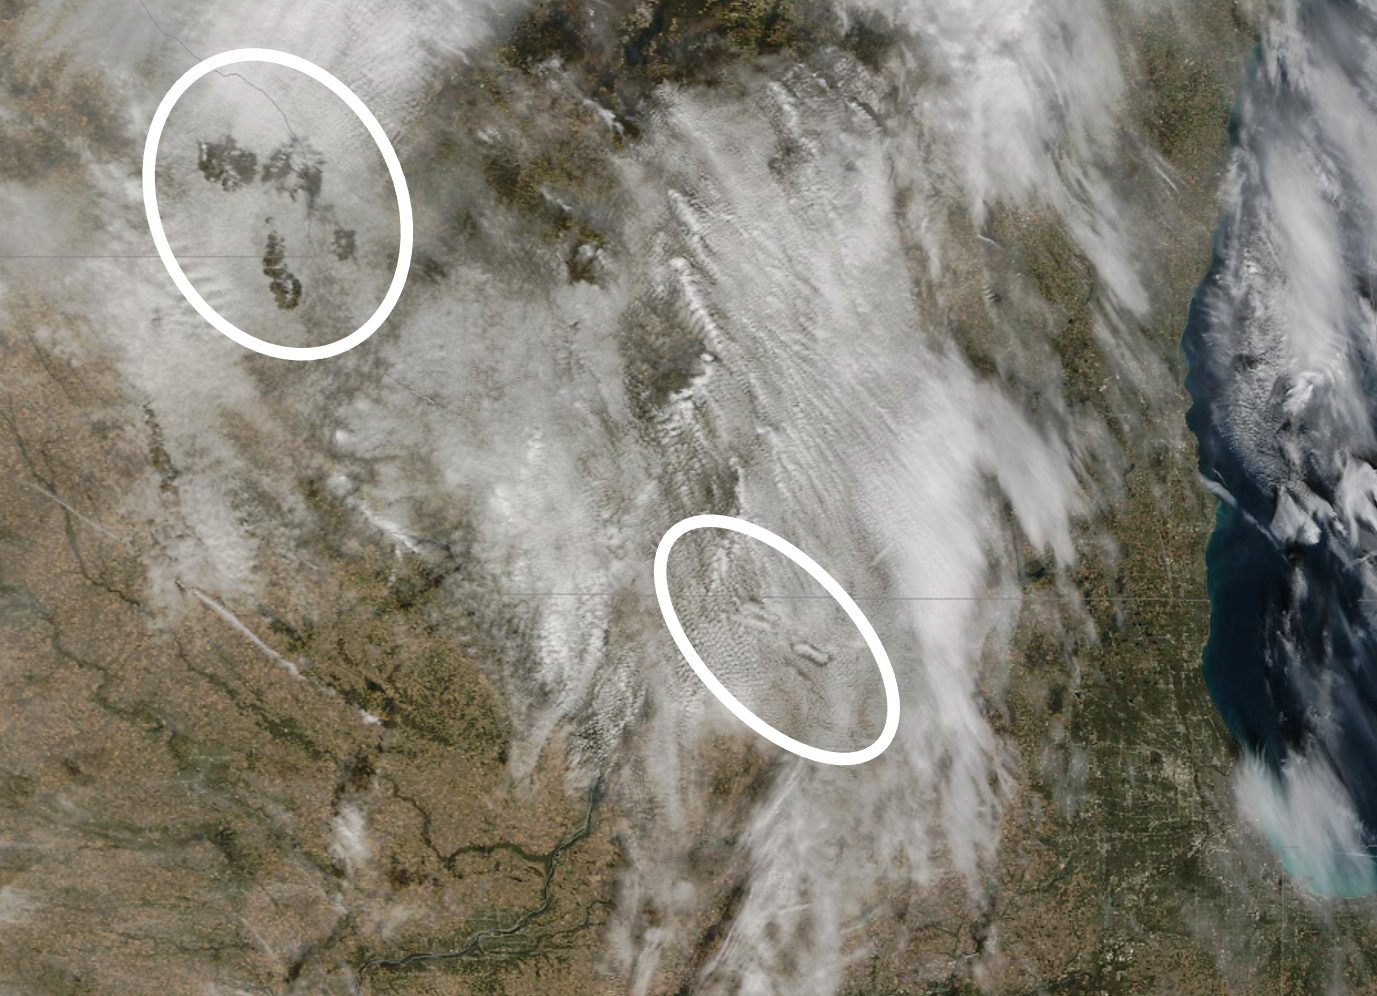
The Terra polar-orbiting satellite happened to be passing overhead at the right time to capture this phenomenon while it was happening around 10:30 AM CST. Almost-clear holes are seen in northeastern Iowa and southeastern Minnesota, while in northern Illinois they appear as elongated ice clouds surrounded by a clear region embedded within a larger cloud.
MODIS True-color image from the 10:30 AM CST overpass showing hole punch clouds, circled in white.
The loop from Band 2 (0.64 micron) from GOES-16 also shows these clouds propagating through the region. This view, over Dane County (Madison) Wisconsin, shows one hour of visible-wavelength satellite imagery. The embedded ice clouds are clearly visible as structures that propagate from the west to the east. While the airplanes that created these structures have long since departed to other locations, their impact remained for some time.
Animation of GOES-16 Band 2 reflectance over south central Wisconsin. Dane County, home of Madison, is outlined.
Other blog posts showing examples of hole punch clouds can be found here.
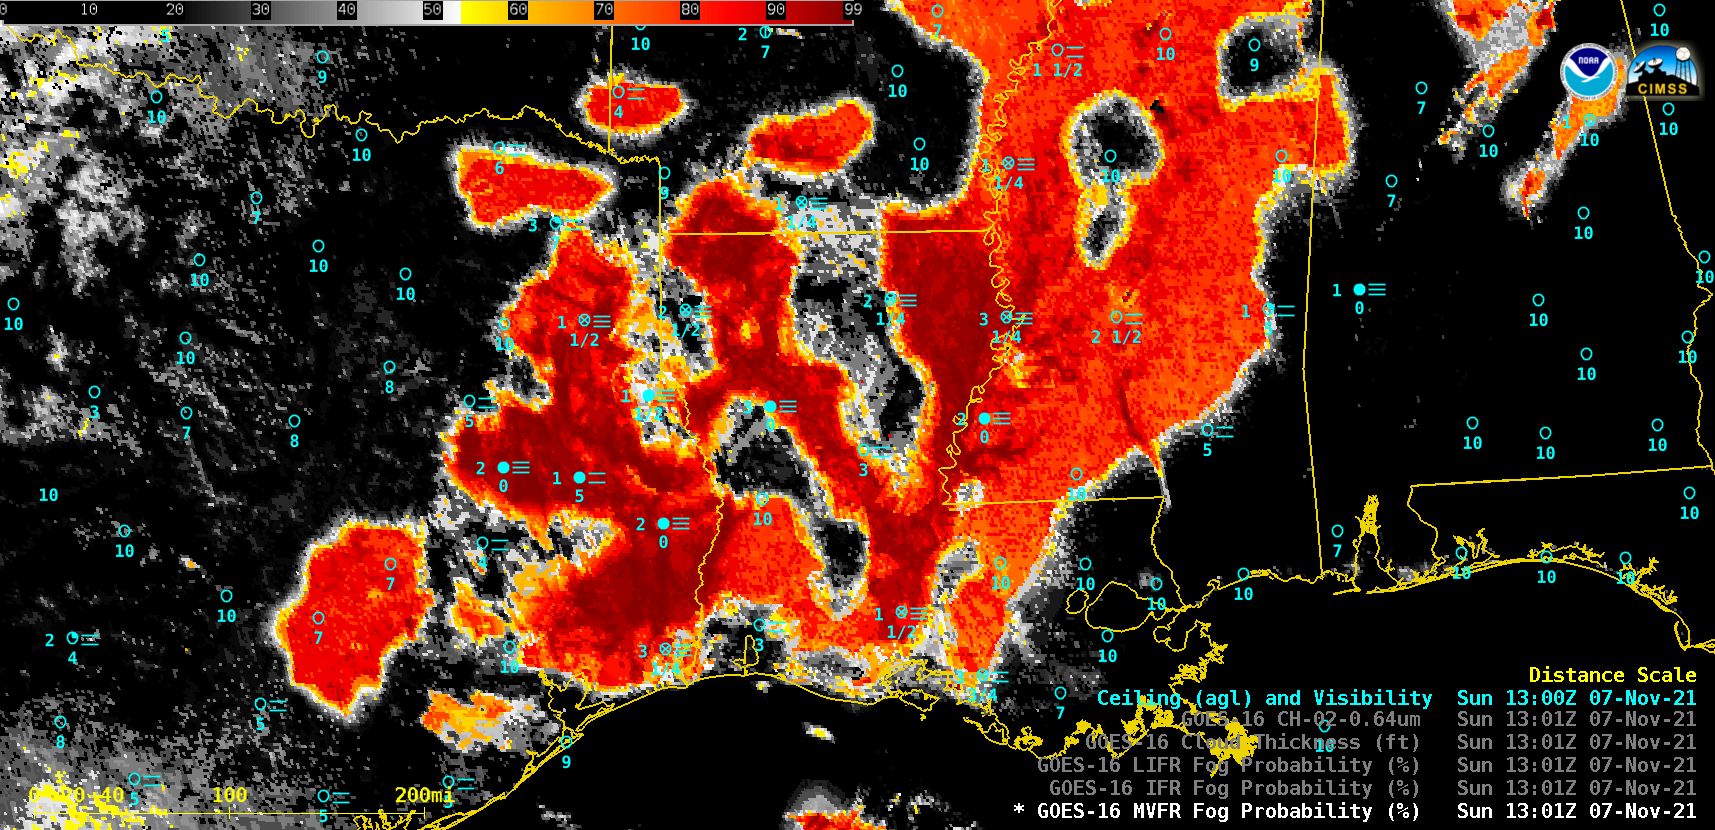
The suite of nighttime GOES-16 (GOES-East) Fog / Low Stratus products — Marginal Visual Flight Rules (MVFR) Probability, Instrument Flight Rules (IFR) Probability, Low Instrument Flight Rules (LIFR) Probability, and Cloud Thickness — along with the subsequent daytime “Red” Visible (0.64 µm) images (above) showed the increasing areal coverage of vertically shallow (Cloud Thickness... Read More
GOES-16 MVFR Probability, IFR Probability, Low IFR Probability, Cloud Thickness products, along with “Red” Visible (0.64 µm) images [click to play animated GIF | MP4]
The suite of nighttime GOES-16 (GOES-East)Fog / Low Stratus products — Marginal Visual Flight Rules (MVFR) Probability, Instrument Flight Rules (IFR) Probability, Low Instrument Flight Rules (LIFR) Probability, and Cloud Thickness — along with the subsequent daytime “Red” Visible (0.64 µm) images (above) showed the increasing areal coverage of vertically shallow (Cloud Thickness values less than 1000 feet) radiation fog across parts of Texas, Louisiana, Arkansas and Mississippi on 07 November 2021. The surface visibility was reduced to zero at a few sites, with cloud ceilings as low as 100 feet being reported. Visible images showed that this shallow fog layer then quickly dissipated within a few hours after sunrise.
This fog was forming due to optimal radiational cooling conditions — light winds, along with a general lack of cloud cover — beneath a ridge of high pressure over that region (below). Surface air temperatures dropped into the 30s and 40s F across much of the area where this fog formed.
GOES-16 IFR Probability product at 0901 and 1201 UTC, with overlays of mean seal level pressure at those times [click to enlarge]
 GOES-17 water vapor weighting functions for Fairbanks, Alaska [click to enlarge]


