This website works best with a newer web browser such as Chrome, Firefox, Safari or Microsoft
Edge. Internet Explorer is not supported by this website.
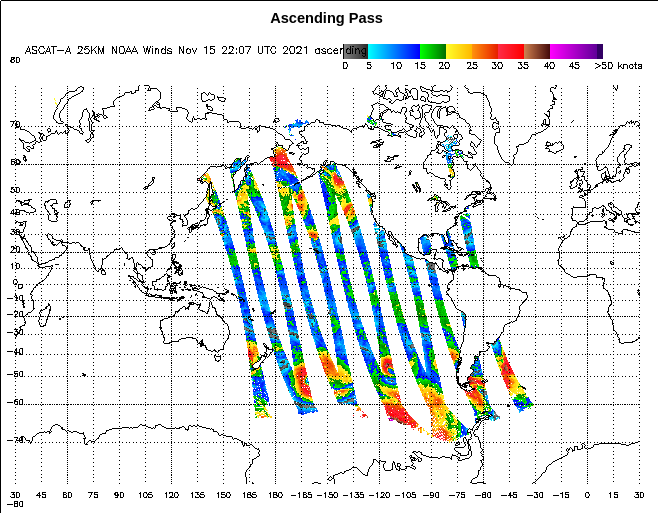
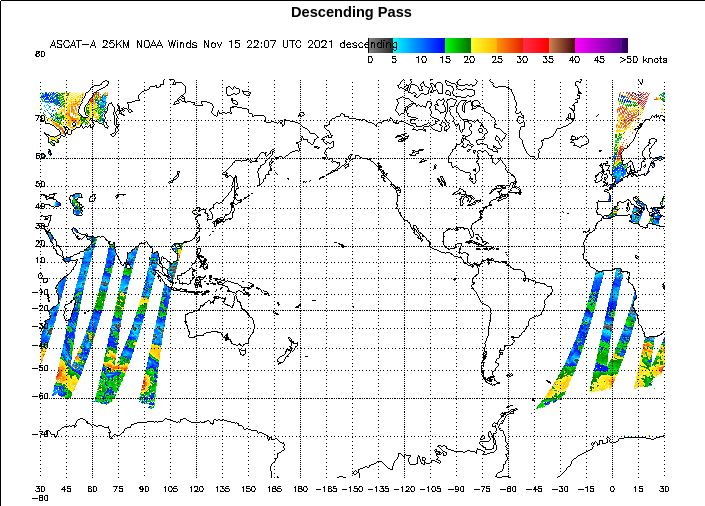
The polar orbiting satellite Metop-A was switched off on 15 November 2021, ending a very long career gathering information (the satellite was launched in 2006). The final ASCAT (ascending) imagery from Metop-A, from this site, is shown above (click here to see the descending data from that day). ASCAT scatterometery from... Read More
ASCAT data from Metop-A, ascending passes, 15 November 2021 (Click to enlarge)
The polar orbiting satellite Metop-A was switched off on 15 November 2021, ending a very long career gathering information (the satellite was launched in 2006). The final ASCAT (ascending) imagery from Metop-A, from this site, is shown above (click here to see the descending data from that day). ASCAT scatterometery from satellites operated by EUMETSAT will now be limited to Metop-B and Metop-C (Click here for more information on Metop-A in the near future; click here for information on Metop satellites). ASCAT data is obviously important for defining wind features over the open ocean, where conventional data is sparse.
The loss of Metop-A ASCAT data means a 50% reduction in the scatterometery data assimilated into US Numerical models. Only Metop-B ASCAT data are now assimilated; work continues on incorporating Metop-C ASCAT data into assimilation schemes.
Metop-A also carried AVHRR, IASI, HIRS, AMSU and MHS instruments. Metop-C is Metop-A’s replacement.
*Metop-A does continue to supply some (non-ASCAT) information to NESDIS (my thanks to Liam Gumley, SSEC, for this information!) as shown at this website. Not all instruments have (as yet) been switched off.
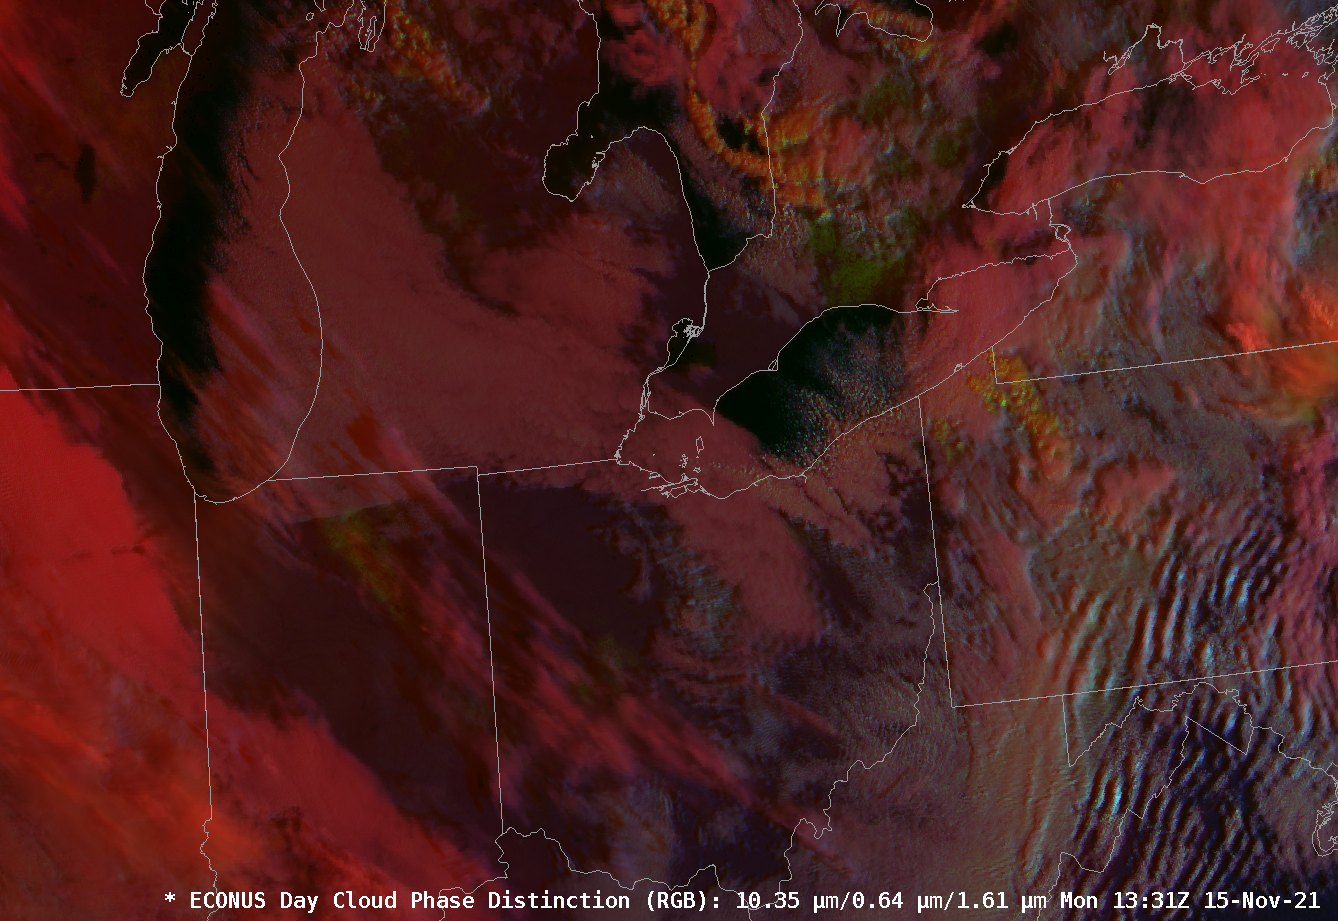
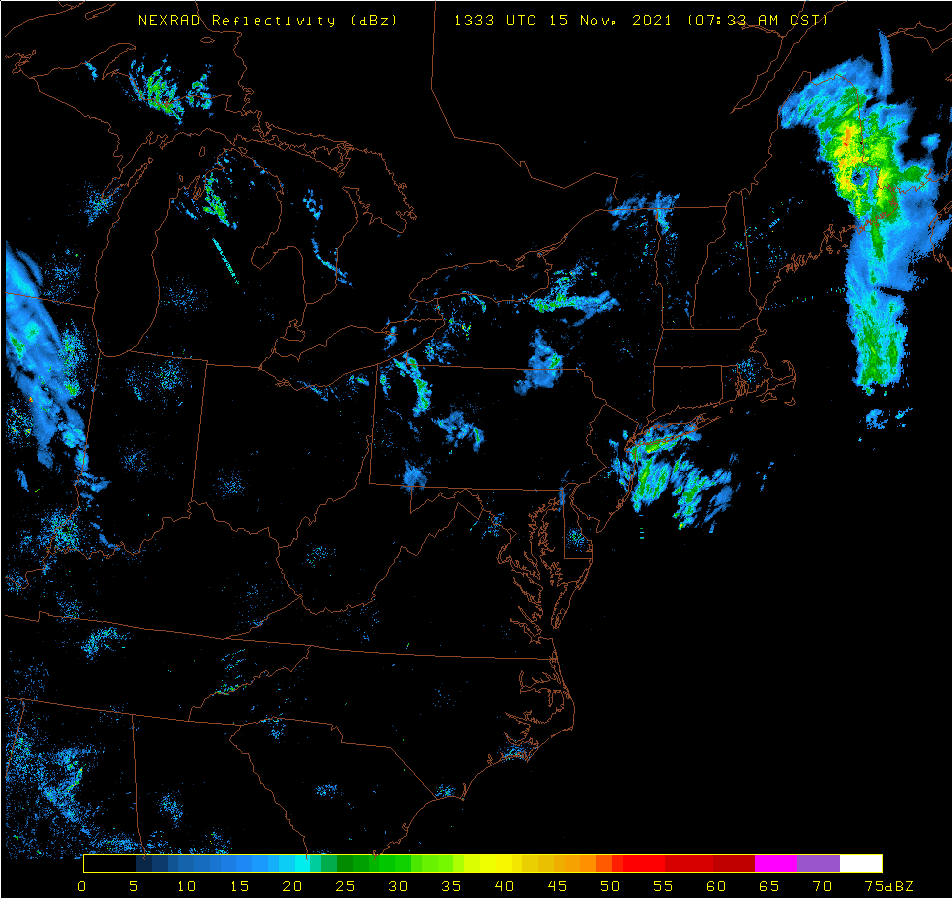
GOES-16 Day Cloud Phase Distinction (see text for details) at 1331 UTC and NEXRAD Reflectivity at 1333 UTC, both on 15 November 2021 (Click to enlarge)
The toggle above shows NEXRAD radar (source) inset during lake-effect precipitation with two versions of the GOES-16 Day Cloud Phase Distinction RGB, one with default values, and one with ‘Green’ (ABI Band 2 Visible imagery at 0.64 ?m) and ‘Blue’ (ABI Band 5 at 1.61 ?m) reduced from default values, from 79% to 60% for Band 2, and from 59% to 50% for Band 5 (by using the composite option feature in AWIPS). It can be advantageous to alter the bounds on some RGBs during periods of low light (i.e., sunrise and sunset) to accentuate features. However, make certain at some point to reload with the default value! As the sun rises higher into the sky, features will start to look unfamiliar if the modified RGB menu remains.
The radar/satellite comparison bears comment. First, note that the location of circled features is not quite the same, due to parallax (discussed here and here): The effect of parallax is that clouds are shifted away from the sub-satellite point in AWIPS. The effect is most pronounced for towering summertime thunderstorms, but even clouds producing lake-effect snow, clouds that are far more shallow, will be shifted.
The Day Cloud Phase Distinction RGB will show clouds with more of a yellow tint when those clouds glaciate, as might be expected in more intense lake-effect snow-producing clouds. As clouds glaciate, the ‘blue’ part of this particular RGB is reduced: ice crystals within the cloud absorb (rather than reflect) solar energy at 1.61 ?m. In the toggle above, clouds with a modest yellow enhancement in the RGB align well in three circled regions where radar suggests vigorous precipitation might be falling. This is a seasonal reminder, then, to use the Day Cloud Phase Distinction to highlight regions — during the day — where lake-effect might be most impactful.
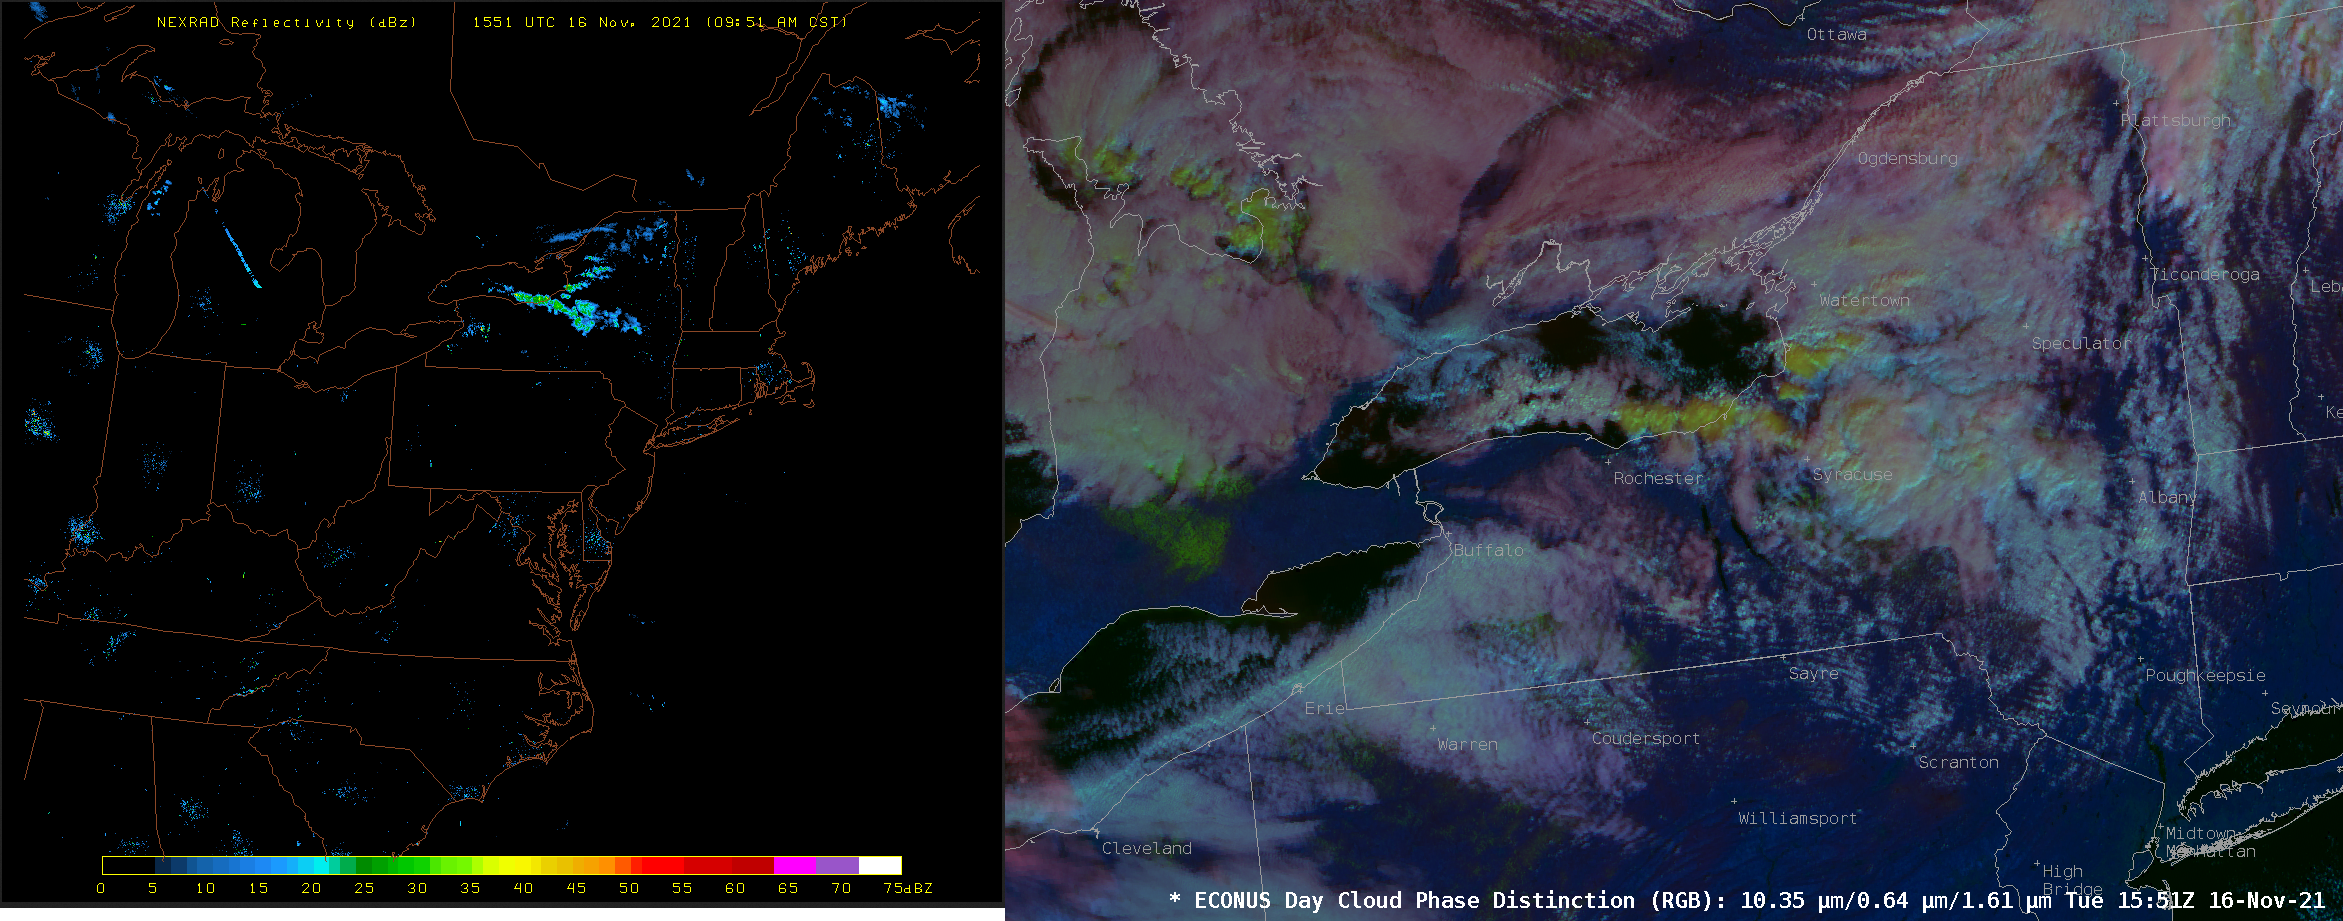
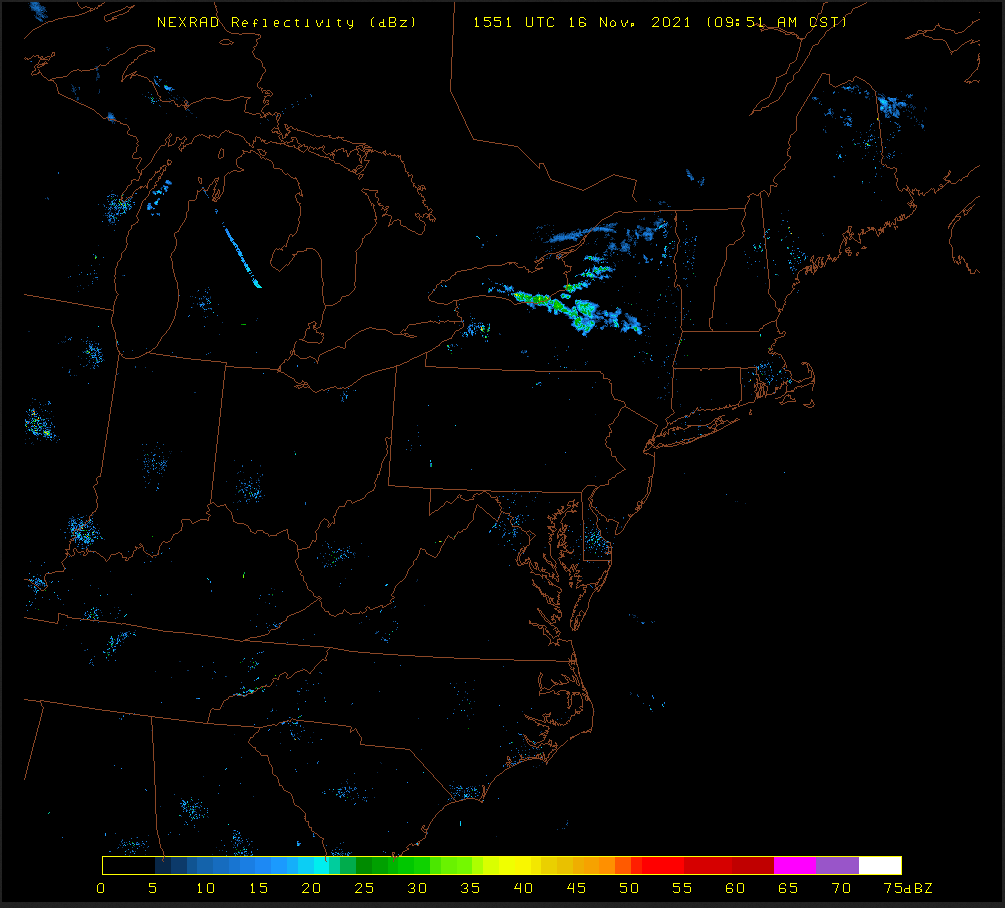
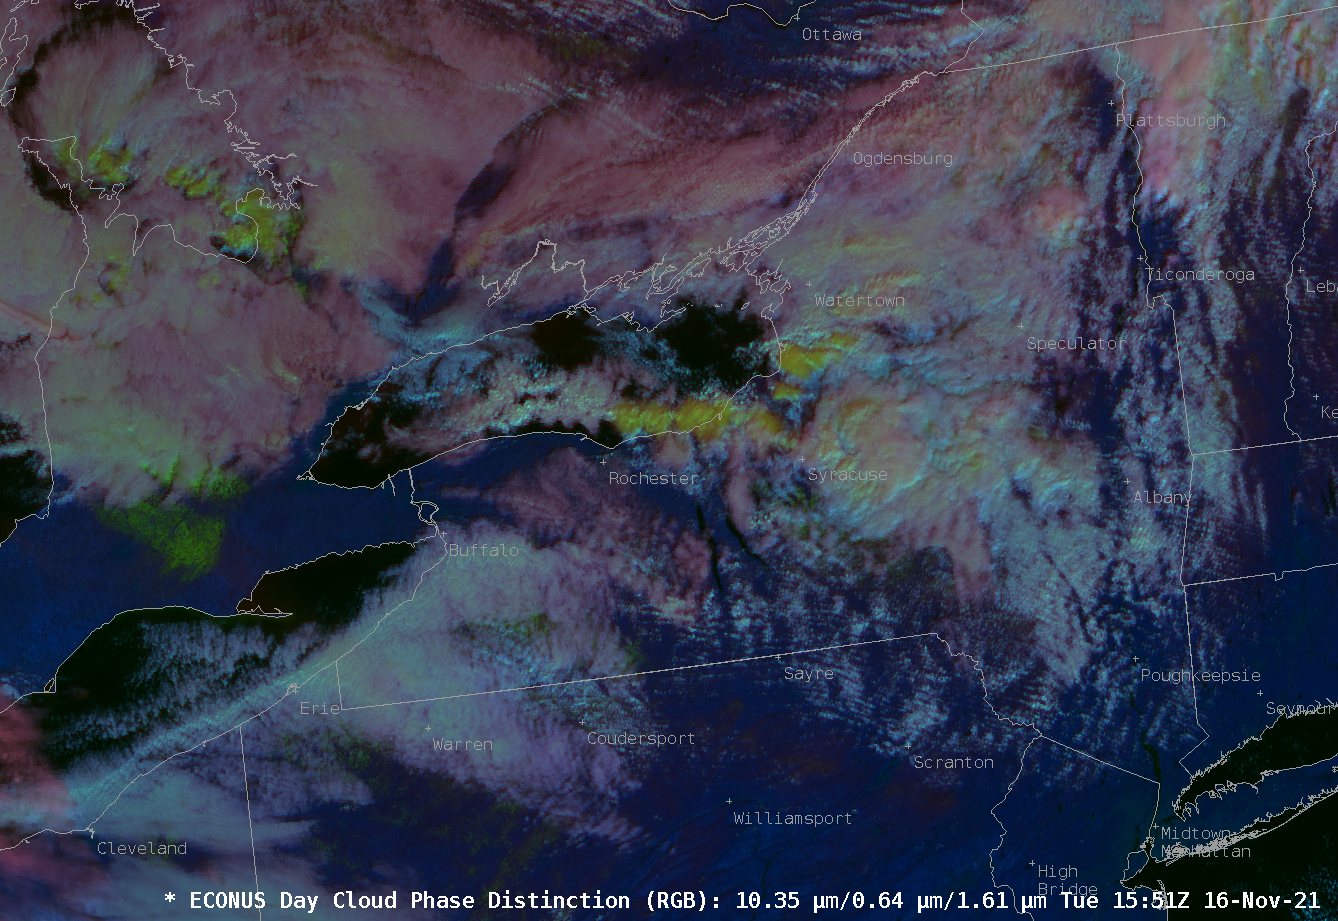
NEXRAD Reflectivity (left) and GOES-16 Day Cloud Phase Distinction RGB (right), 1551 UTC on 16 November 2021 (Click to enlarge)
A similar example is shown above from 16 November. NEXRAD Radar (on the right) shows a single band with strongest returns stretching east-southeastward from just north of Rochester. Note the distinct color change to the cloud band in the RGB that overlays the strongest radar returns. Similar colors in the RGB are also present east of eastern Lake Ontario, where radar returns are also present.
1-minute Mesoscale Domain Sector GOES-16 (GOES-East) “Red” Visible (0.64 µm) images (above) include time-matched plots of SPC Storm Reports — and showed severe thunderstorms moving eastward across parts of New Jersey, New York, Connecticut, Rhode Island and Massachusetts on 13 November 2021. These storms developed along and just ahead of a cold front (surface analyses), the position of which was highlighted by an “arc cloud”... Read More
GOES-16 “Red” Visible (0.64 µm) images, with SPC Storm Reports plotted in red [click to play animated GIF | MP4]
1-minute Mesoscale Domain Sector GOES-16 (GOES-East) “Red” Visible (0.64 µm) images (above)include time-matched plots of SPC Storm Reports — and showed severe thunderstorms moving eastward across parts of New Jersey, New York, Connecticut, Rhode Island and Massachusetts on 13 November 2021. These storms developed along and just ahead of a cold front (surface analyses), the position of which was highlighted by an “arc cloud” extending southward across the Atlantic Ocean.
The corresponding 1-minute GOES-16 “Clean” Infrared Window (10.35 µm) images (below) extended past sunset into the early evening hours; the low-topped convection only displayed coldest cloud-top infrared brightness temperatures in the -40 to -50ºC range (green to yellow enhancement).
GOES-16 “Clean” Infrared Window (10.35 µm) images, with SPC Storm Reports plotted in red [click to play animated GIF | MP4]
GOES-16 (GOES-East) “Clean” Infrared Window (10.35 µm) and “Red” Visible (0.64 µm) images (above) showed a line of deep convection which moved northwestward across the Brazil / Bolivia border during 11-12 November 2021 — and in its wake, the circulation of a remnant Mesoscale Convective Vortex (MCV) was seen moving south-southeastward across Brazil, back toward the... Read More
GOES-16 “Clean” Infrared Window (10.35 µm) and “Red” Visible (0.64 µm) images [click to play animated GIF | MP4]
GOES-16 (GOES-East) “Clean” Infrared Window (10.35 µm) and “Red” Visible (0.64 µm) images (above) showed a line of deep convection which moved northwestward across the Brazil / Bolivia border during 11-12 November 2021 — and in its wake, the circulation of a remnant Mesoscale Convective Vortex (MCV) was seen moving south-southeastward across Brazil, back toward the Boliva border.
GOES-16 Visible images combined with the clear-sky Total Precipitable Water product (below) revealed TPW values in the 2.2 to 2.5 inch range in the vicinity of the MCV. This environment of high moisture likely aided the development of new convection as the MCV approached. Nearby 12 UTC soundings from Porto Velho (SBPV) and Vilhena (SBVH) showed minimal instability across far southwestern Brazil, but the sounding TPW values (2.0 to 2.3 inches) were in good agreement with the TPW values derived from GOES-16.
GOES-16 “Red” Visible (0.64 µm) images, combined with the clear-sky Total Precipitable Water product [click to play animated GIF | MP4]
GOES-16 Visible images at 1200 UTC and 1800 UTC with plots of GFS wind barbs at 850 hPa and 500 hPa (below) indicated that the MCV was moving through an environment of relatively low wind shear — this helped the MCV to maintain its circulation for the remainder of the daytime hours on 12 November.
GOES-16 “Red” Visible (0.64 µm) images at 1200 UTC and 1800 UTC, with plots of GFS wind barbs at 850 hPa and 500 hPa [click to enlarge]


