
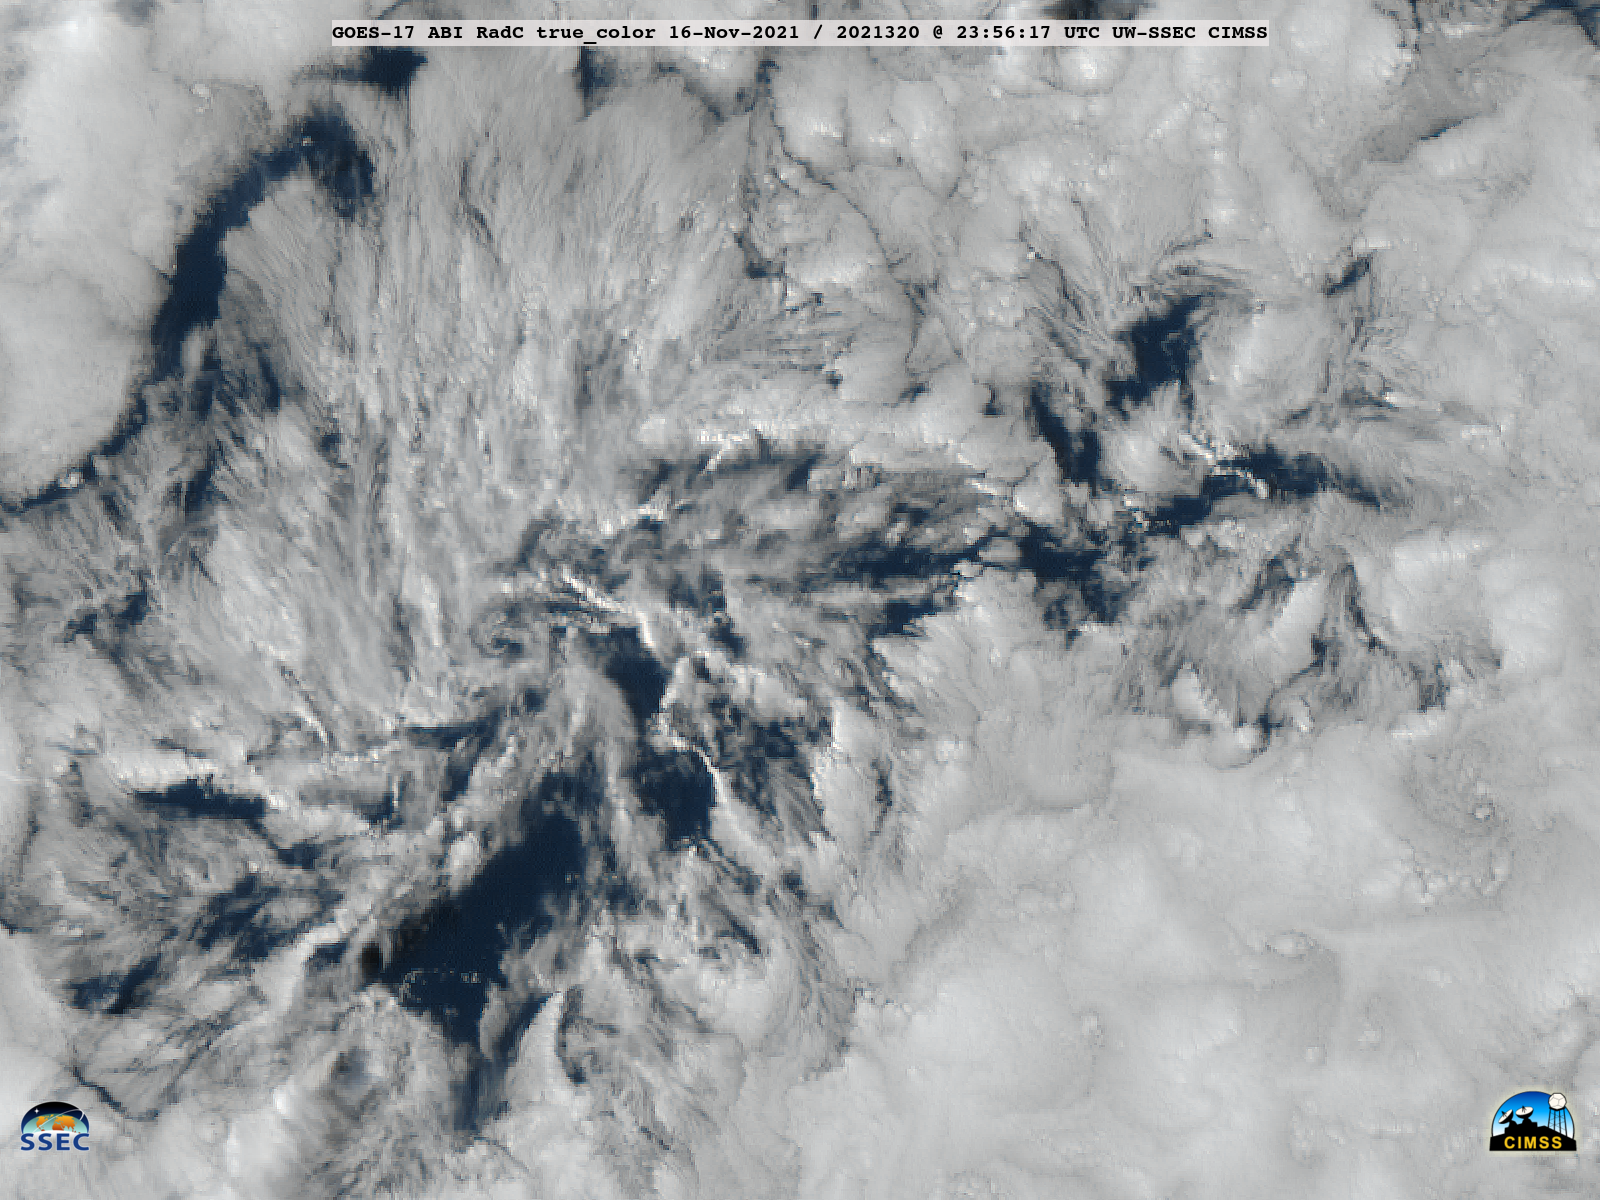
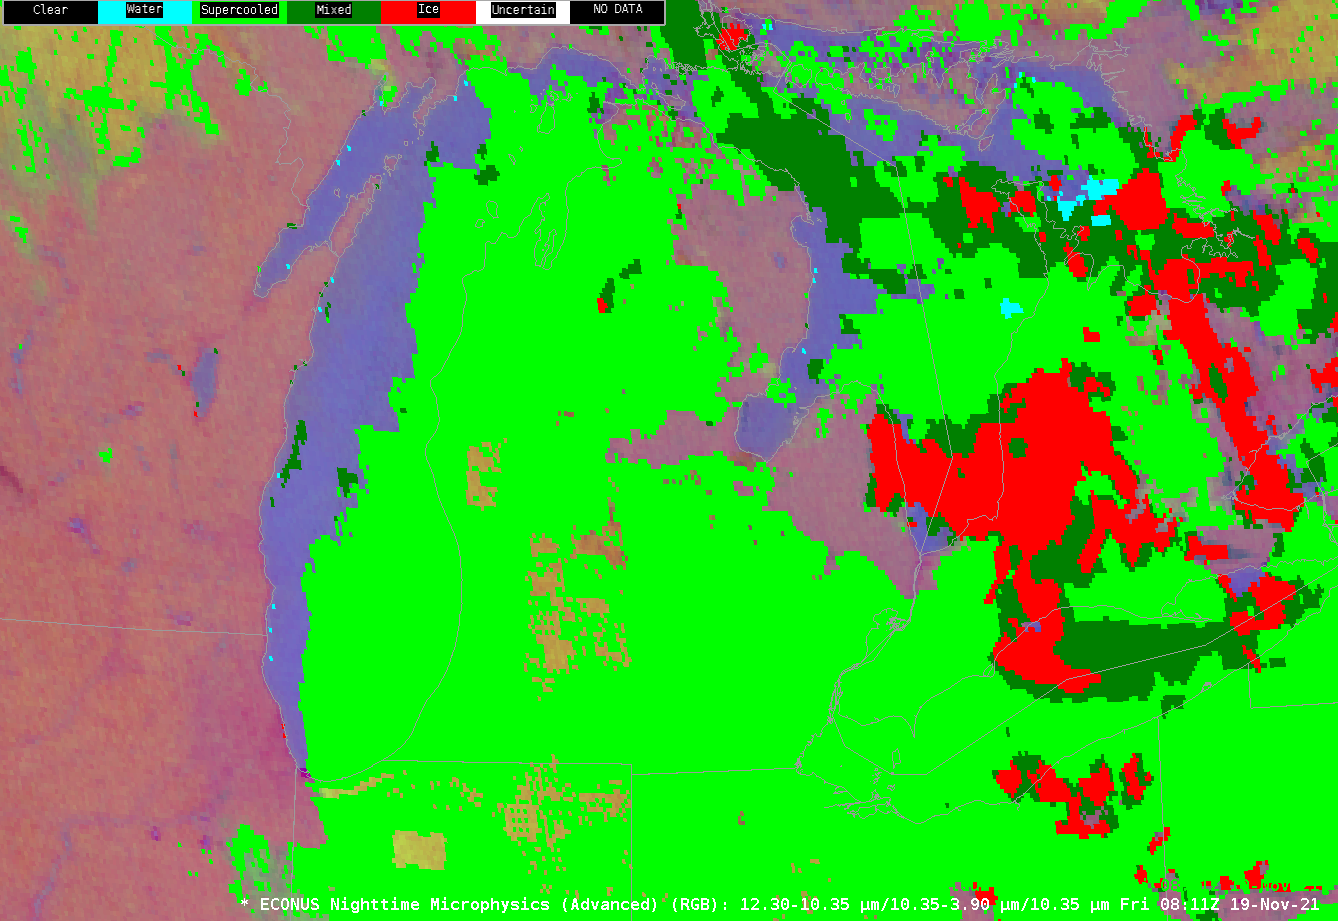
Cold temperatures over the Great Lakes (the Green Bay 850-mb sounding temperatures, for example, were -11.9º C at 0000 UTC and -8.1º C at 1200 UTC) on 18-19 November 2021 generated extensive cloud cover and occasional snow showers. The nighttime microphysics RGB, above, showed extensive stratiform clouds downwind of Lake Michigan. The GOES-16 Cloud Top Phase product at this time (here) uniformly showed water droplets over lower Michigan.
Skies over eastern Lake Michigan were clear enough at 0811 UTC to allow some lake-surface temperature computations using NOAA-20 VIIRS channels and the ACSPO algorithm. Diagnosed lake-surface temperatures are in the low 50s (º Fahrenheit; the colorbar range is 40º to 55º F).
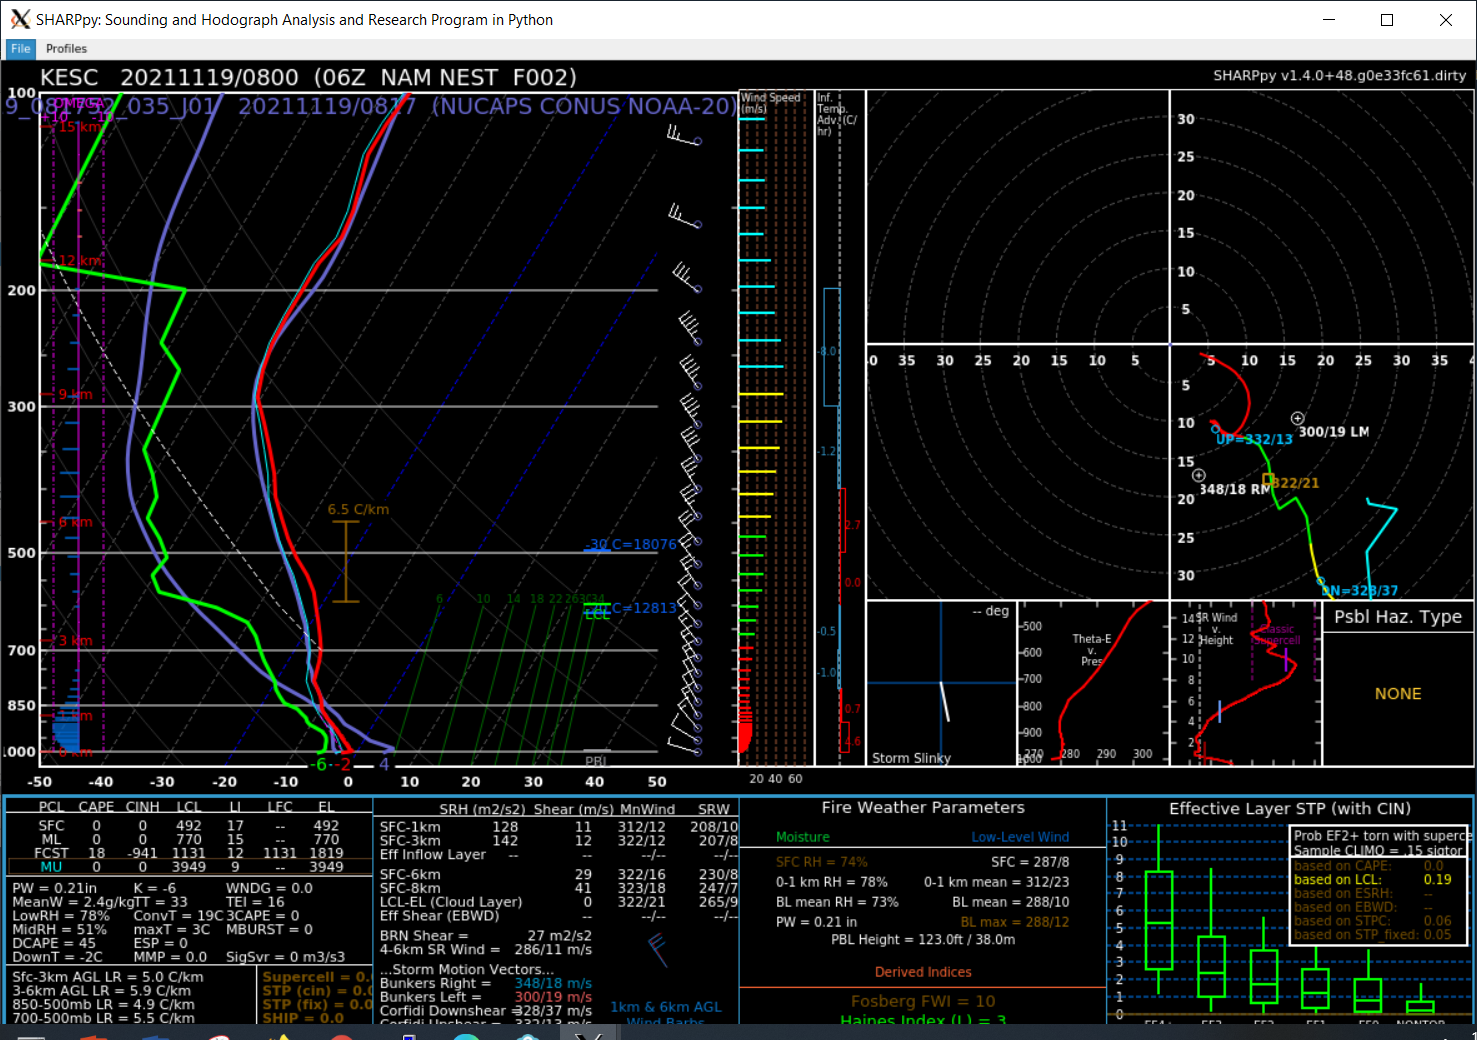
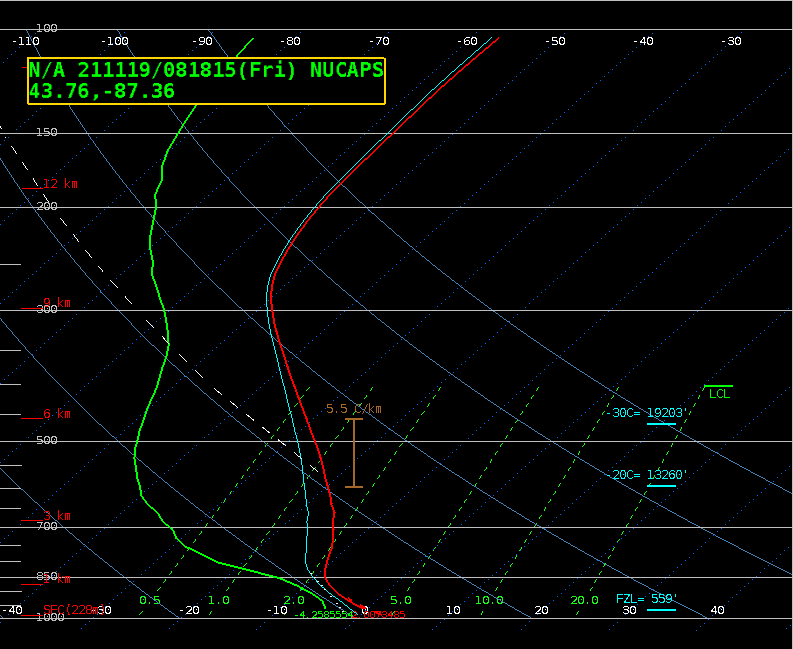
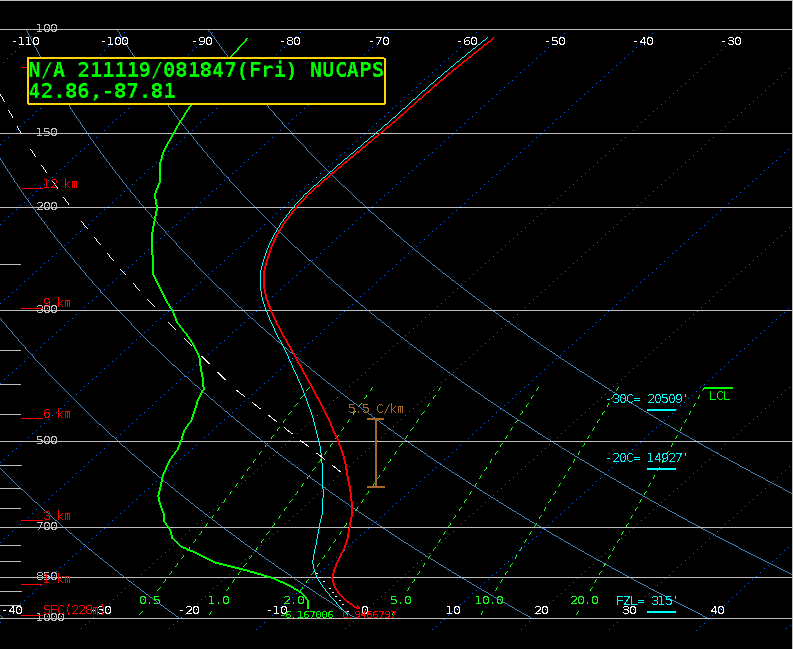
NUCAPS Sounding Availability points are also shown in the image above, and three points near/over western Lake Michigan — near Escanaba MI, east of Sheboygan WI, and near Racine, WI — are shown below.

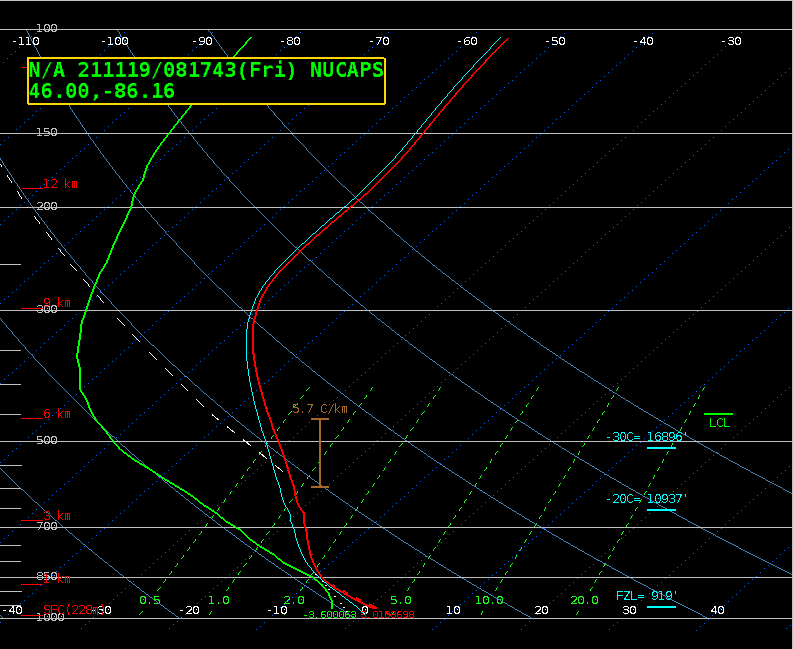
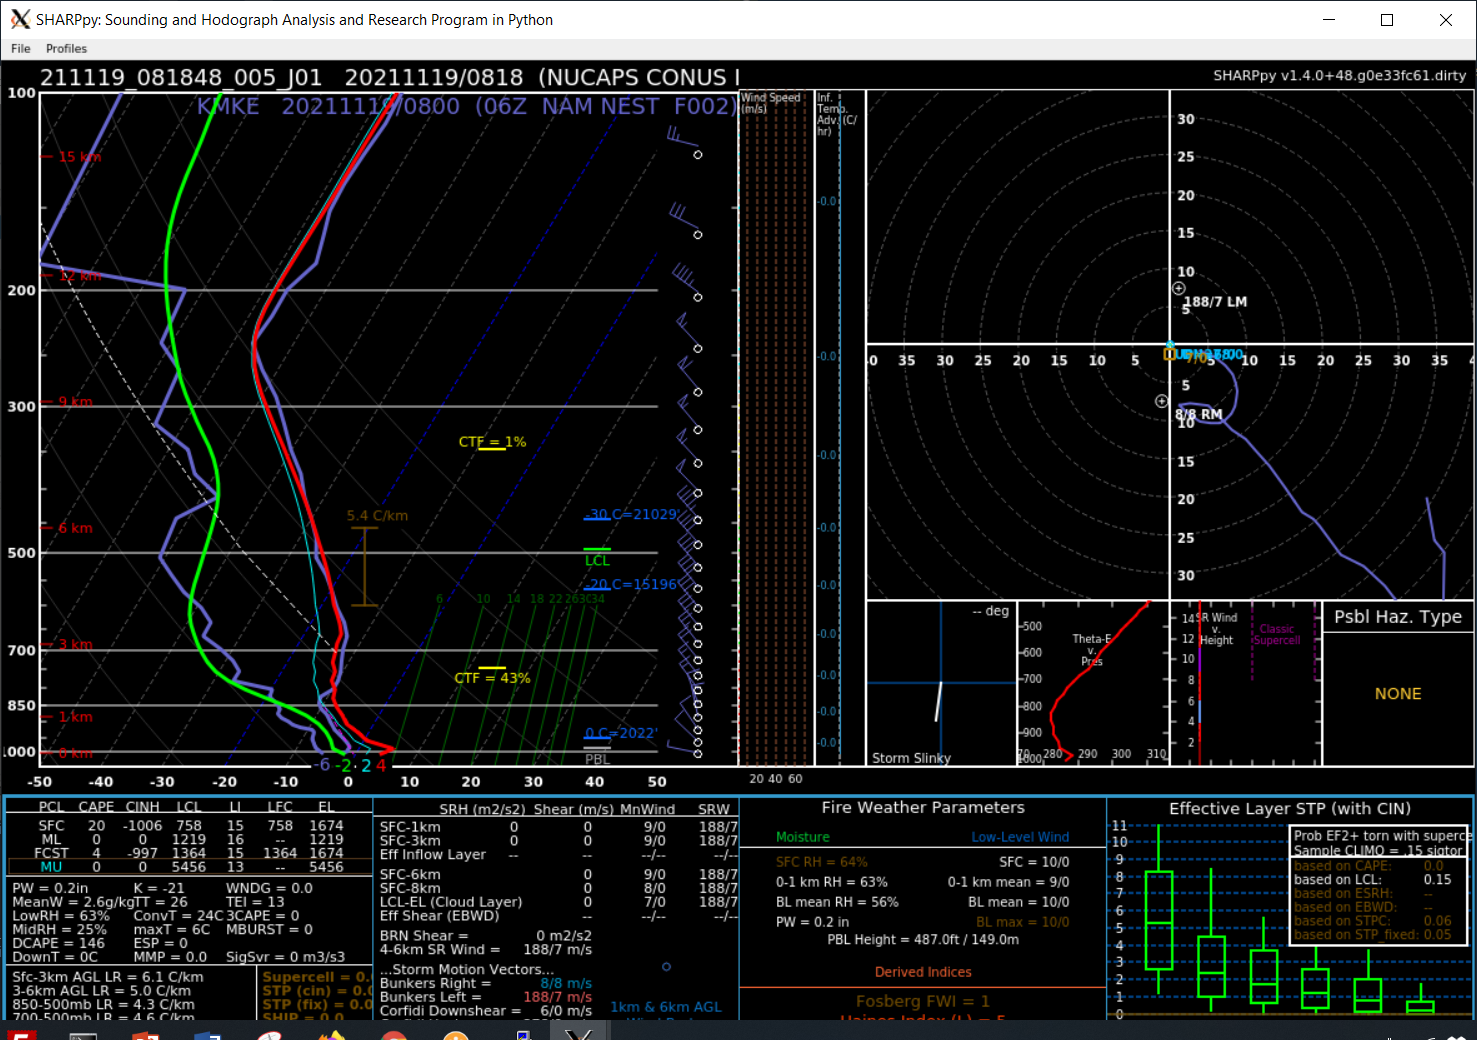
NUCAPS profiles on this day over western Lake Michigan were uniformly warmer than 2-hour forecast NAM Nest profiles from the 0600 UTC model run. The image below compares (via Sharppy, using the NUCAPS in the Cloud methodology outlined here) model (red and green lines) and NUCAPS (purple lines) near Escanaba. NUCAPS shows warmer low-level temperatures (and also cooler mid/upper-tropospheric temperatures). Comparisons for the NUCAPS point east of Sheboygan and NAM Nest values at Sheboygan, and the NUCAPS point near Racine and the NAM Nest values at Milwaukee (note that for those two linked plots, the colors are flipped: NUCAPS Temperature and Dewpoint are red and green, respectively, and NAM Nest values are purple) are similar: NUCAPS values in the lowest part of the atmosphere are warmer than the NAM Nest. How might that affect the downwind production of lake-effect clouds and precipitation?
NUCAPS profiles give a model-independent estimate of temperature and dewpoint in the atmosphere. They are available about halfway (in time) between routine upper-air soundings in the lower 48 states of the USA. ‘NUCAPS Sounding Availability’ can be found under the ‘Satellite > S-NPP and NOAA-20’ menu.
View only this post Read Less


