A benefit of Polar Orbiters over northernmost Alaska is a wealth of NUCAPS soundings from NOAA-20! The animation above shows useful profiles near Utqiagvik AK (formerly Barrow) for the nine hours between 1132 and 2128 UTC on 5 December 2021. The vibrant green point is the point selected for the profiles shown below. Note that the profiles at 1633, 1810 and 1948 UTC were microwave-only; that is, the infrared retrieval did not converge (click here to see the distribution from 1633-1948 UTC; you’ll see yellow points in the region near Utqia?vik). The sounding availability suggests near-continuous (at 90-minute timesteps!) monitoring of the tropopshere during the day.
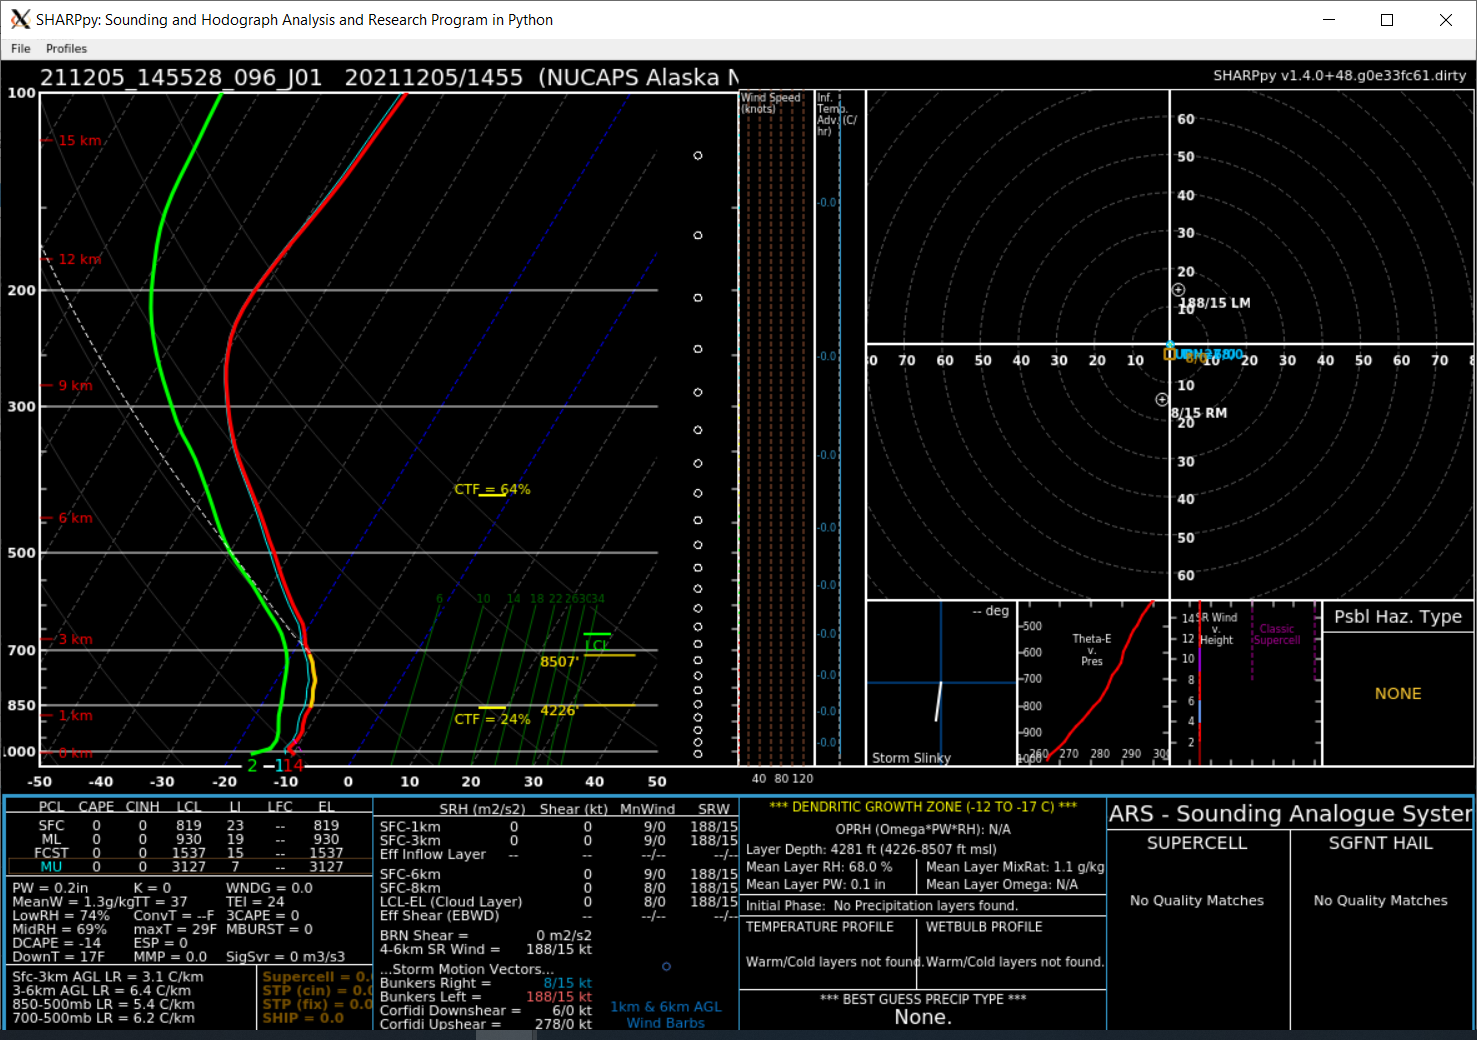
The animation below shows 4 profiles (for which the infrared solution converged in the retrieval); A consistent warming in the profiles is noted, and perhaps a slight drying as well. The tropopause is also shown to rise. These profiles are not reliant on numerical model data; they are an independent measure of the polar atmosphere. It’s important to view similar dot colors in this kind of animation. The animation at the bottom of the post includes in the animation the microwave-only profiles at 1635, 1914 and 1953 UTC. The IR+MW profiles below have far different character than MW-only profiles at bottom; however, the MW-only profiles also show a slow warming.

These NUCAPS profiles were displayed using a method that is detailed here, developed by scientists at STC and SPoRT. NWS forecasters who are interested in this functionality can contact the blog author.
Note that the high temperatures in Utqiagvik (Barrow) on 3, 4 and 5 December were 0º, 19º, and 25º F, respectively, entirely consistent with the warm advection depicted in the NUCAPS profiles.
View only this post Read Less


