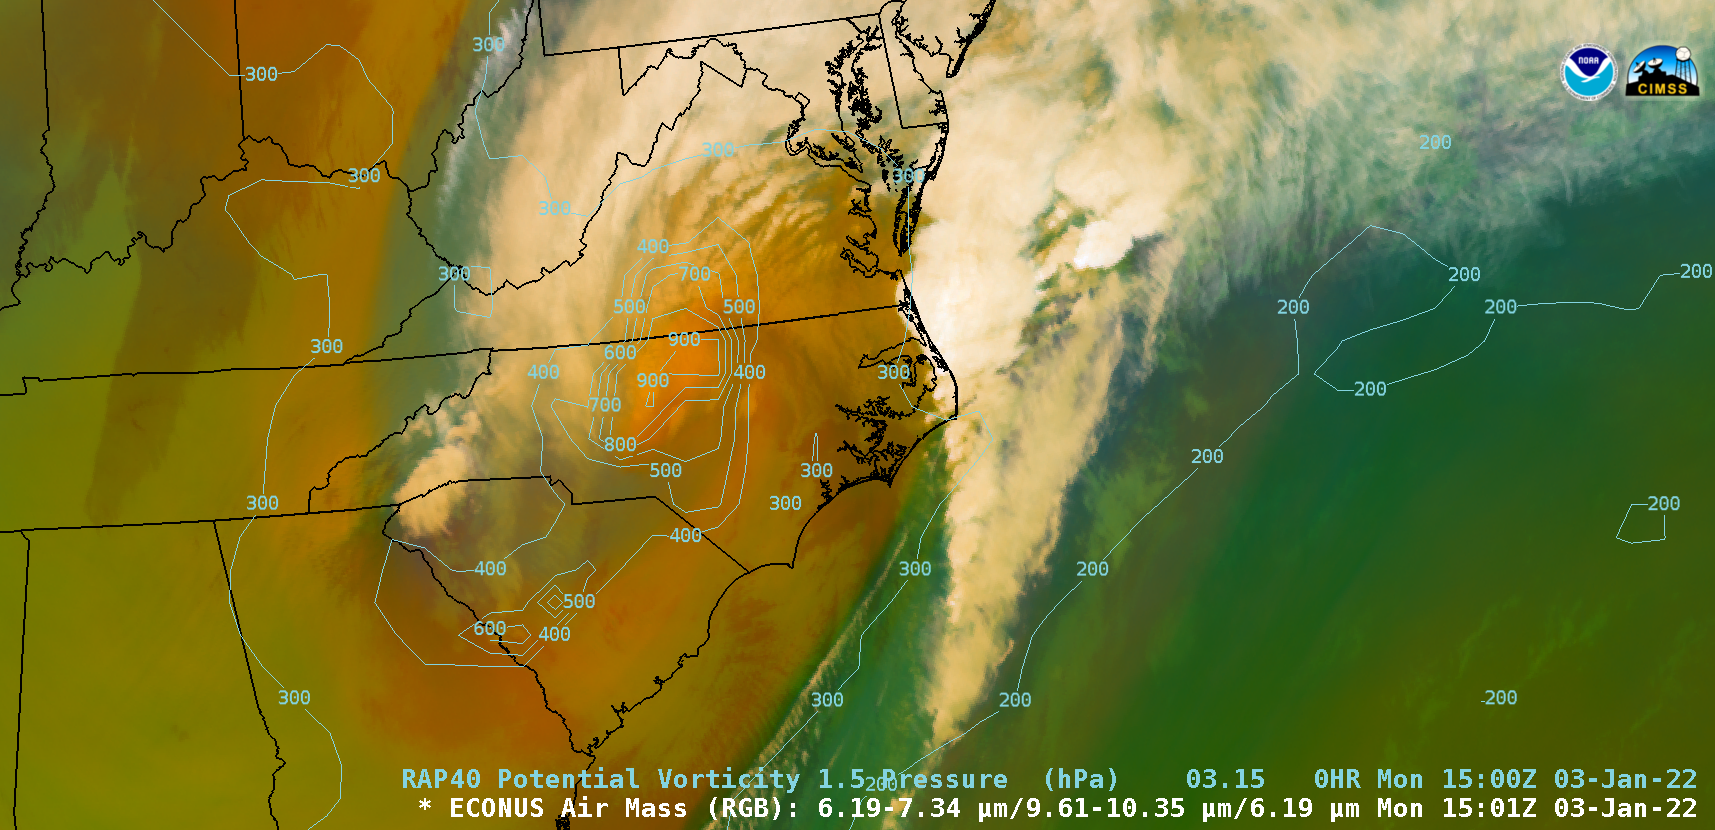

GOES-16 Air Mass RGB images, with and without contours of RAP40 model PV1.5 pressure [click to play animated GIF | MP4]
GOES-16 (GOES-East) Air Mass RGB images (above) showed the signature of a Potential Vorticity (PV) Anomaly — denoted by shades of red to pink within the comma head portion of the storm — which likely aided in enhancing precipitation rates within a midlatitde cyclone (surface analyses) as it moved across the region on 03 January 2022. RAP40 model contours of PV1.5 pressure indicated that the “dynamic tropopause” descended as low as the 900 hPa pressure level.
GOES-16 “Red” Visible (0.64 µm) images with plots of hourly surface weather type (below) showed the distribution of precipitation from 1400-2120 UTC (9:00 am – 4:20 pm EDT). Overlapping 1-minute Mesoscale Domain Sectors provided imagery at 30-second intervals during this time period. Note the development of convective banding where heavier precipitation was being reported — this storm was responsible for producing flooding rainfall and significant snowfall.

GOES-16 “Red” Visible (0.64 µm) images, with hourly surface weather type plotted in yellow [click to play animated GIF | MP4]
===== 04 January Update =====

GOES-16 “Red” Visible (0.64 µm) and Day Snow-Fog RGB images [click to play animated GIF | MP4]
On the following day, GOES-16 Visible and Day Snow-Fog RGB images (above) displayed the areal coverage of resulting swath of snow cover (shades of red in the RGB imagery), which stretched from northern Alabama and Georgia to southern New Jersey. A few patches of low stratiform clouds (shades of white in the RGB images) persisted in parts of the southern Appalachians during the day.
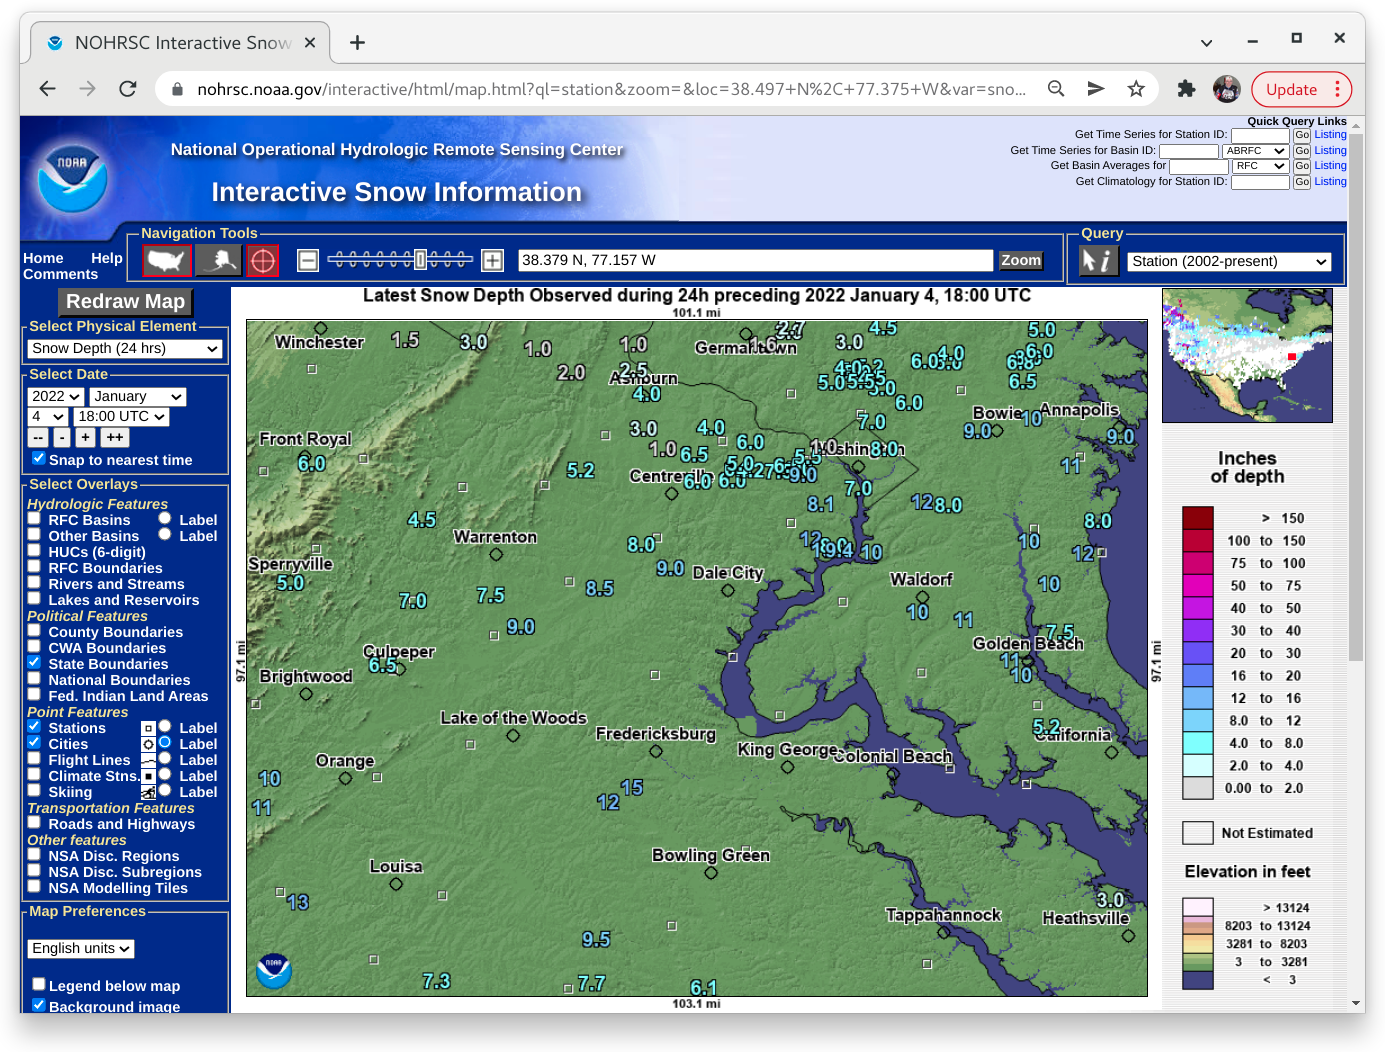
A closer look at GOES-16 Visible and Day Snow-Fog RGB images (below) is centered on Virginia — and showed the portion of Interstate 95 in northern Virginia (between Fredricksburg KEZR and Washington KDCA) where hundreds of vehicles became stranded for as long as 24 hours. Snow depths were generally in the 8-12 inch range across that area.

GOES-16 “Red” Visible (0.64 µm) and Day Snow-Fog RGB images [click to play animated GIF | MP4]
View only this post Read Less


