GOES-16 (GOES-East) “Red” Visible (0.64 µm), Shortwave Infrared (3.9 µm), Fire Power and Fire Temperature derived products (above) showed the dark black smoke plume and thermal signature of a fire from an explosion at the Lubrizon Corporation Chemtool facility at Rockton in far northern Illinois on 14 June 2021. The thick smoke plume obscured... Read More
![GOES-16 "Red Visible (0.64 µm, top left), Shortwave Infrared (3.9 µm, top right), Fire Power (bottom left) and Fire Temperature (bottom right) [click to play animation | MP4]](https://cimss.ssec.wisc.edu/satellite-blog/images/2021/06/il_fire_4p-20210614_133616.png)
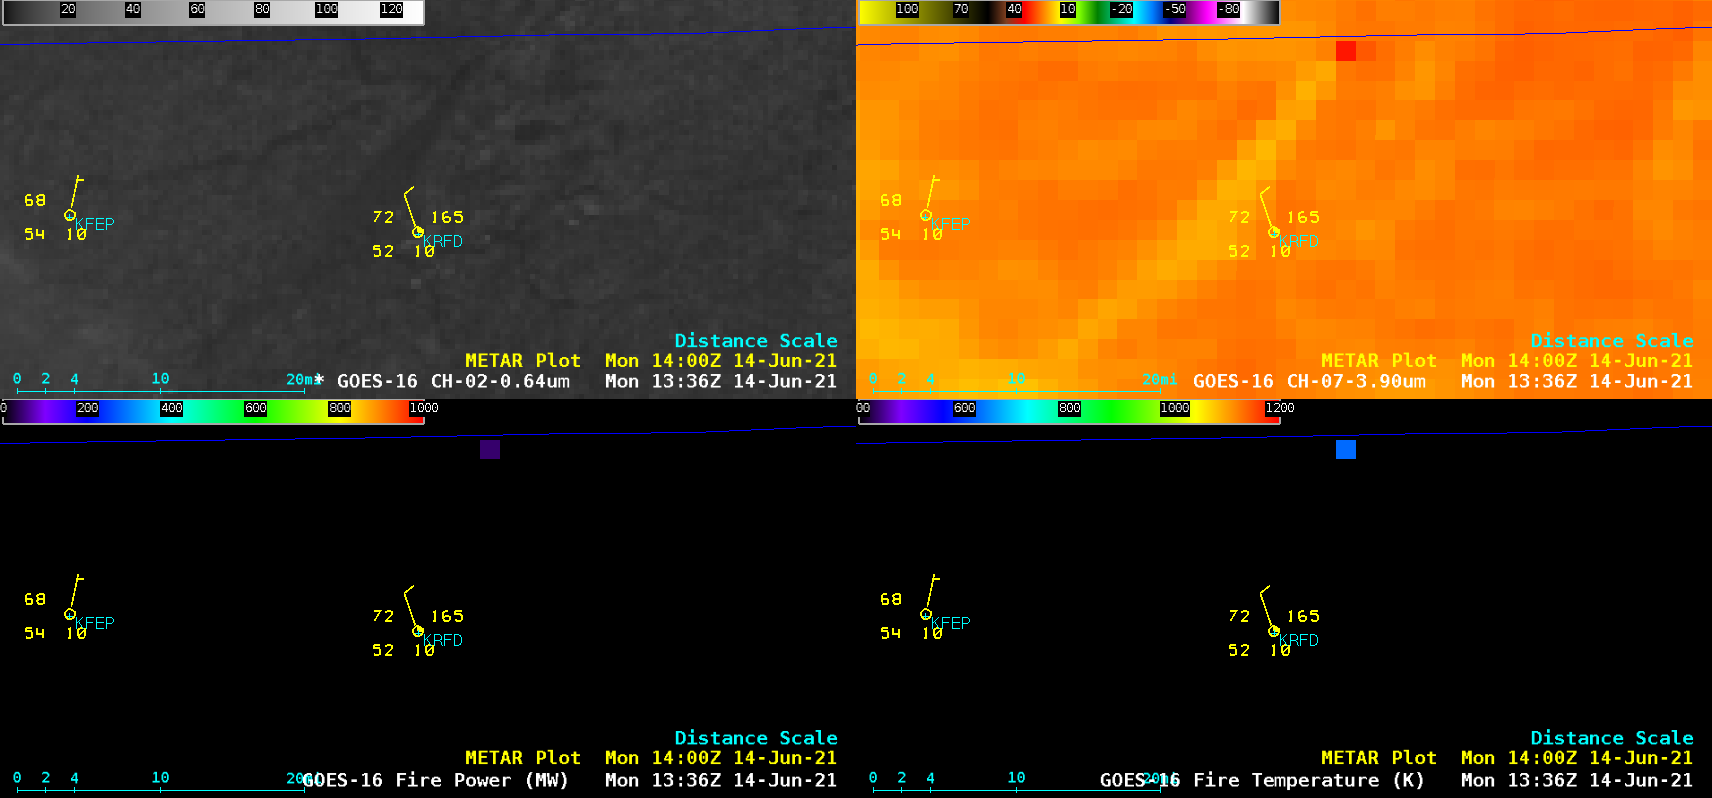
GOES-16 “Red” Visible (0.64 µm, top left), Shortwave Infrared (3.9 µm, top right), Fire Power (bottom left) and Fire Temperature (bottom right) [click to play animation | MP4]
GOES-16
(GOES-East) “Red” Visible (
0.64 µm), Shortwave Infrared (
3.9 µm), Fire Power and Fire Temperature derived products
(above) showed the dark black smoke plume and thermal signature of a fire from an explosion at the Lubrizon Corporation Chemtool facility at Rockton in far northern Illinois on
14 June 2021. The thick smoke plume obscured the satellite’s view of the fire point source much of the time, preventing the continuous derivation of Fire Power and Fire Temperature products (and masking the thermal anomaly in the Shortwave Infrared images).
However, a comparison of Shortwave Infrared images from GOES-17 (GOES-West) and GOES-16 (below) revealed that the western satellite’s viewing angle allowed the thermal anomaly of the fire source (hot black-enhanced pixel) to be seen for a longer time period — even after the dark smoke plume had become well established.
![Shortwave Infrared (3.9 µm) images from GOES-17 (left) and GOES-16 (right) [click to play animation | MP4]](https://cimss.ssec.wisc.edu/satellite-blog/images/2021/06/G17_G16_SWIR_IL_FIRE_14JUN2021_B77_2021165_145032_0002PANELS_FRAME0000036.GIF)
Shortwave Infrared (3.9 µm) images from GOES-17 (left) and GOES-16 (right) [click to play animation | MP4]
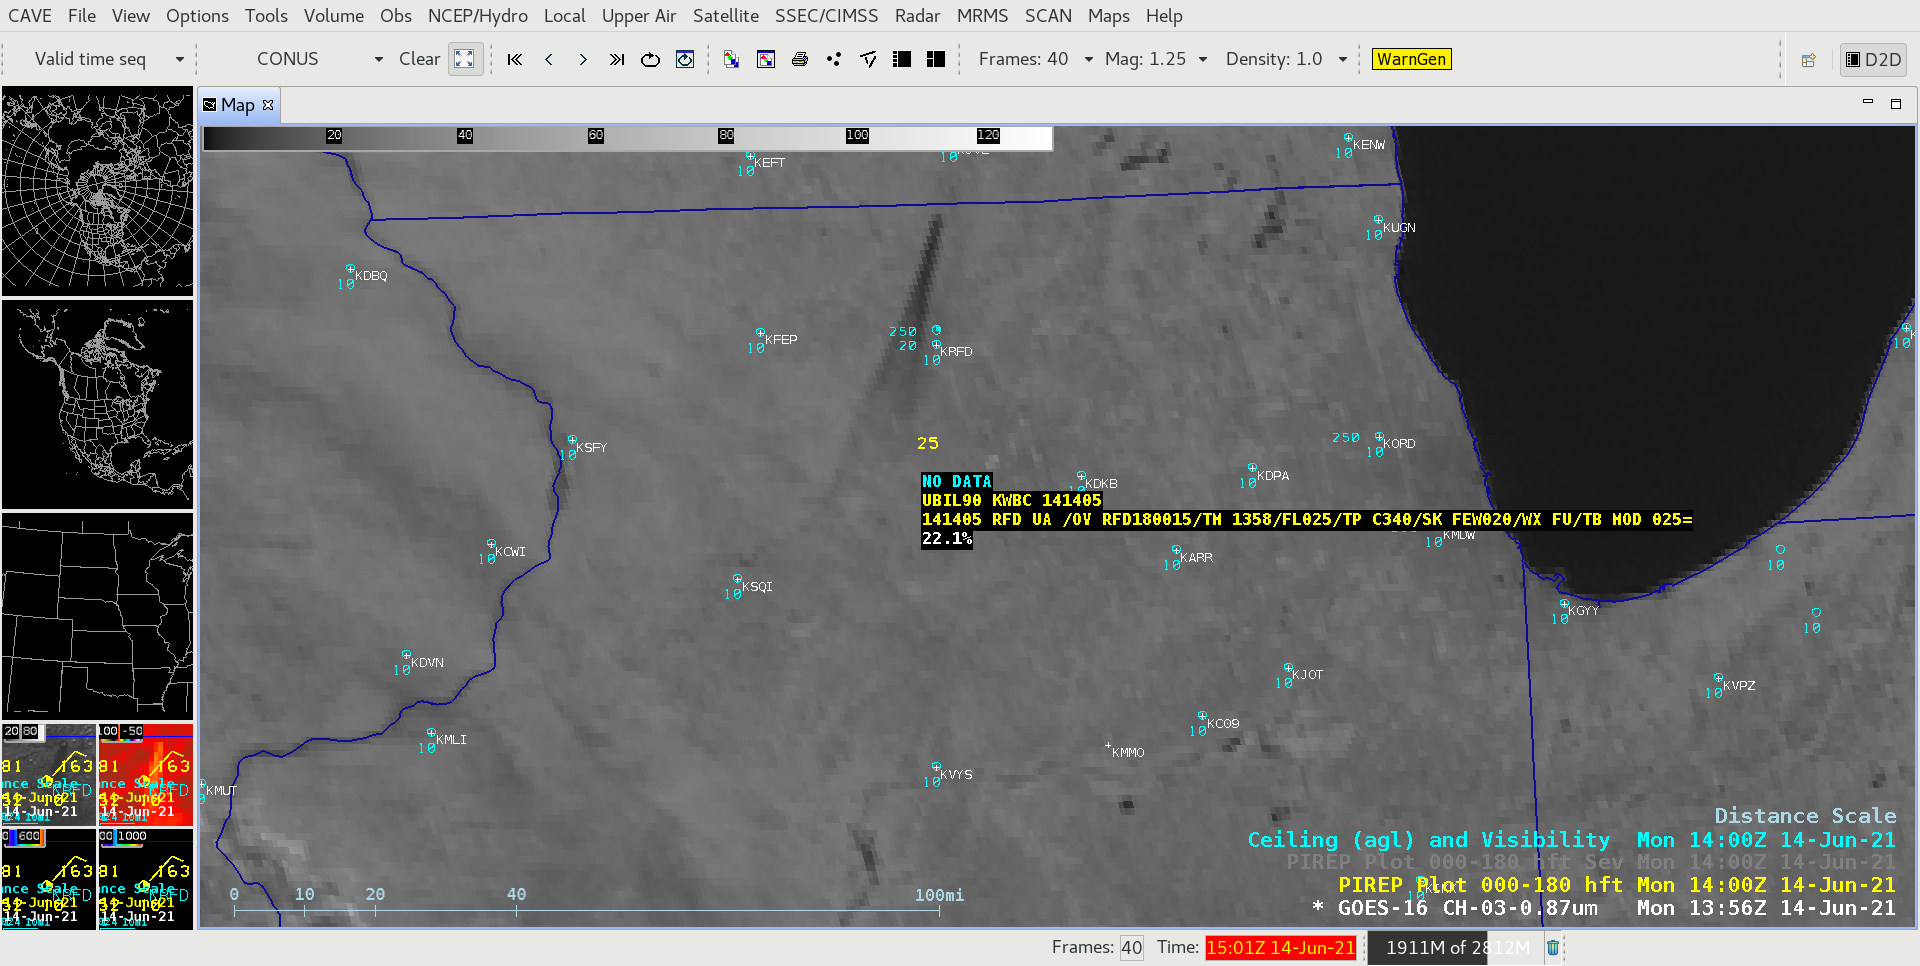
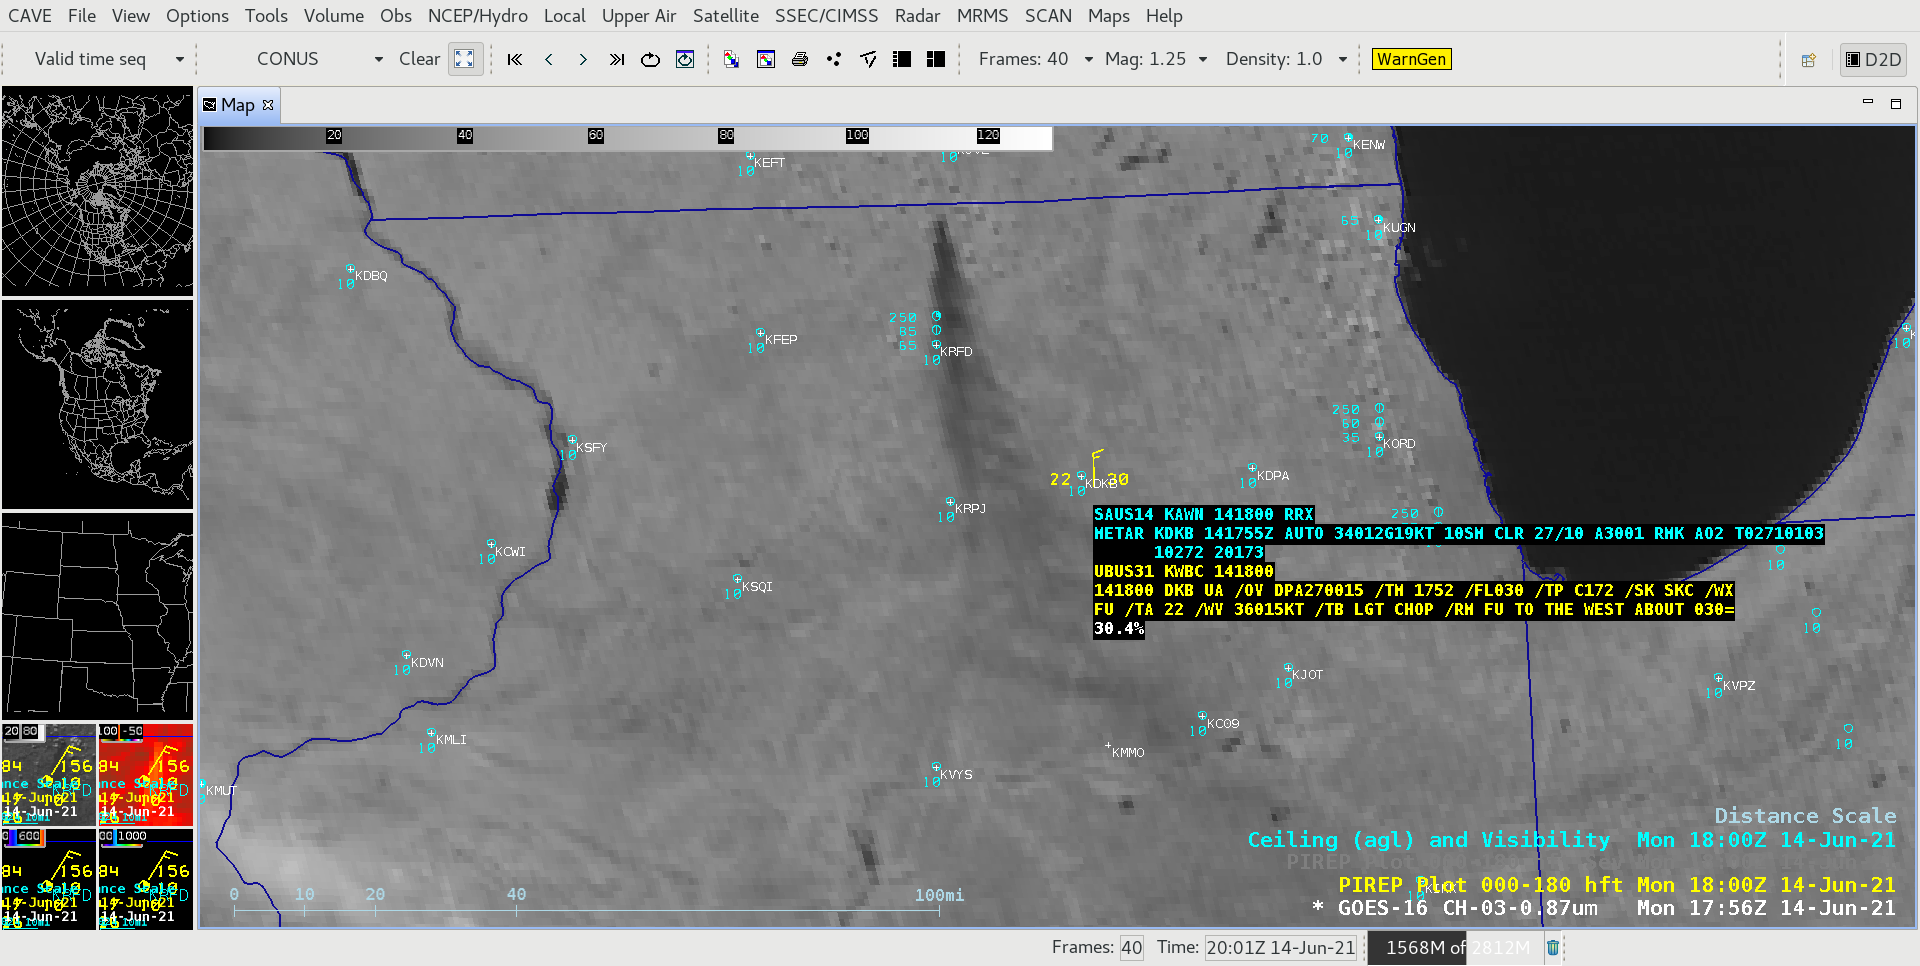
GOES-16 Near-Infrared “Vegetation” (
0.86 µm) images with plots of pilot reports
(below) indicated that the smoke existed at altitudes of
2500 to
3000 feet, but was not restricting the surface visibility at sites that were downwind of the fire.
![GOES-16 Near-Infrared "Vegetation" (0.86 µm) image, with plots of pilot reports and airport ceilings and visibility [click to enlarge]](https://cimss.ssec.wisc.edu/satellite-blog/images/2021/06/il_fire_nir-20210614_170116.png)
GOES-16 Near-Infrared “Vegetation” (0.86 µm) images, with plots of pilot reports (yellow) and airport ceilings and visibility (cyan) [click to enlarge]
Closer views of GOES-16 Near-Infrared “Vegetation” images created using
Geo2Grid (below) showed the southward transport of dark smoke as the fire continued to burn into the afternoon hours.
![GOES-16 Near-Infrared "Vegetation" (0.86 µm) images [click to play animation | MP4]](https://cimss.ssec.wisc.edu/satellite-blog/images/2021/06/GOES-16_ABI_RadC_C03_2021165_151616Z.png)
GOES-16 Near-Infrared “Vegetation” (0.86 µm) images (credit: Tim Schmit, NOAA/NESDIS) [click to play animation | MP4]
Due to the very dark character of this particular smoke plume, it showed up much better against the more reflective surface in 0.86 µm imagery (compared to 0.64 µm “Red” Visible imagery), as seen in the image toggle below.
![GOES-16 "Red" Visible (0.64 µm) and Near-Infrared "Vegetation" (0.86 µm) images at 1516 UTC (credit: Tim Schmit, NOAA/NESDIS) [click to enlarge]](https://cimss.ssec.wisc.edu/satellite-blog/images/2021/06/GOES-16_ABI_RadC_C02_C03_2021165_151616Z.gif)
GOES-16 “Red” Visible (0.64 µm) and Near-Infrared “Vegetation” (0.86 µm) images at 1516 UTC (credit: Tim Schmit, NOAA/NESDIS) [click to enlarge]
The dark smoke plume was also evident in various GOES-16 RGB combinations, such as True Color, Day Land Cloud, and Day Snow Fog
(below). True Color RGB images showed that the smoke eventually drifted over far western Indiana.
![GOES-16 True Color RGB images [click to play animation | MP4]](https://cimss.ssec.wisc.edu/satellite-blog/images/2021/06/GOES-16_ABI_RadC_true_color_2021165_170116Z.png)
GOES-16 True Color RGB images [click to play animation | MP4]
![GOES-16 Day Land Cloud RGB images [click to play animation | MP4]](https://cimss.ssec.wisc.edu/satellite-blog/images/2021/06/il_fire_rgb-20210614_170116.png)
GOES-16 Day Land Cloud RGB images [click to play animation | MP4]
![GOES-16 Day Snow Fog RGB images [click to play animation | MP4]](https://cimss.ssec.wisc.edu/satellite-blog/images/2021/06/GOES-16_ABI_RadC_day_snow_fog_2021165_171616Z.png)
GOES-16 Day Snow Fog RGB images (credit: Tim Schmit/NOAA/NESDIS) [click to play animation | MP4]
View only this post
Read Less

![GOES-16 "Red Visible (0.64 µm, top left), Shortwave Infrared (3.9 µm, top right), Fire Power (bottom left) and Fire Temperature (bottom right) [click to play animation | MP4]](https://cimss.ssec.wisc.edu/satellite-blog/images/2021/06/210614_goes16_visible_shortwaveInfrared_firePower_fireTemperature_IL_chemical_plant_fire_anim.gif)
![Shortwave Infrared (3.9 µm) images from GOES-17 (left) and GOES-16 (right) [click to play animation | MP4]](https://cimss.ssec.wisc.edu/satellite-blog/images/2021/06/210614_goes17_goes16_shortwaveInfrared_IL_fire_anim.gif)
![GOES-16 Near-Infrared "Vegetation" (0.86 µm) image, with plots of pilot reports and airport ceilings and visibility [click to enlarge]](https://cimss.ssec.wisc.edu/satellite-blog/images/2021/06/210614_goes16_nearInfraredVegetation_IL_fire_smoke_plume_anim.gif)
![GOES-16 Near-Infrared "Vegetation" (0.86 µm) images [click to play animation | MP4]](https://cimss.ssec.wisc.edu/satellite-blog/images/2021/06/GOES-16_RadC_C03_2021165_120000_2021165_192500.gif)
![GOES-16 True Color RGB images [click to play animation | MP4]](https://cimss.ssec.wisc.edu/satellite-blog/images/2021/06/210614_goes16_trueColorRGB_IL_fire_smoke_plume_anim.gif)
![GOES-16 Day Land Cloud RGB images [click to play animation | MP4]](https://cimss.ssec.wisc.edu/satellite-blog/images/2021/06/210614_goes16_dayLandCloudRGB_IL_fire_smoke_plume_anim.gif)
![GOES-16 Day Snow Fog RGB images [click to play animation | MP4]](https://cimss.ssec.wisc.edu/satellite-blog/images/2021/06/GOES-16_RadC_day_snow_fog_2021165_120000_2021165_192500.gif)
