North Carolina fertilizer plant fire
GOES-16 Near-Infrared (1.61 µm, left and 2.24 µm, center) and Shortwave Infrared (3.9 µm, right) images [click to play animated GIF | MP4]
Note that a faint thermal signature of the fire (pixels exhibiting dim shades of white) was also seen in the Near-Infrared (1.61 µm Band 5 and 2.24 µm Band 6) images — this is because those two ABI spectral bands are located close to the peak emitted radiance of very hot features such as large fires (below).
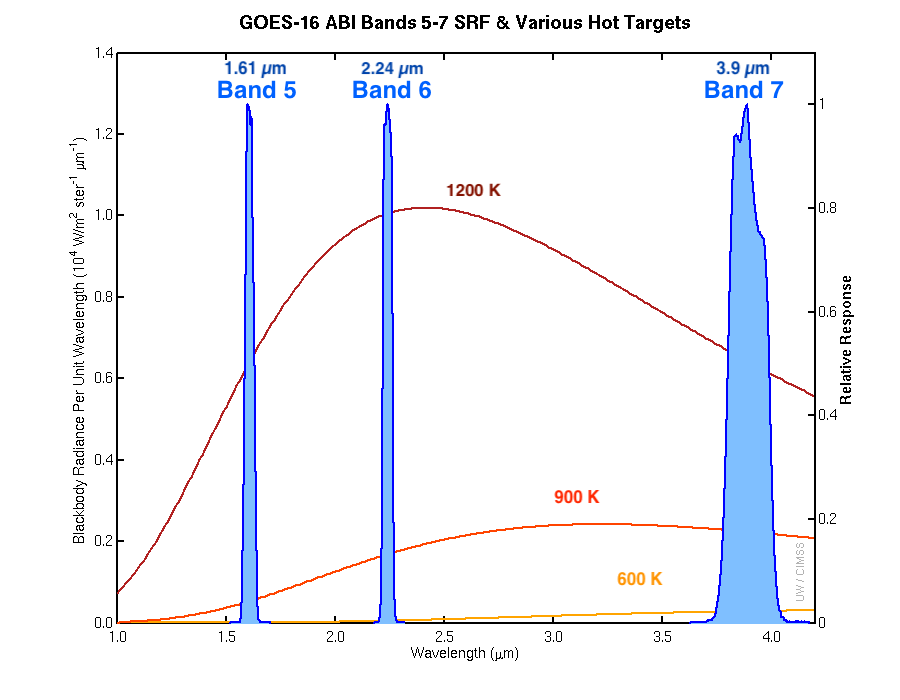
Spectral Response Function (SRF) plots for GOES-16 ABI Bands 5, 6 and 7 (credit: Mat Gunshor, CIMSS) [click to enlarge]