This website works best with a newer web browser such as Chrome, Firefox, Safari or Microsoft
Edge. Internet Explorer is not supported by this website.
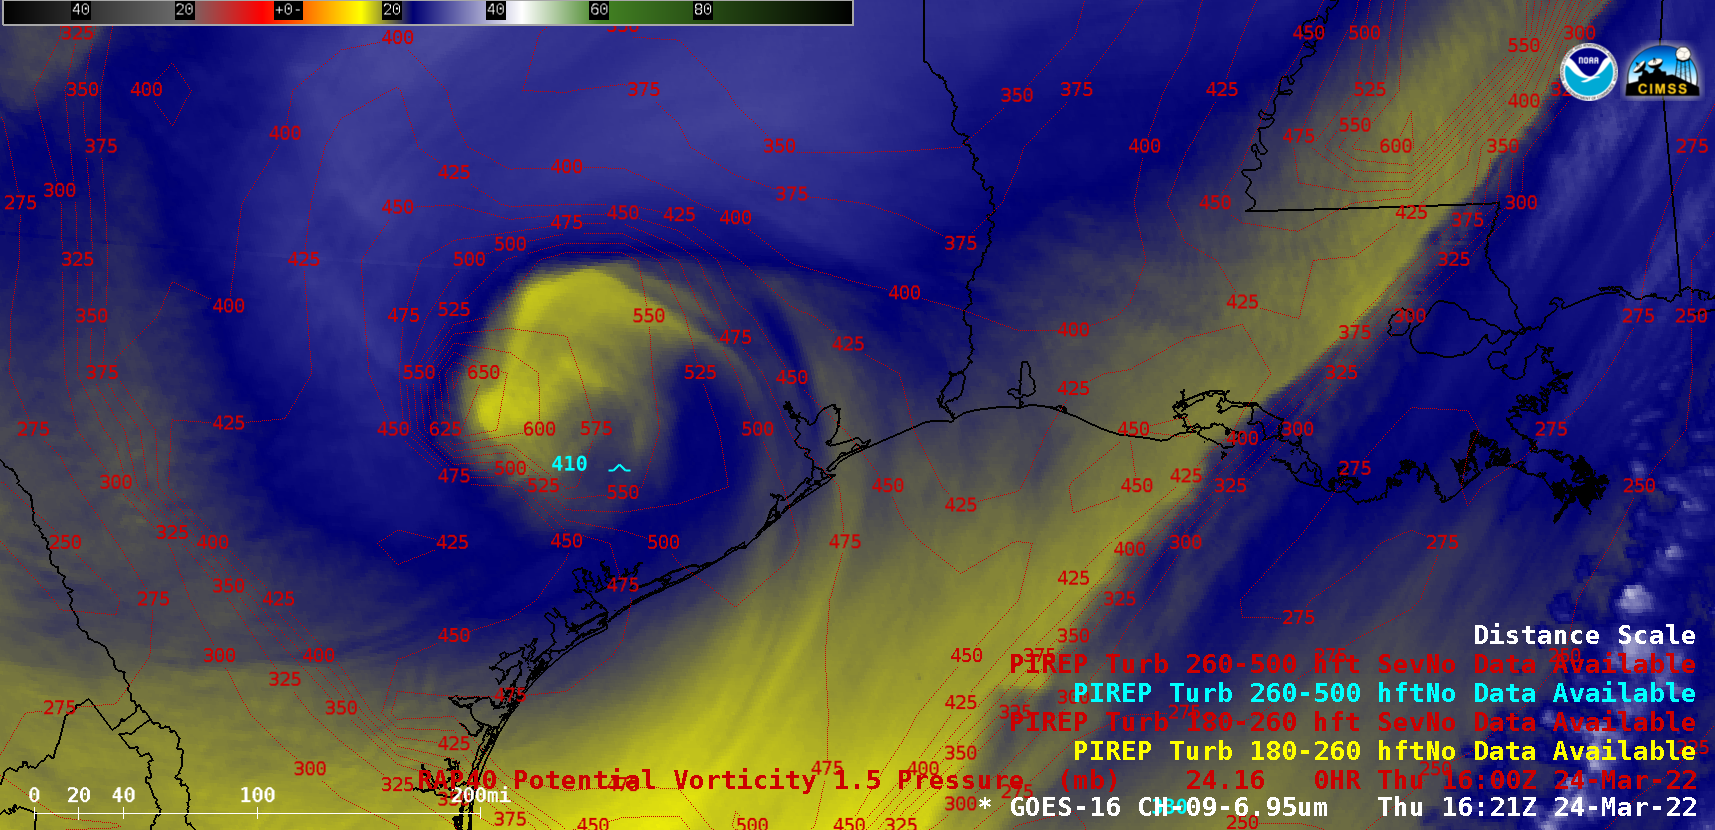
GOES-16 (GOES-East) Mid-level Water Vapor (6.9 µm) images (above) displayed an isolated vortex of very dry air moving over Texas and Louisiana on 24 March 2022. Contours of RAP40 model PV1.5 Pressure — a representation of the “dynamic tropopause” — indicated that this dry feature was a Potential Vorticity (PV) anomaly,... Read More
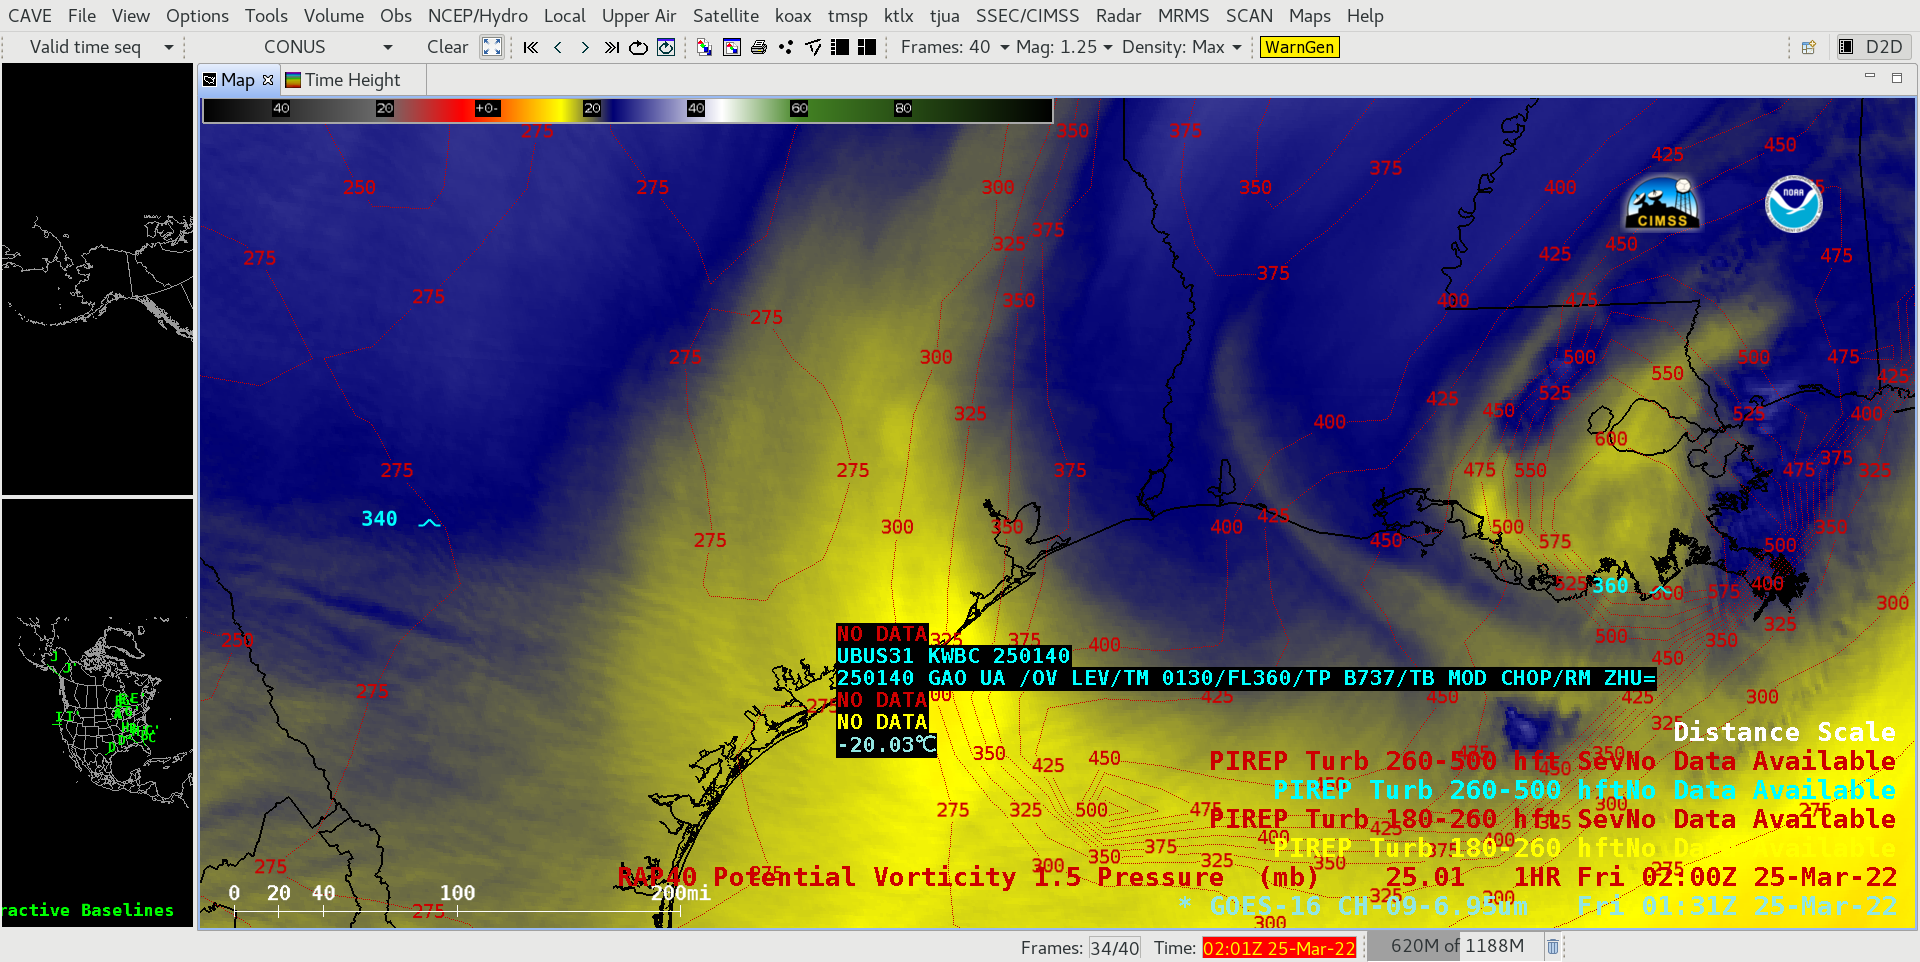
GOES-16 Mid-level Water Vapor (6.9 µm) images, with contours of RAP40 model PV1.5 Pressure plotted in red and Pilot Reports of Turbulence plotted in yellow/cyan [click to play animated GIF | MP4]
GOES-16 (GOES-East) Mid-level Water Vapor (6.9 µm) images (above) displayed an isolated vortex of very dry air moving over Texas and Louisiana on 24 March 2022. Contours of RAP40 model PV1.5 Pressure — a representation of the “dynamic tropopause” — indicated that this dry feature was a Potential Vorticity (PV) anomaly, which forced the local tropopause to briefly descend as low as the 650 hPa pressure level as the feature passed over that region.
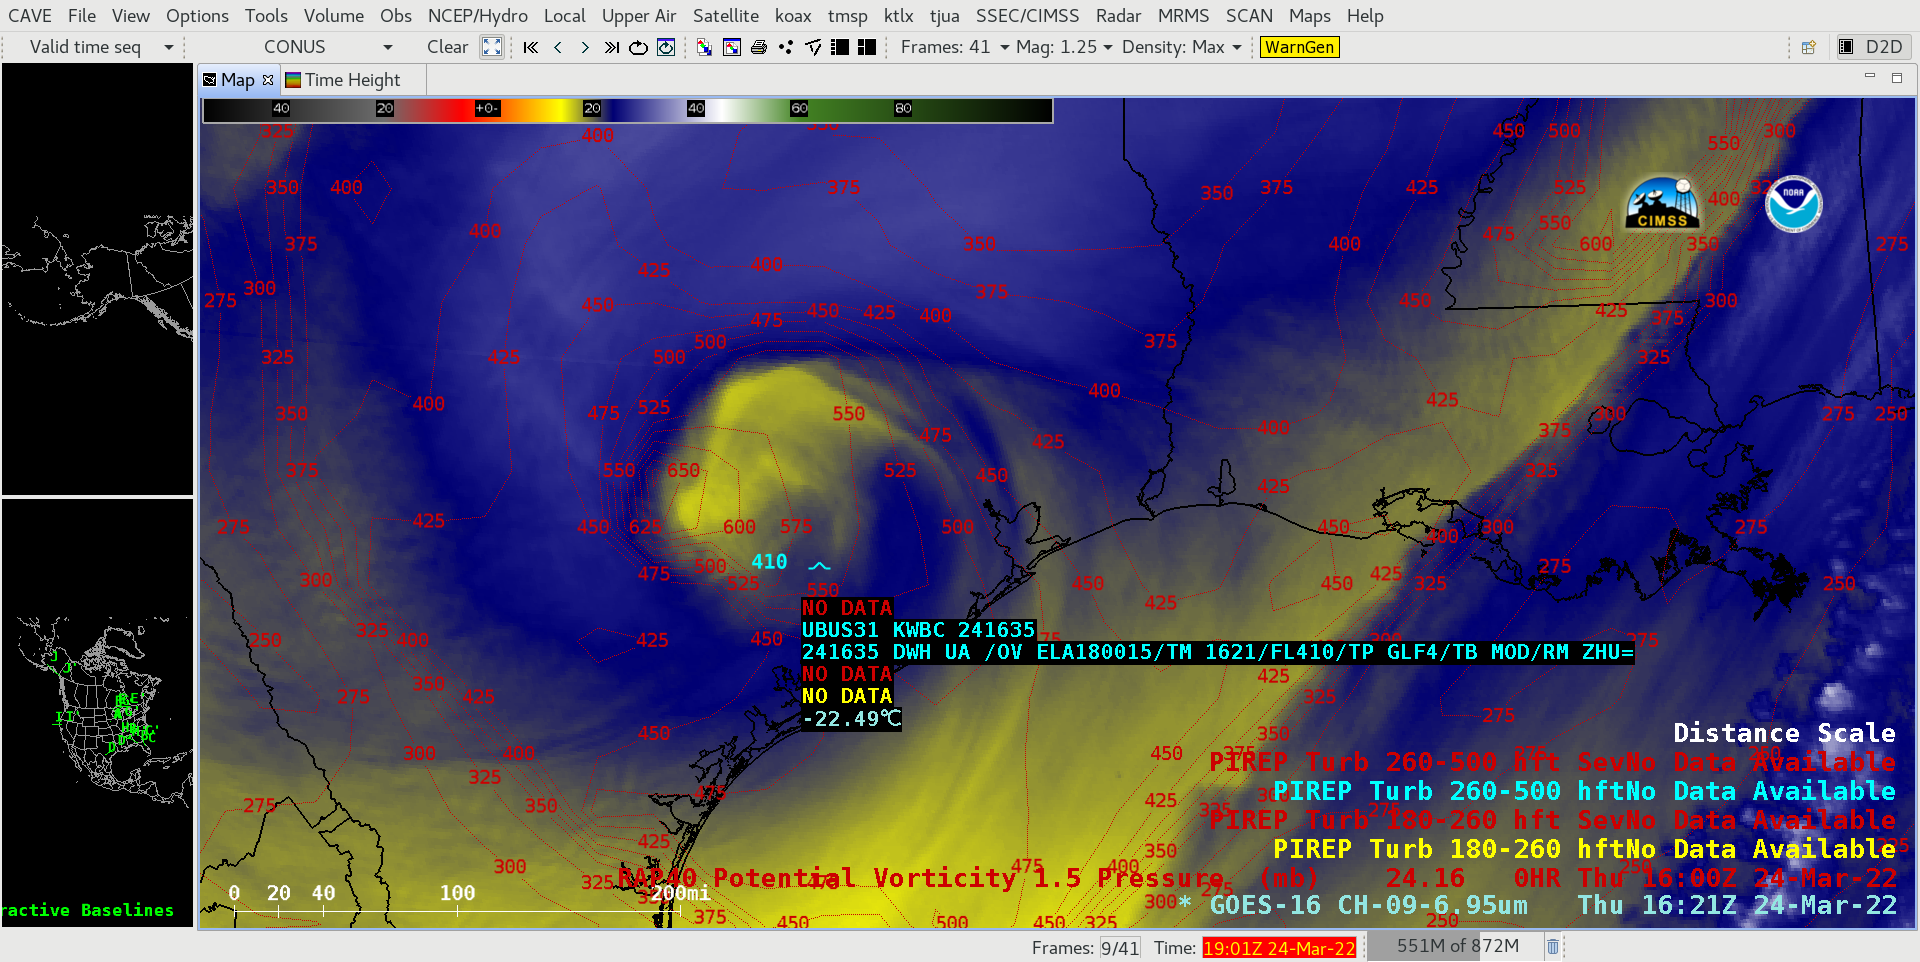
Aircraft flying in the vicinity of such PV anomaly vortices sometimes encounter turbulence within the middle to upper troposphere, near altitudes where the tropopause is being perturbed — and in this case there were 3 pilot reports of moderate turbulence near or within the dry water vapor vortex signature (below).
GOES-16 Mid-level Water Vapor (6.9 µm) image at 1621 UTC, with contours of RAP40 model PV1.5 Pressure plotted in red and Pilot Reports of Turbulence plotted in yellow/cyan [click to enlarge]
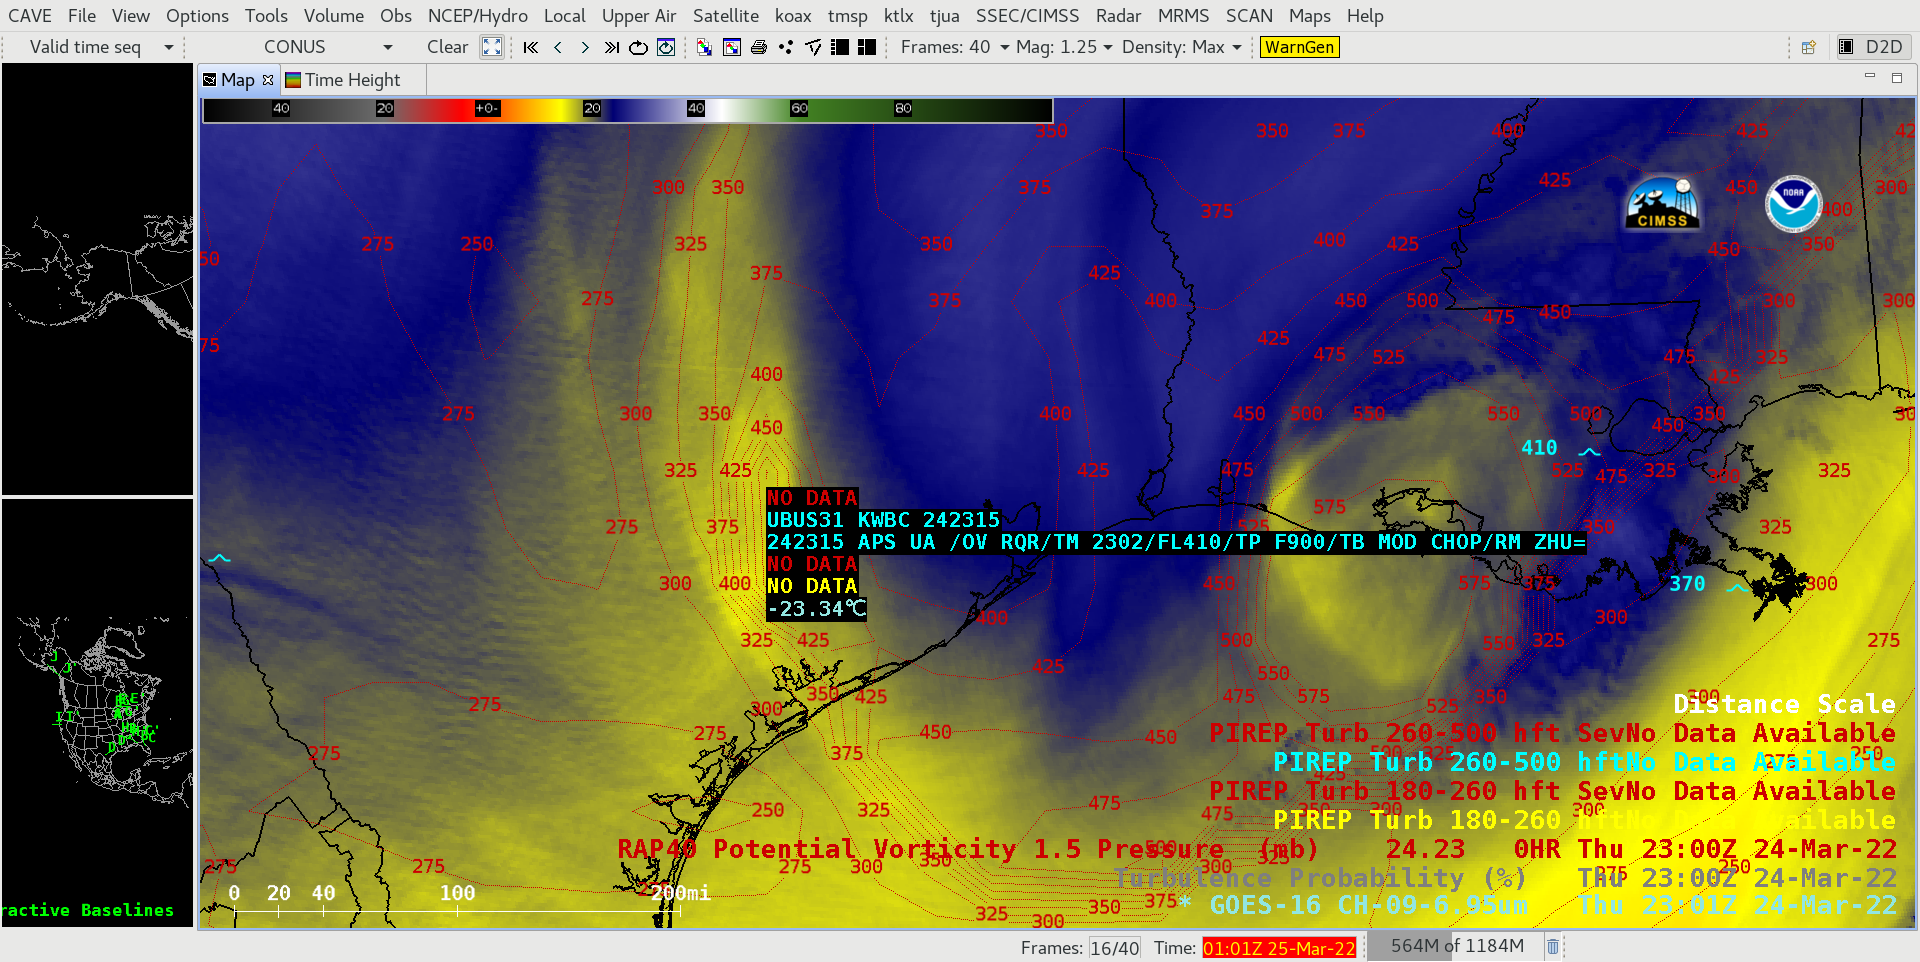
GOES-16 Mid-level Water Vapor (6.9 µm) image at 2301 UTC, with contours of RAP40 model PV1.5 Pressure plotted in red and Pilot Reports of Turbulence plotted in yellow/cyan [click to enlarge]
GOES-16 Mid-level Water Vapor (6.9 µm) image at 0131 UTC, with contours of RAP40 model PV1.5 Pressure plotted in red and Pilot Reports of Turbulence plotted in yellow/cyan [click to enlarge]
Hyperspectral soundings — for example the Cross-track Infrared Sounder (CrIS) on NOAA-20/Suomi-NPP and the Infrared Atmospheric Sounding Interferometer (IASI) on MetOp — observe the atmosphere at thousands of wavelengths in the near-infrared and infrared part of the electromagnetic spectrum. The excellent spectral resolution allows for good vertical resolution of temperature... Read More
Hyperspectral soundings — for example the Cross-track Infrared Sounder (CrIS) on NOAA-20/Suomi-NPP and the Infrared Atmospheric Sounding Interferometer (IASI) on MetOp — observe the atmosphere at thousands of wavelengths in the near-infrared and infrared part of the electromagnetic spectrum. The excellent spectral resolution allows for good vertical resolution of temperature and (especially) moisture in the atmosphere; Polar Hyperspectral Soundings (PHS) are created from these data to give profiles of temperature and moisture. Data fusion, described in this Smith et al. paper from 2020, relates ABI information to PHS when the polar observations are made (the technique used is a bit different from the GEO+LEO technique described in this Weisz and Menzel paper from 2019). Those relationships are subsequently carried forward in time, thereby exploiting both the excellent spectral resolution available from polar satellites and the excellent spatial and temporal resolution from ABI. Qi Zhang and Bill Smith, Sr. at Hampton University are running a model that takes advantage of this data fusion. Output from this modeling effort have been previously discussed here and here on this blog, and is available here. In the past year, the modeling effort has expanded to include microwave information (from the Advanced Technology Microwave Sounder (ATMS) on NOAA-20/Suomi-NPP) to give more accurate satellite-derived moisture information below the cloud-tops.
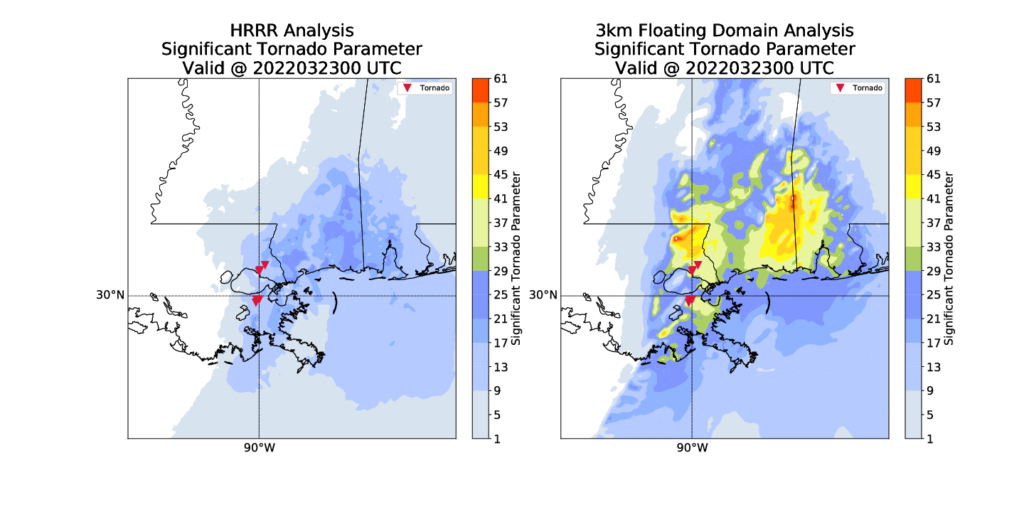
The imagery below shows forecasts of Significant Tornado Parameter from two different 3-km runs, one with a domain centered on the risk as defined by the Storm Prediction Center, one with a static domain. Note the close correlation between the region of larger values and the observed tornadoes. Results between the two forecasts are similar, but the false alarm rate is somewhat smaller in the small domain.
SPC Storm Reports from 21 March 2022 (left), and model fields of Significant Tornado Potential, hourly from 0300 to 0600 UTC on 22 March (right) (Click to enlarge)
New Orleans LA was hit by a tornado (discussed here) after sunset on 22 March 2022. Tornado locations are shown by the inverted red triangles in the figures below. The Significant Tornado Parameters from the 3-km model that includes PHS data, microwave data, and ABI data has a maximum in the region of the tornado. This is useful information to have when anticipating the tornado development.
The combination of polar hyperspectral soundings with ABI data has been explored since before the launch of GOES-R, and in fact back to about 2008! Funding for this effort has been supplied in the past by both GOES-R and JPSS Risk Reduction initiatives.
In the (distant) future, when NOAA’s Geostationary Extended Observations (GeoXO) satellite system is in orbit (click here for more information on GeoXO), routine soundings of the atmosphere will allow this type of modeling effort with better initial conditions because there will be a much smaller time between the observations (from Geostationary in the future vs. from Polar Orbiters now) and the model initialization.
1-minute Mesoscale Domain Sector GOES-16 (GOES-East) “Red” Visible (0.64 µm) images (above) include time-matched SPC Storm Reports — and showed some of the widespread severe weather produced by thunderstorms that developed ahead of a cold front which was moving eastward across the Deep South on 22 March 2022. The severe weather persisted for several hours past... Read More
GOES-16 “Red” Visible (0.64 µm) images, with time-matched SPC Storm Reports plotted in red [click to play animated GIF | MP4]
1-minute Mesoscale Domain Sector GOES-16 (GOES-East) “Red” Visible (0.64 µm) images (above) include time-matched SPC Storm Reports — and showed some of the widespread severe weather produced by thunderstorms that developed ahead of a cold front which was moving eastward across the Deep South on 22 March 2022.
The severe weather persisted for several hours past sunset, as displayed below by GOES-16 “Clean” Infrared Window (10.35 µm) images ending at 0416 UTC on 23 March (11:16 pm CDT on 22 March).
GOES-16 “Clean” Infrared Window (10.35 µm) images, with time-matched SPC Storm Reports plotted in blue [click to play animated GIF | MP4]
A closer look at the development of a supercell thunderstorm that produced an EF-3 tornado in Arabi (within the eastern portion of the Greater New Orleans metropolitan area) is shown below.
GOES-16 “Clean” Infrared Window (10.35 µm) images, with time-matched SPC Storm Reports plotted in blue [click to play animated GIF | MP4]
Tuesday's EF-3 tornado had an est. peak wind of 160 mph, making it the strongest tornado to impact Orleans/Jefferson/St. Bernard Parishes on record. It's also only the second F-/EF-3 or higher tornado. A small section of New Orleans East were impacted by both EF-3 tornadoes. pic.twitter.com/IlEFLjLHGq
Severe weather season is underway across the southern U.S. NOAA and CIMSS are using satellite, radar, and lightning observations of thunderstorms to develop and evaluate artificial intelligence (AI) tools that forecast and diagnose convection.The NOAA/CIMSS ProbSevere portfolio has several such tools to help forecasters keep tabs on storms. LightningCastProbSevere LightningCast... Read More
Severe weather season is underway across the southern U.S. NOAA and CIMSS are using satellite, radar, and lightning observations of thunderstorms to develop and evaluate artificial intelligence (AI) tools that forecast and diagnose convection.The NOAA/CIMSS ProbSevere portfolio has several such tools to help forecasters keep tabs on storms.
LightningCast
ProbSevere LightningCast is a model that uses images of geostationary ABI data from GOES-16 or GOES-17 to predict where lightning will strike (as observed by the GLM) out to 60 minutes. We’ve found that the product frequently provides 15-30 minutes of lead-time to lightning initiation, measured from the 30-40% probability range (the most skillful range). LightningCast will be evaluated at the 2022 NOAA Hazardous Weather Testbed and at certain offices within the NWS. LightningCast may be able to one day aid forecasters in providing decision support services and general convective initiation situational awareness. Below is a movie of LightningCast output (contours) overlaid on the GOES-16 daytime cloud phase distinction RGB and GLM flash-extent density, for the developing severe storms in Texas on March 21st.
IntenseStormNet
Another image-based AI model within ProbSevere is called IntenseStormNet, which seeks to identify the most intense regions of thunderstorms. It uses images of ABI and GLM data as predictors to probabilistically diagnose storm intensity from a geostationary perspective. Its goal is to identify intense parts of storms as humans do: holistically; by picking up on the spatial and multispectral features that imagery captures, such as overshooting tops, cold-U/AACP, cloud-top texture patterns, and stark cloud edges. In a paper published in 2020, we found that high probabilities from IntenseStormNet are frequently correlated with severe weather reports. Below shows IntenseStormNet output (contours) for some of the storms over Texas on March 21st, most of which spawned hail, damaging winds, and several tornadoes. IntenseStormNet contours can also be tracked over time, providing a novel way to investigate convective properties of storms.
ProbSevere v3
IntenseStormNet output is also being used as a predictor within the experimental ProbSevere v3, which uses satellite, radar, lightning, and NWP data, and machine-learning (ML) models to forecast the probabilities of hail, severe winds, and tornadoes in the next 60 minutes. While ProbSevere v2 is operational at NOAA’s Centers for Environmental Prediction, ProbSevere v3 is being evaluated by NWS forecasters at the 2022 Hazardous Weather Testbed. An analysis of thousands of storms from 2021 showed that additional predictors and the more sophisticated ML models in v3 improve upon v2 performance. ProbSevere uses multi-sensor storm tracking and feature extraction to predict probabilities of severe weather across the U.S. Below are several animations of ProbSevere v3 output in Texas on March 21st.
ProbSevere v3 output (contours), MRMS composite reflectivity, and NWS severe weather warnings for storms in northern Texas on March 21st.ProbSevere v3 output (contours), MRMS composite reflectivity, and NWS severe weather warnings for storms in central Texas on March 21st.