This website works best with a newer web browser such as Chrome, Firefox, Safari or Microsoft
Edge. Internet Explorer is not supported by this website.
1-minute Mesoscale Domain Sector GOES-16 (GOES-East) “Red” Visible (0.64 µm), Shortwave Infrared (3.9 µm) and Infrared Window (10.35 µm) images along with 5-minute Fire Temperature images (above) showed intensification of 3 portions of the combined Calf Canyon Fire and Hermits Peak Fire in New Mexico on 01 May 2022. Active fire behavior was aided... Read More
GOES-16 “Red” Visible (0.64 µm, top left), Shortwave Infrared (3.9 µm, top right), Infrared Window (10.35 µm, bottom left) and Fire Temperature (bottom right) [click to play animated GIF | MP4]
1-minute Mesoscale Domain Sector GOES-16 (GOES-East) “Red” Visible (0.64 µm), Shortwave Infrared (3.9 µm) and Infrared Window (10.35 µm) images along with 5-minute Fire Temperature images (above) showed intensification of 3 portions of the combined Calf Canyon Fire and Hermits Peak Fire in New Mexico on 01 May 2022. Active fire behavior was aided by surface winds gusts in the 45-54 mph range and very dry air within the boundary layer; these large fires also burned very hot, with 3.9 µm Shortwave Infrared brightness temperatures reaching 138.71ºC — the saturation temperature of ABI Band 7 detectors. Coldest 10.35 µm cloud-top brightness temperatures of intermittent pyroCumulus clouds were around -37ºC (darker yellow enhancement). The Fire Temperature derived product is a component of the GOES Fire Detection and Characterization Algorithm FDCA.
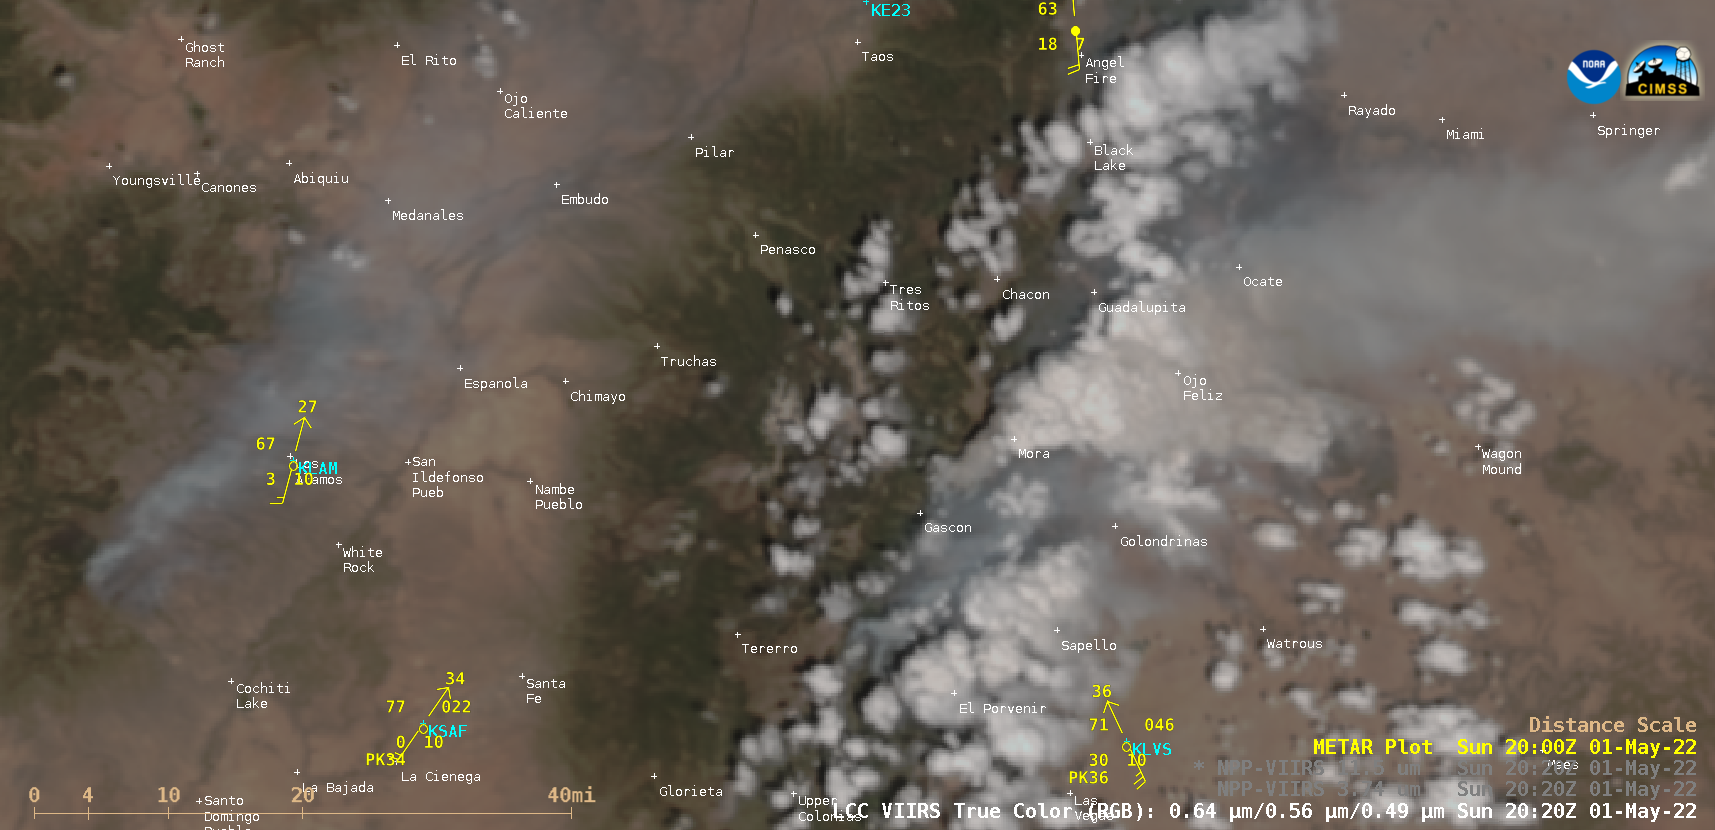
However, in a comparison of 375-meter resolution NOAA-20 VIIRS True Color RGB, Shortwave Infrared (3.74 µm) and Infrared Window (11.45 µm) images valid at 2026 UTC — downloaded and processed using the SSEC/CIMSS Direct Broadcast ground station (below), a small cluster of cloud-top 11.45 µm brightness temperatures of -40 to -43.6ºC (red enhancement) indicated that this feature met the criteria for classification as a pyrocumulonimbus cloud.
NOAA-20 VIIRS True Color RGB, Shortwave Infrared (3.74 µm) and Infrared Window (11.45 µm) images at 2026 UTC [click to enlarge]
The Calf Canyon Fire previously generated a pyroCb cloud on 22 April.
The animation above shows GOES-16 Band 13 Infrared imagery (10.3 µm) monitoring the development of the tornadic thunderstorm just east of Wichita that spawned the EF-3 Andover, KS, tornado (on the ground from 0110 through 0131 UTC) on 30 April 2022 (SPC Storm Reports; Write-up on storms from NWS Wichita). The storm responsible for the... Read More
GOES-16 Clean Window infrared imagery (10.3 µm) from 0001 – 0201 UTC on 30 April 2022 (Click to enlarge)
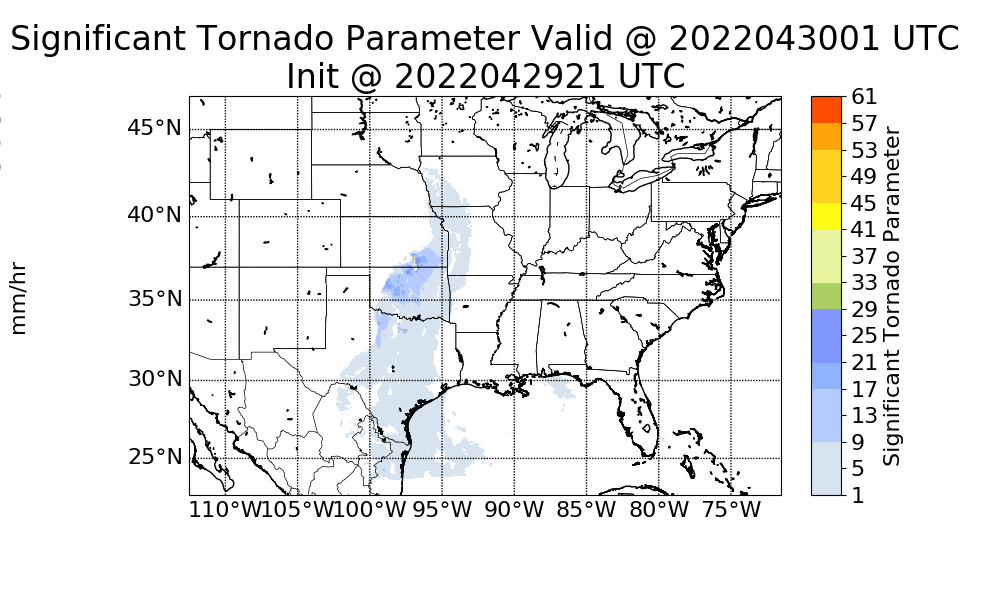
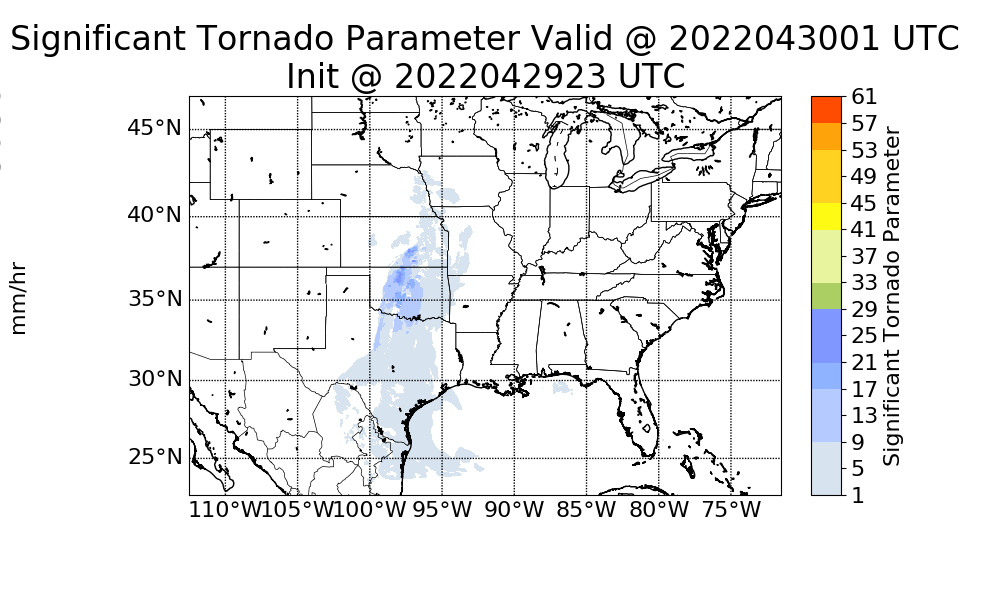
The animation above shows GOES-16 Band 13 Infrared imagery (10.3 µm) monitoring the development of the tornadic thunderstorm just east of Wichita that spawned the EF-3 Andover, KS, tornado (on the ground from 0110 through 0131 UTC) on 30 April 2022 (SPC Storm Reports; Write-up on storms from NWS Wichita). The storm responsible for the tornado was ahead of the cold front, which front is obvious in the infrared imagery to the west of Cherokee (OK) and Anthony (KS). Polar Hyperspectral Soundings (available at this website) are being demonstrated at the Hazardous Weather Testbed this year (starting in late May); how did those model products do with this isolated storm out in front of the approaching cold front? The animation below shows the Significant Tornado Parameter forecasts at 0100 UTC from forecasts starting from 1800 through 2300 UTC on 29 April. Maximum values of STP are over the southeast Kansas, especially for the forecasts initialized at 2100 and 2300 UTC. Guidance was suggesting where to focus attention on the possibility of strongest convection.
Significant Tornado Parameter forecast valid at 0100 UTC on 30 April 2022 for forecasts initialized between 1800 and 2300 UTC on 29 April 2022 (Click to enlarge)
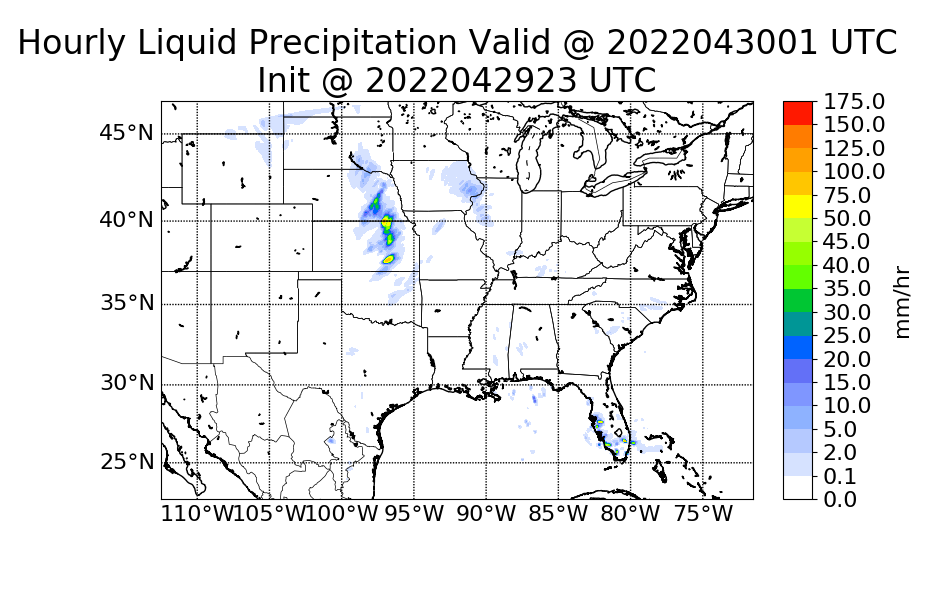
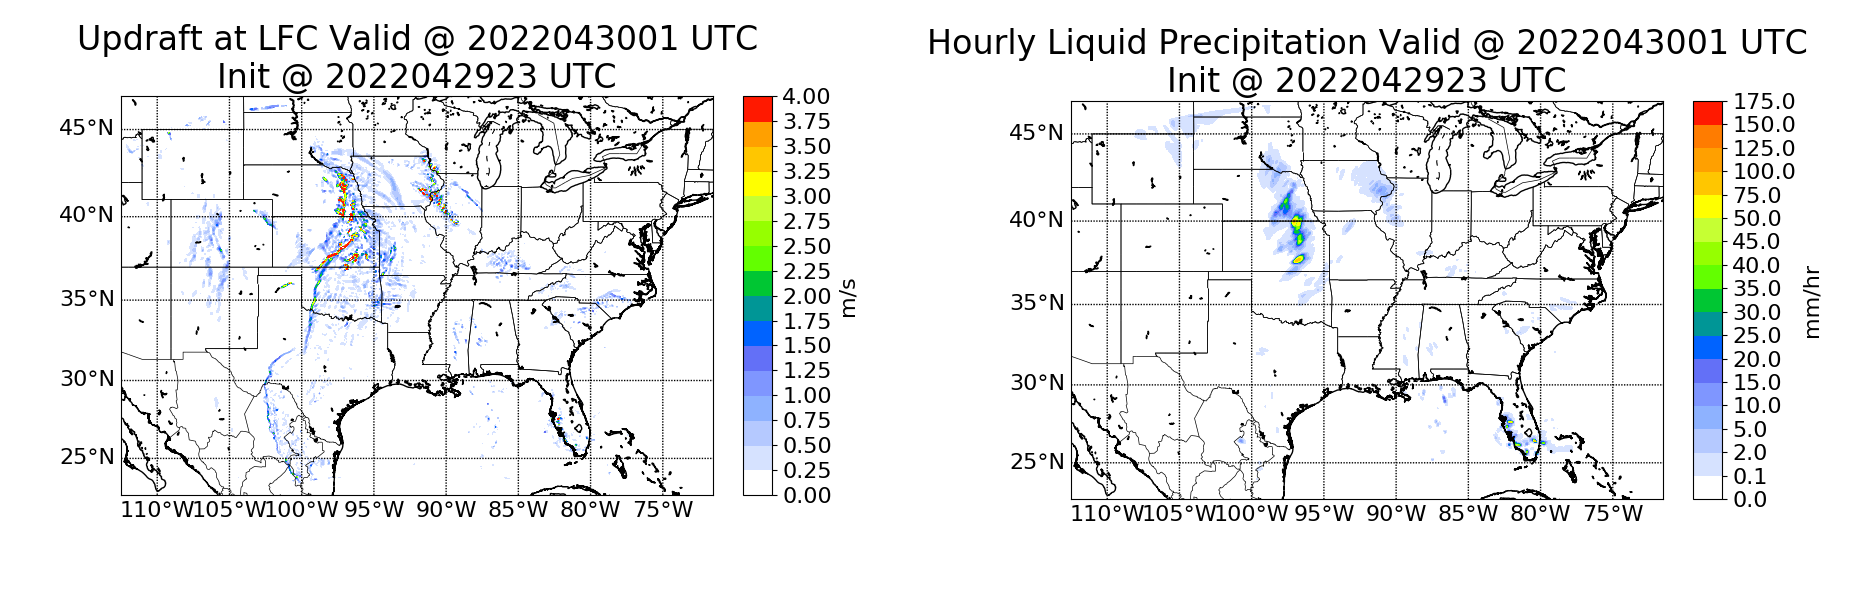
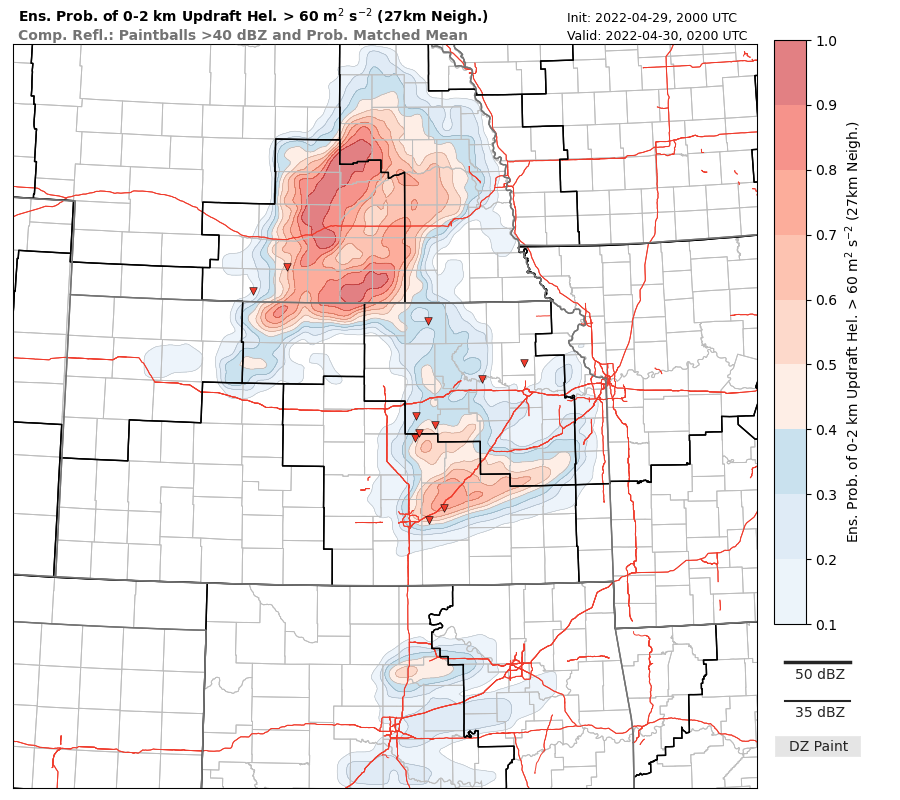
The PHSnMWnABI model outputs other variables, of course, and the updraft velocity at the Level of Free Convection (LFC) and the hourly Liquid Precipitation are shown below. Note the two separate regions of convection (based on the updraft velocities), and how a strong system is present near Wichita at 0100 UTC from the 2300 UTC initialization. The forecast model is pointing a forecaster towards the type of evolution that might happen: Convection in more than one location — with strong updrafts along the front (notable in the Lifted Index and CAPE fields — not shown) but also convection out ahead of that feature as shown in the updraft velocities in the 2300 UTC model run (shown at bottom)
Updraft velocity at the LFC (left) and accumulated hourly precipitation (right) at 0100 UTC on 30 April 2022 from the forecasts initialized between 2000 UTC and 2300 UTC on 29 April 2022 (Click to enlarge)Updraft velocity at the LFC (left) and accumulated hourly precipitation (right) at 0100 UTC on 30 April 2022 from the forecast initialized at 2300 UTC on 29 April 2022 (Click to enlarge)
What did other forecasting models show for this event? The animation below shows ensemble mean STP from the HREF initialized at 1200 UTC on 29 April. (imagery courtesy Jim Caruso, SOO at WFO ICT). STP increases in the vicinity of the observed tornado between 0000 and 0100 UTC. HREF Ensemble Mean Most Unstable Convective Available Potential Energy (MUCAPE) has an axis over the Andover region; updraft helicity signatures are also shown.
HREF Ensemble mean values of STP from the forecast initialized at 1200 UTC, valid hourly from 2200 UTC on 29 April through 0200 UTC on 30 April (Click to enlarge)HREF Ensemble mean values of MUCAPE from the forecast initialized at 1200 UTC, valid hourly from 2200 UTC on 29 April through 0200 UTC on 30 April; Surface-500mb shear is also plotted, as are helicity signatures > 75 (Click to enlarge)
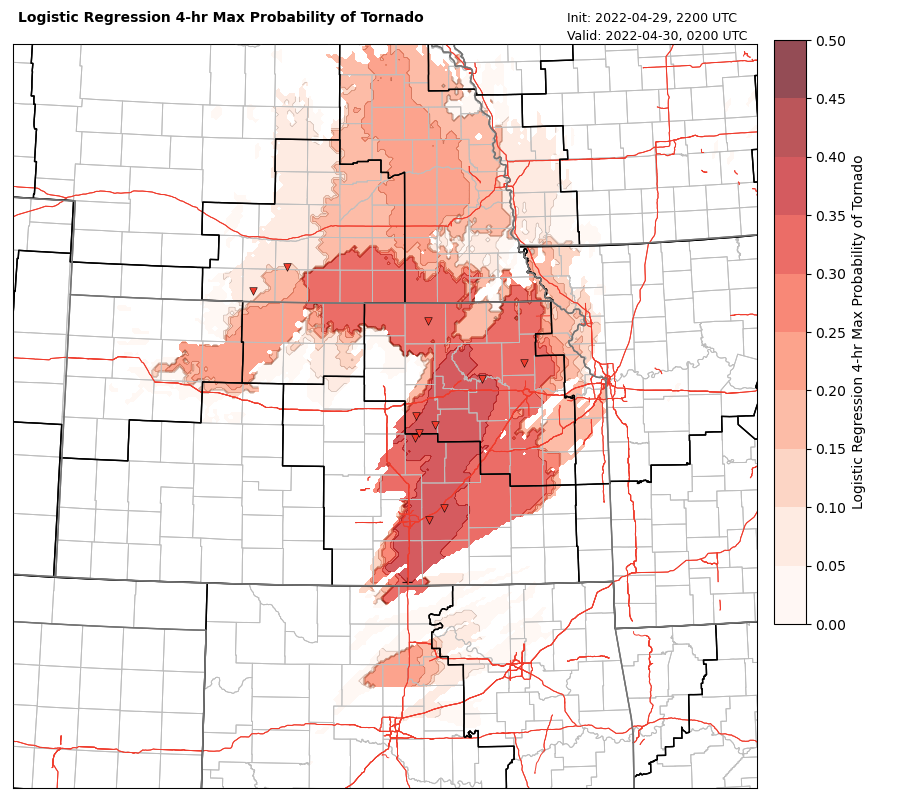
A regression of the 4-h max probability of Tornado (here), from a 2200 UTC initialization and valid through 0200 UTC, shows highest probabilities encompassing most of Butler County (in which Andover is the most populous city). Forecast updraft helicities are greatest just north of Andover.
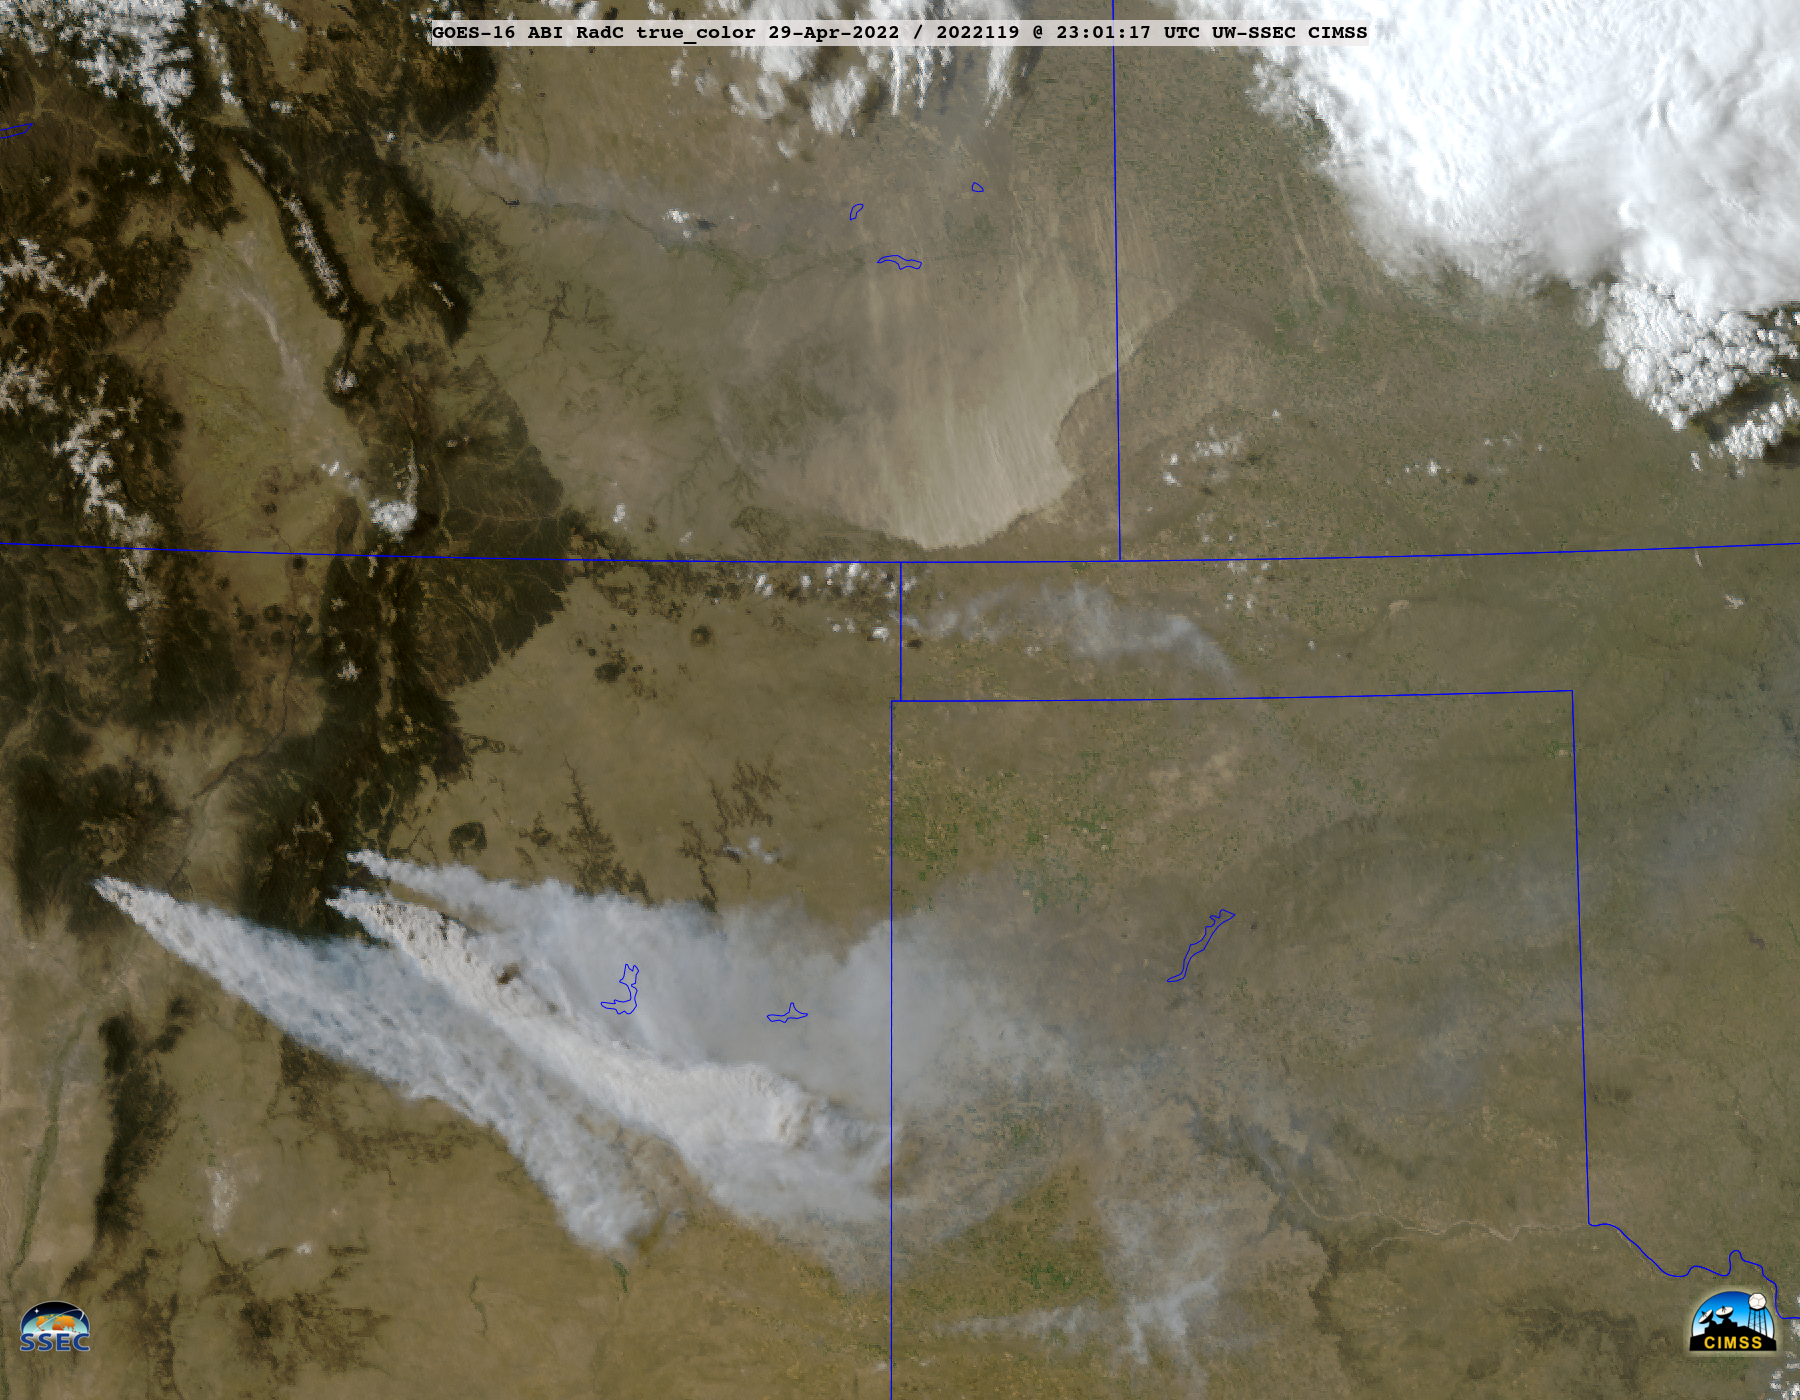
GOES-16 (GOES-East) True Color RGB images created using Geo2Grid (above) revealed dense smoke plumes moving southeastward from wildfires in New Mexico, while blowing dust plunged southward from Colorado/Kansas (along and behind a cold front) on 29 April 2022. Taking a closer look at the New Mexico wildfires using 1-minute Mesoscale Domain Sector GOES-16 “Red” Visible (0.64 µm) and... Read More
GOES-16 True Color RGB images [click to play animated GIF | MP4]
GOES-16 (GOES-East) True Color RGB images created using Geo2Grid(above) revealed dense smoke plumes moving southeastward from wildfires in New Mexico, while blowing dust plunged southward from Colorado/Kansas (along and behind a cold front) on 29 April 2022.
Taking a closer look at the New Mexico wildfires using 1-minute Mesoscale Domain Sector GOES-16 “Red” Visible (0.64 µm) and Shortwave Infrared (3.9 µm) images along with 5-minute Fire Power and Fire Temperature products (below), the smoke plume point sources and thermal signatures of these 3 fires could be seen in great detail. Downwind of one of the fires, smoke restricted the surface visibility to 1-3/4 mile at Las Vegas (KLVS). 3.9 µm Shortwave Infrared brightness temperatures of the 2 larger fires reached 138.71ºC — which is the saturation temperature of ABI Band 7 detectors.The Fire Temperature and Fire Power derived products are components of the GOES Fire Detection and Characterization Algorithm FDCA.
GOES-16 “Red” Visible (0.64 µm, top left), Shortwave Infrared (3.9 µm, top right), Fire Power (bottom left) and Fire Temperature (bottom right) [click to play animated GIF | MP4]
——————————————————————————————————–
GOES-16 “Red” Visible (0.64 ) images, with time-matched SPC Storm Reports plotted in red [click to play animated GIF | MP4]
Finally, to the east and northeast across the central Plains, severe thunderstorms developed which produced several tornadoes, hail up to 4.00 inches in diameter and wind gusts to 91 mph — 1-minute GOES-16 Visible images (above) and Infrared images (below) include time-matched plots of SPC Storm Reports. One of the tornadoes caused EF-3 damage in Andover, Kansas (further discussed here).
GOES-16 “Clean” Infrared Window (10.35 ) images, with time-matched SPC Storm Reports plotted in blue [click to play animated GIF | MP4]
On 28 April, SPC’s convective outlook showed a small region of SLGT RSK over western Nebraska, with Marginal probabilities over most of Nebraska and Kansas (link to 2000 UTC outlook). The animation above shows hourly CAPE predictions from a 3-km version of the Rapid Refresh that is run hourly and initialized with Polar Hyperspectral... Read More
PHSnMWnABI CAPE estimates, 1700 UTC 28 April to 0300 UTC 29 April 2022 (Click to enlarge)
On 28 April, SPC’s convective outlook showed a small region of SLGT RSK over western Nebraska, with Marginal probabilities over most of Nebraska and Kansas (link to 2000 UTC outlook). The animation above shows hourly CAPE predictions from a 3-km version of the Rapid Refresh that is run hourly and initialized with Polar Hyperspectral Data (infrared and microwave, from Metop and from Suomi-NPP and NOAA-20) fused with GOES-16 ABI data, thereby using the strengths of ABI (fine spatial and temporal resolution) and Polar Hyperspectral Soundings (excellent spectral resolution). The animation above (a mix of initial fields — 1700 – 1900 UTC ; 1 – 4h forecasts from 1900 UTC; and 6-9h forecasts from 1800 UTC) shows CAPE developing over the High Plains and then rotating north into Kansas by 0300 UTC on 29 April 2022. A later forecast of CAPE, below, runs from 2100 UTC 28 April through 0600 UTC 29 April (showing initial fields at 2100/2200 UTC, then forecasts from 2200 UTC at 2300 UTC through 0400 UTC [i.e., 1-6h forecasts], followed by 8h and 9h forecasts from 2100 UTC on 0500 and 0600 UTC). By 0600 UTC, an axis of instability stretches from western Nebraska southeastward into central Kansas. The two forecasts show similar patterns.
PHSnMWnABI CAPE estimates, 2100 UTC 28 April to 0600 UTC 29 April 2022 (Click to enlarge)
The toggle below compares two forecasts for 0300 UTC, a 9-h forecast from 1800 UTC on 28 April, and a 5-h forecast from 2200 UTC on 28 April. The 5-h forecast is a bit less quick in moving the high CAPE values northward.
5-h and 9-h forecasts valid at 0300 UTC on 29 April 2022 (click to enlarge)
So, what happened? The toggle below compares the 6-h forecast from 2200 UTC, valid at 0400 UTC on 29 April, with the initial field for the 0400 UTC model run. As above, it appears that the forecast model from 2200 UTC was a bit too fast in moving the CAPE northward and eastward into Kansas/Nebraska. But overall there is very good agreement between the two fields.
PHSaABI CAPE at 0400 UTC 29 April 2022: a 6-h forecast from 2200 UTC 28 April 2022, and the initial field for the 0400 UTC model run (Click to enlarge)
The animation below shows PHSnABI CAPE fields hourly from 0400 – 0700 UTC (initial fields from 0400-0600; 1-h forecast at 0700), side by side with observed GOES-16 ABI Band 13 color-enhanced brightness temperatures. The convection that develops is along the edges of the CAPE; that is, it forms along the CAPE gradient in the model. Click here to view SPC Storm Reports from 28-29 April.
PHSnABI CAPE values, 0400-0700 UTC (left) and GOES-16 ABI Band 13 infrared (10.3 µm) imagery, 0401-0701 UTC 29 April 2022 (click to enlarge)
The animation below shows ABI Infrared Imagery overlain on top of the forecast CAPE field. This drives home to point that convection on this day occurred where the gradient of CAPE was outlined/predicted by this forecast model.
PHSnABI CAPE fields overlain with GOES-16 Infrared ABI Band 13 (10.3 µm) imagery, 0800-1200 UTC on 29 April 2022 (Click to enlarge)
PHSnABI data will be demonstrated at the Hazardous Weather Testbed in late May/Early June. Model output is available outside of AWIPS at this website. To view more blog posts on this project, click the ‘Hyperspectral’ tag below.


