Hurricane Marie in the East Pacific Ocean
![GOES-17 “Red” Visible (0.64 µm) and “Clean” Infrared Window (10.35 µm) images [click to play animation | MP4]](https://cimss.ssec.wisc.edu/satellite-blog/images/2020/10/201002_goes17_visible_infrared_Hurricane_Marie_anim.gif)
GOES-17 “Red” Visible (0.64 µm) and “Clean” Infrared Window (10.35 µm) images [click to play animation | MP4]
GOES-17 Infrared Window (11.2 µm) images from the CIMSS Tropical Cyclones site (below) indicated that Marie was moving through an environment of relatively low deep-layer wind shear.
![GOES-17 Infrared Window (11.2 µm) images, with an overlay of deep-layer wind shear [click to enlarge]](https://cimss.ssec.wisc.edu/satellite-blog/images/2020/10/201002_goes17_infrared_shear_Marie_anim.gif)
GOES-17 Infrared Window (11.2 µm) images, with an overlay of deep-layer wind shear [click to enlarge]
===== 03 October Update =====
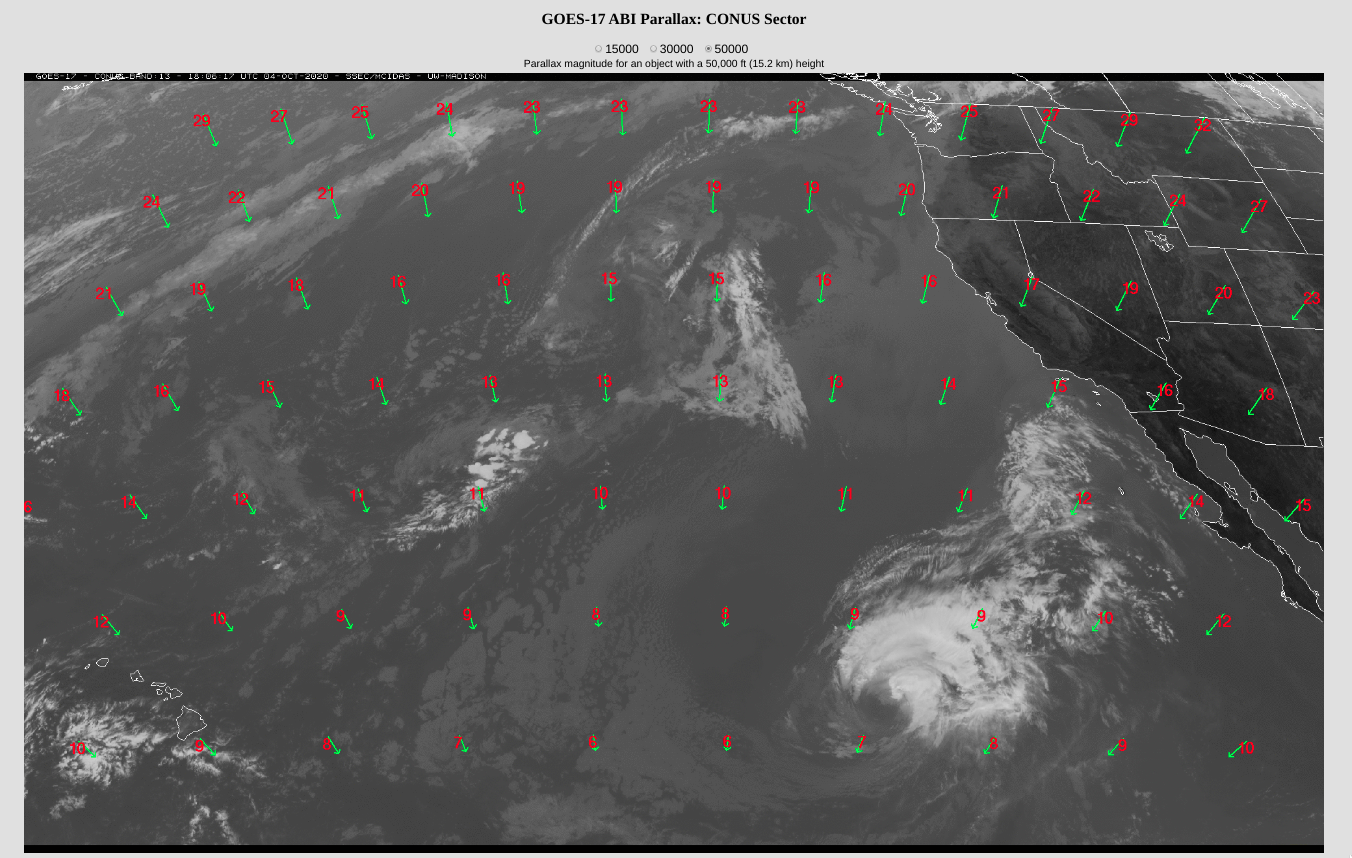
A toggle between time-matched Infrared Window images of the eye and eyewall region of Hurricane Marie from Suomi NPP (SNPP) and GOES-17 (below) highlighted the differences in spatial resolution — 375-m with SNPP VIIRS, vs 2-km (at satellite sub-point) with GOES-17 ABI — and the parallax displacement inherent with GOES-17 imagery at that location (approximately 9 km to the northeast). The coldest cloud-top infrared brightness temperature was -85.4ºC on the SNPP image, compared to -81.8ºC on the GOES-17 image; small-scale features such as the gravity waves propagating radially outward from the eye were seen in the higher resolution SNPP image. Note: the 0929 UTC time stamp on the SNPP image was the time that the ground station antenna began receiving the descending overpass signal – the satellite actually passed over Marie’s location at 0943 UTC.
![Infrared Window images from Suomi NPP (11.45 µm) and GOES-17 (10.35 µm) [click to enlarge]](https://cimss.ssec.wisc.edu/satellite-blog/images/2020/10/201003_0943utc_suomiNPP_goes17_infrared_Hurricane_Marie_anim.gif)
Infrared Window images from Suomi NPP (11.45 µm) and GOES-17 (10.35 µm) [click to enlarge]