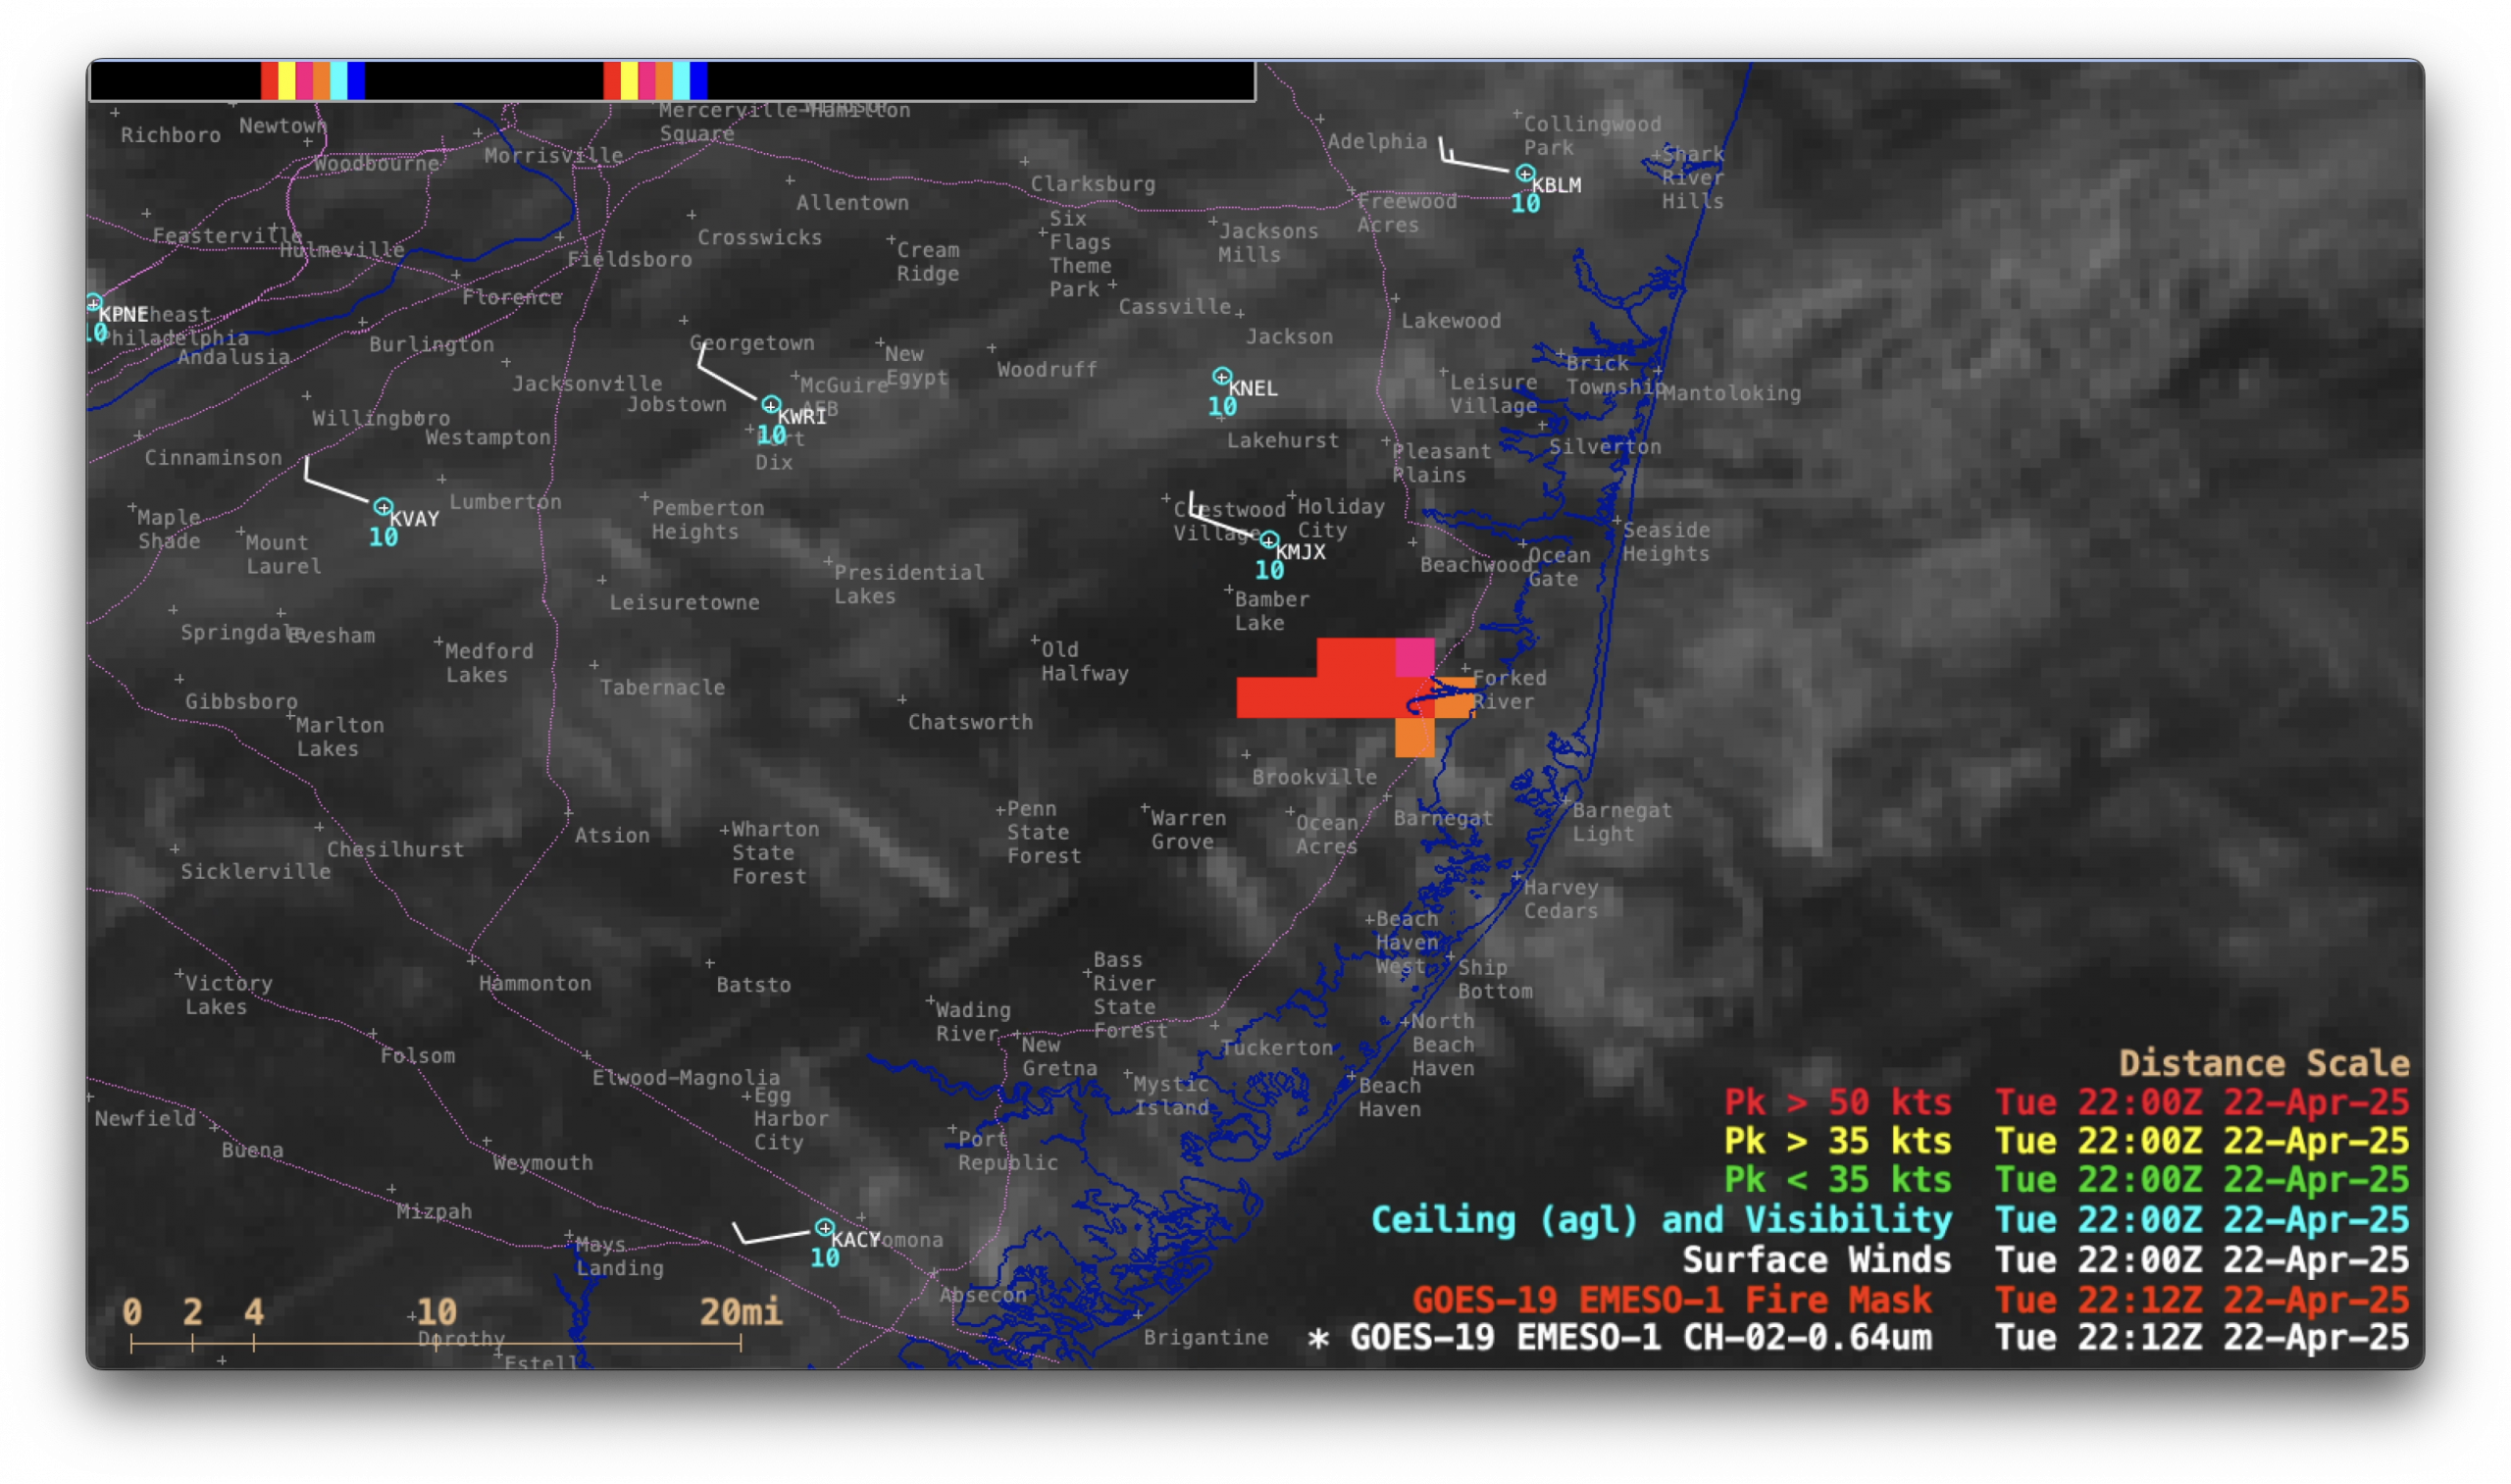
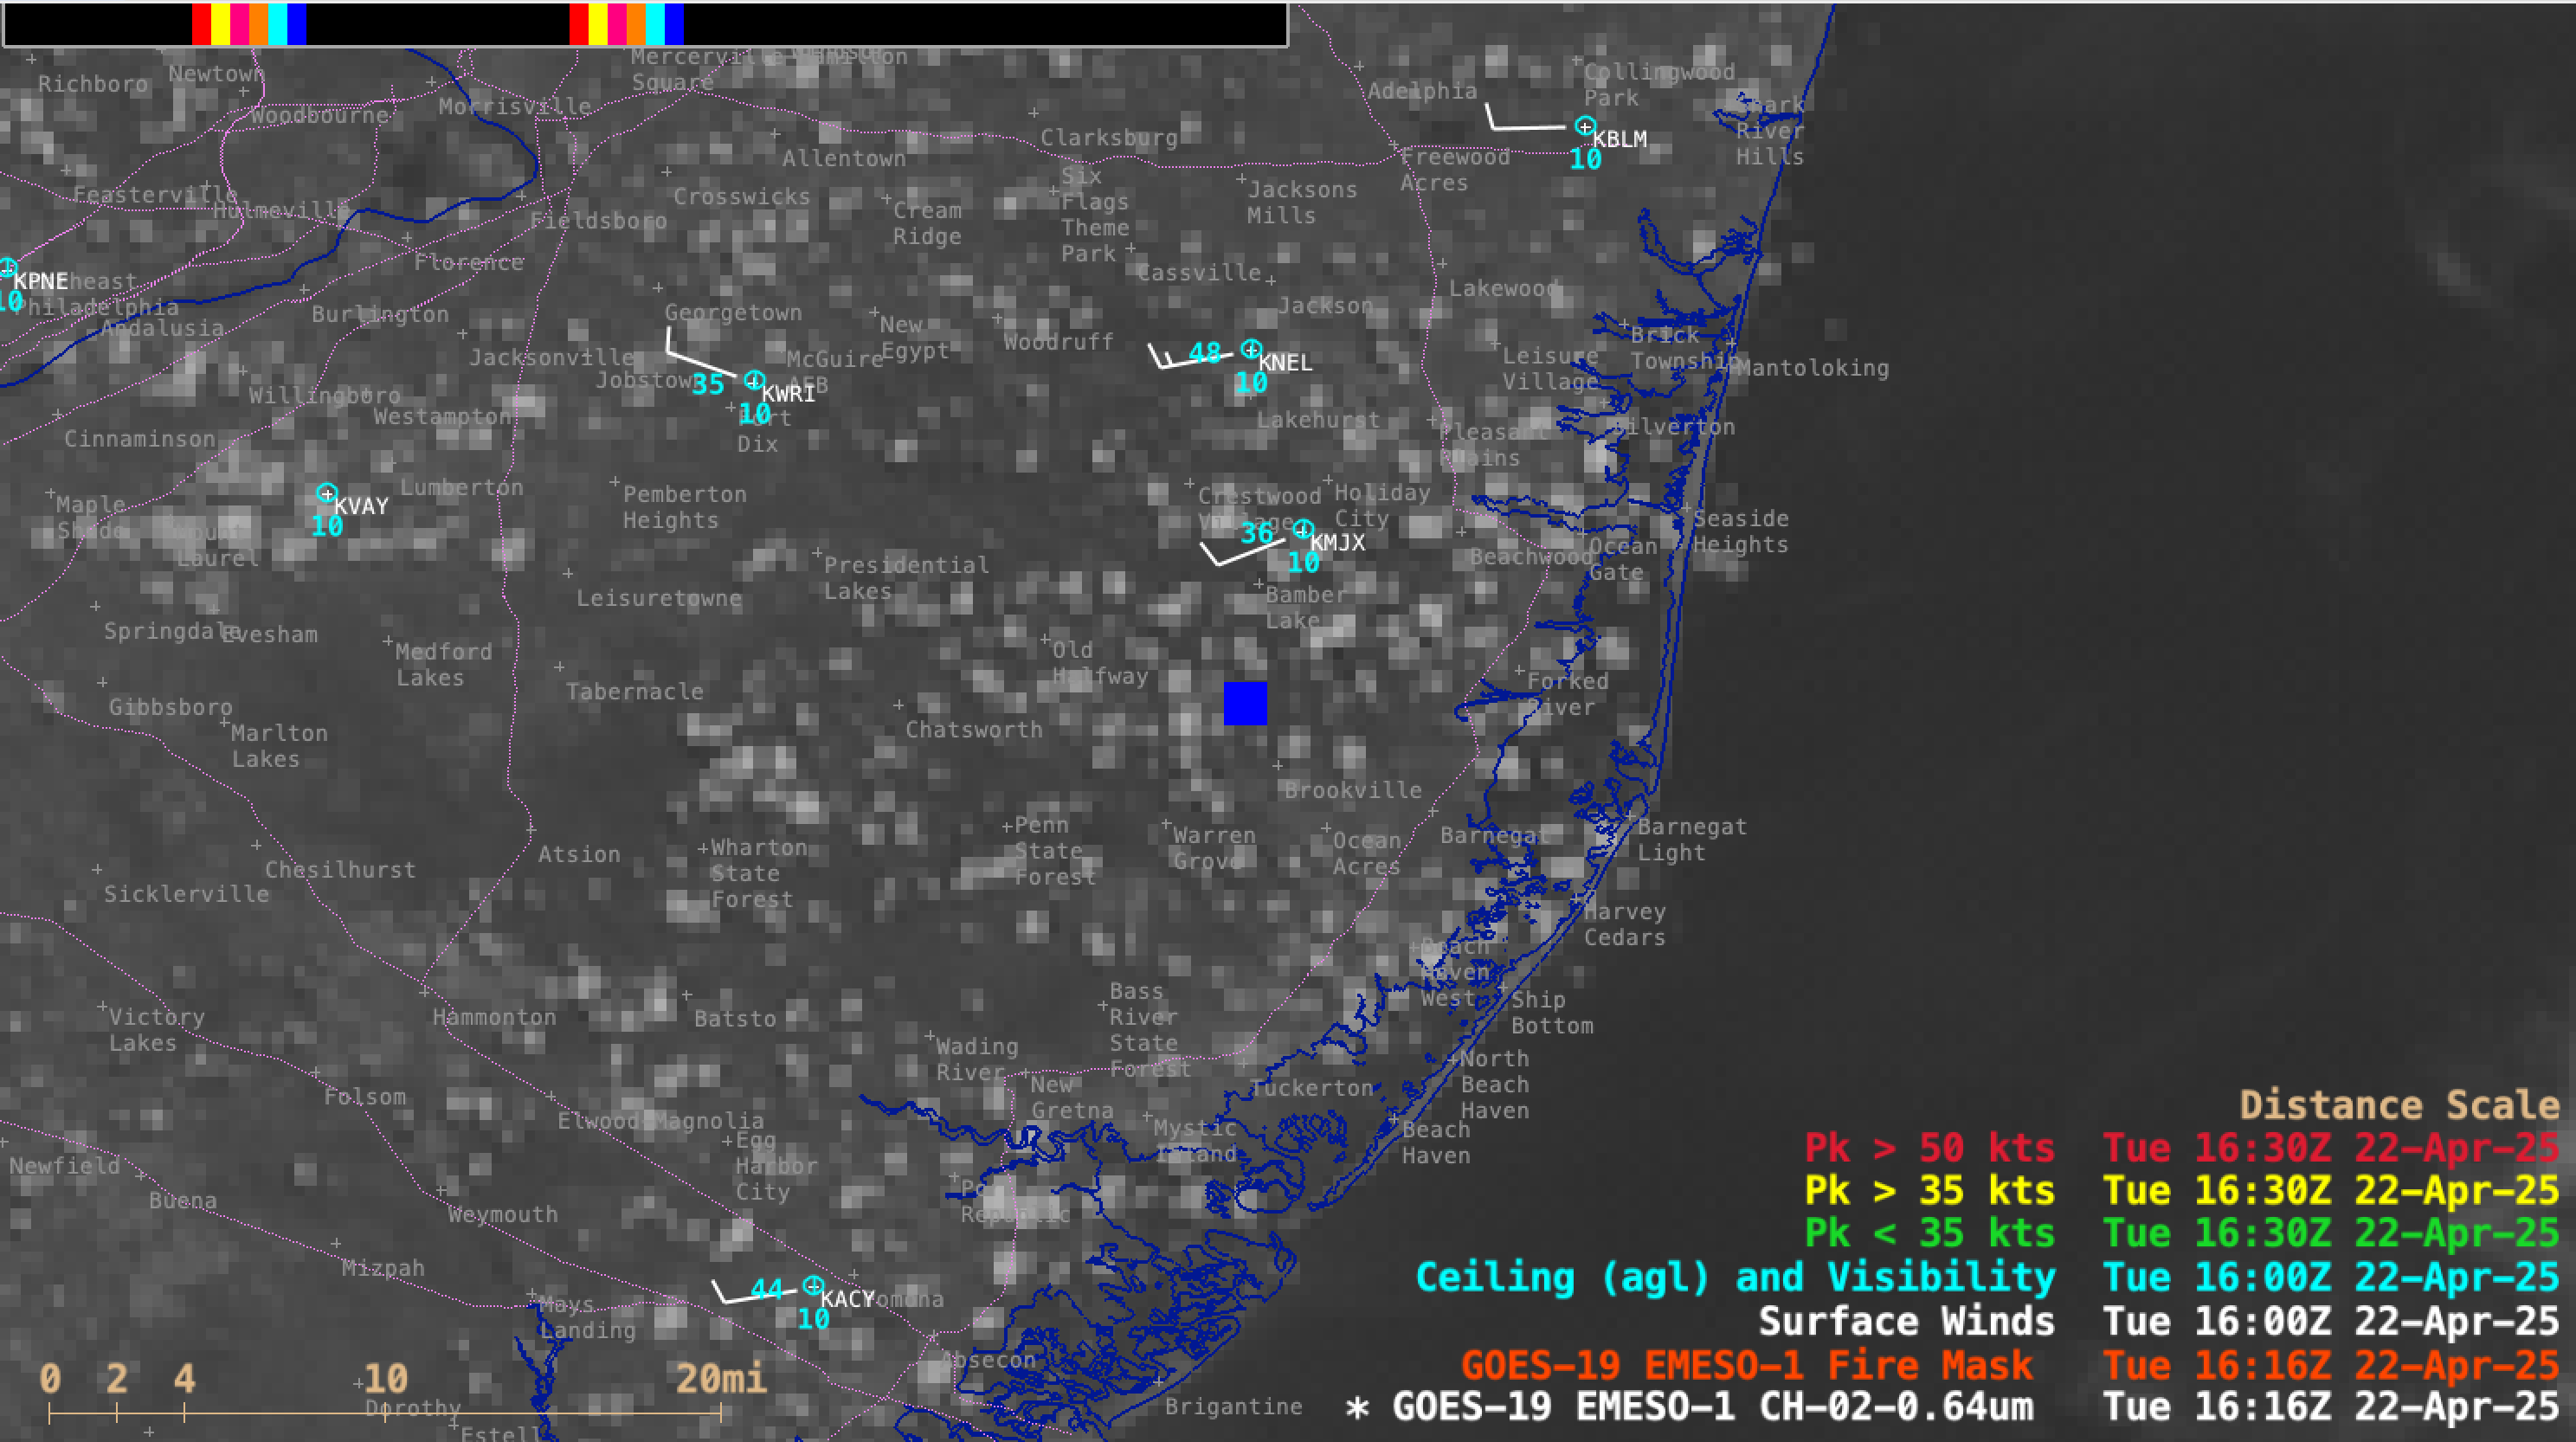
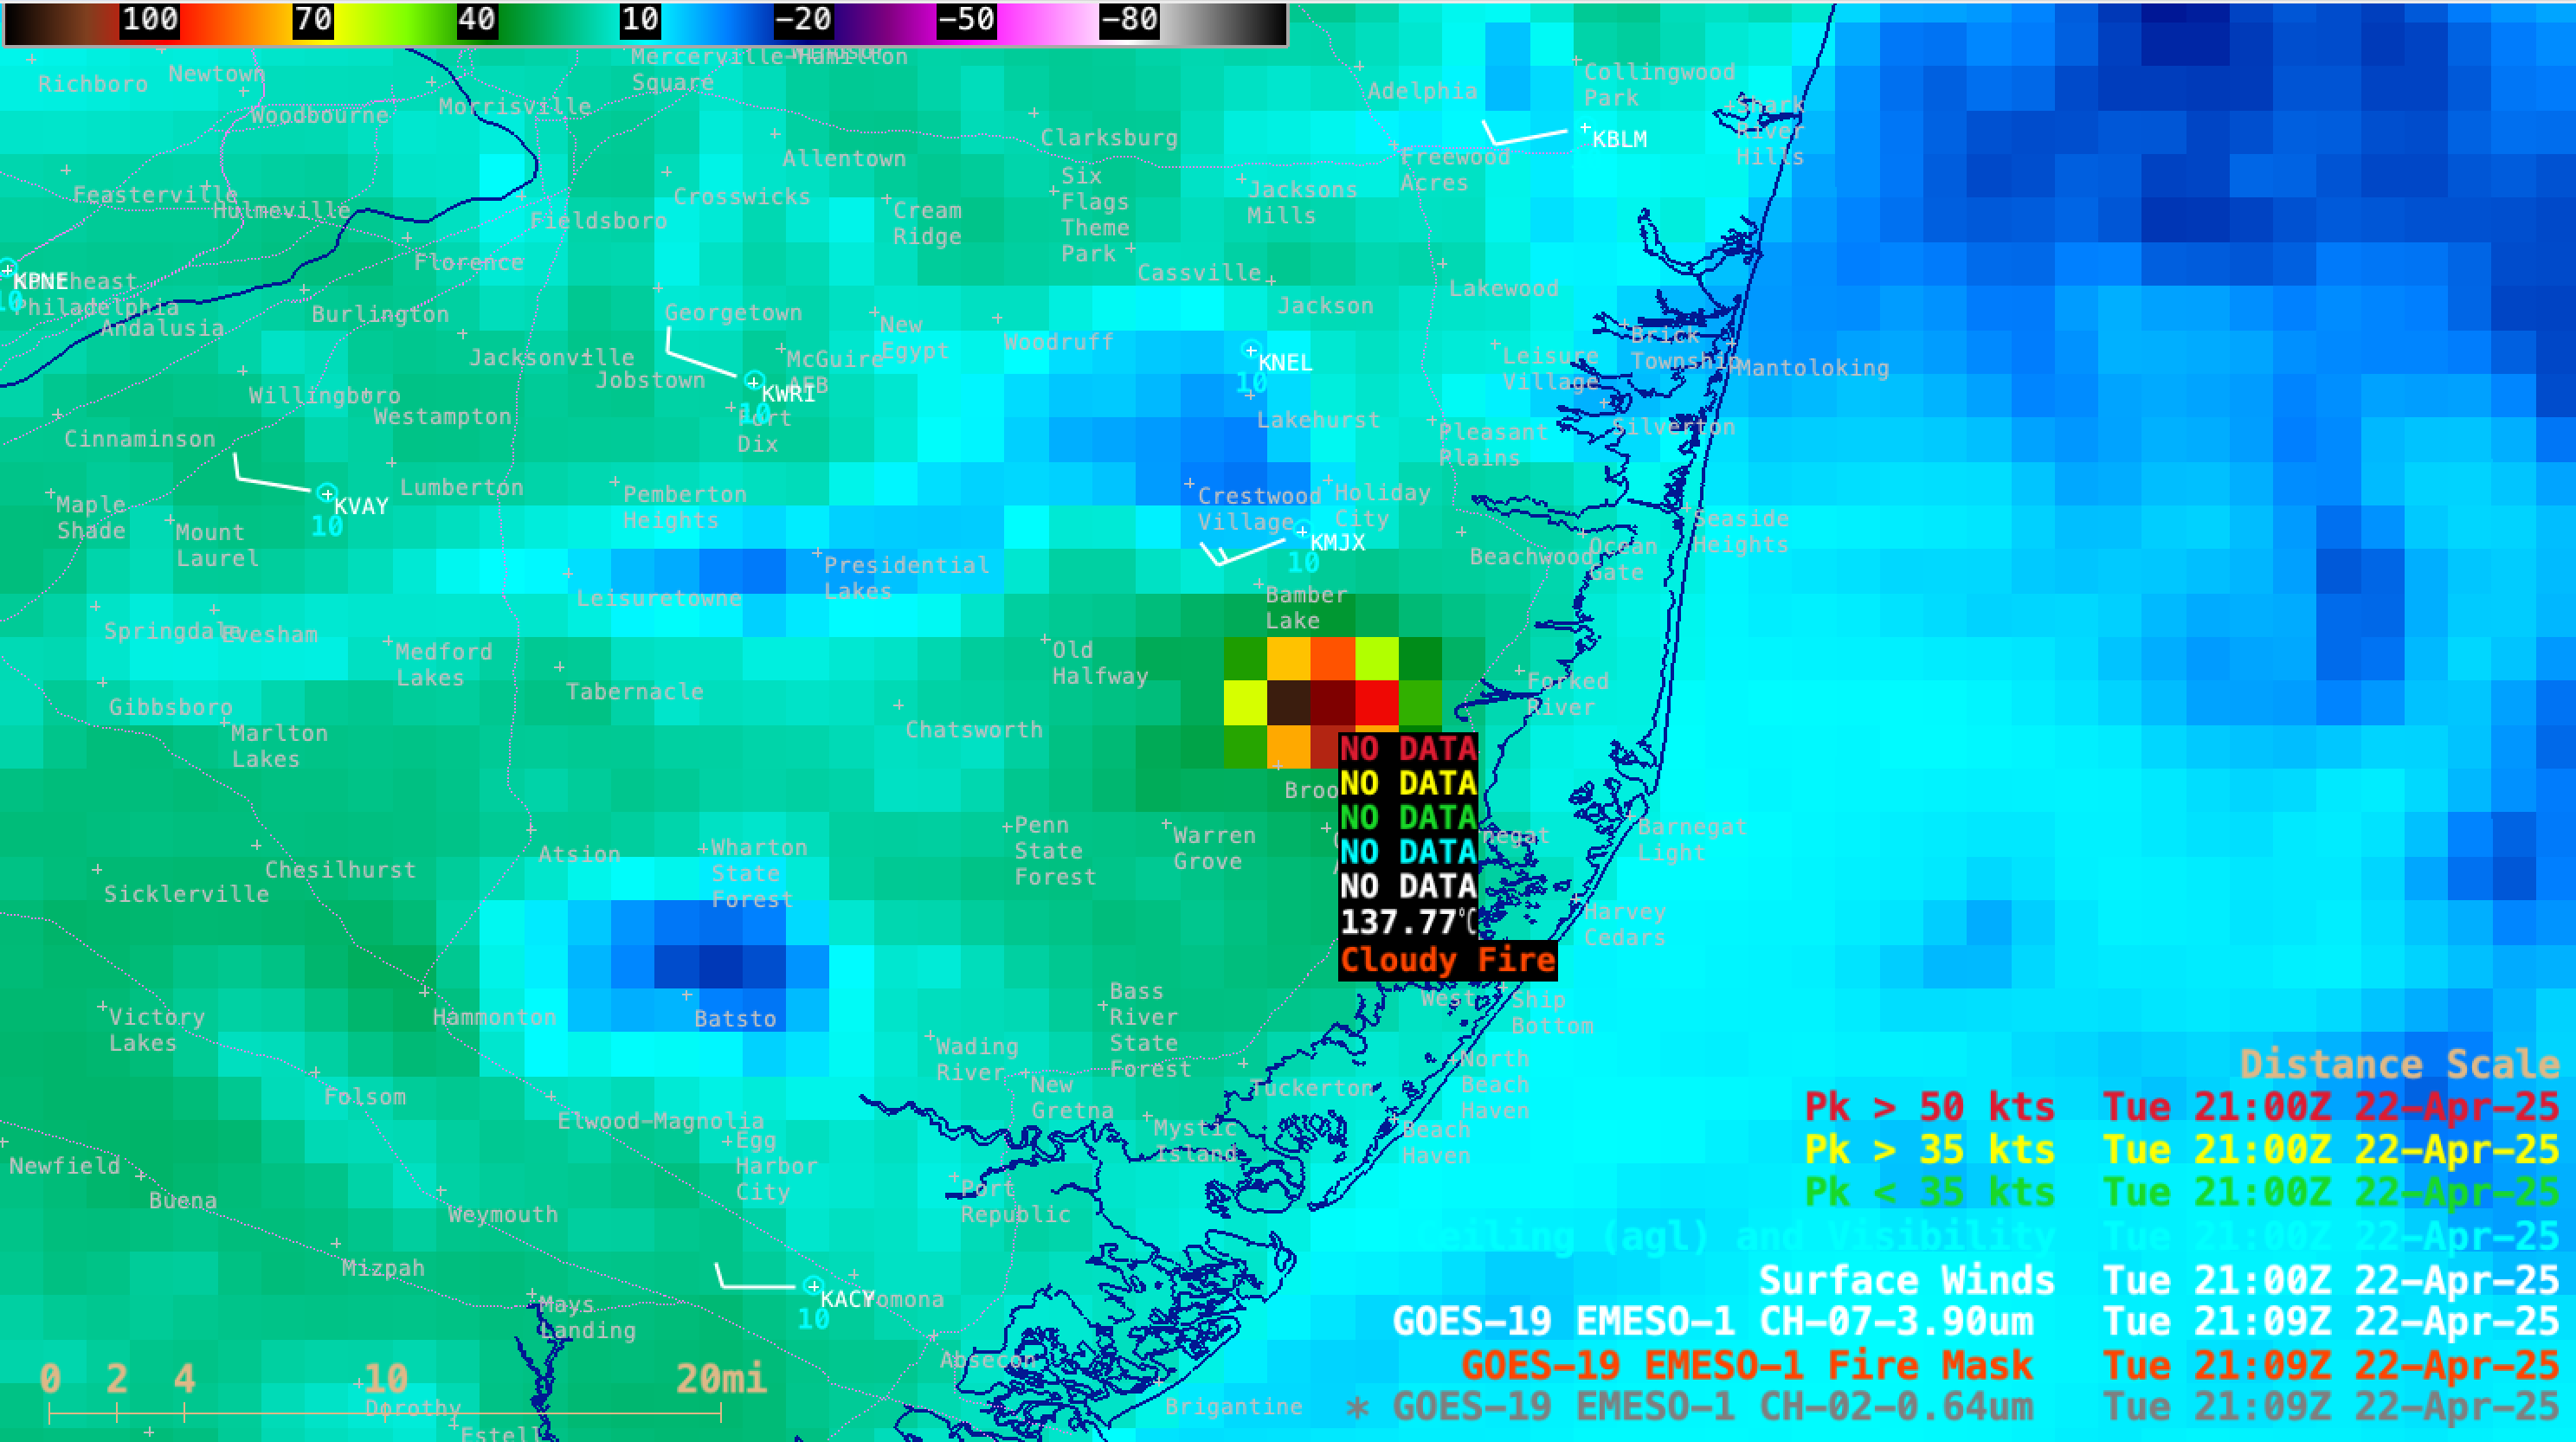
1-minute Mesoscale Domain Sector GOES-19 (GOES-East) Visible images with an overlay of the Fire Detection and Characterization Algorithm (FDCA) Fire Mask derived product (above) displayed the rapid growth and movement of the Jones Road Wildfire in eastern New Jersey on 22 April 2025. The initial GOES-19 FDCA fire detection occurred at 1616 UTC. In addition, the maximum... Read More
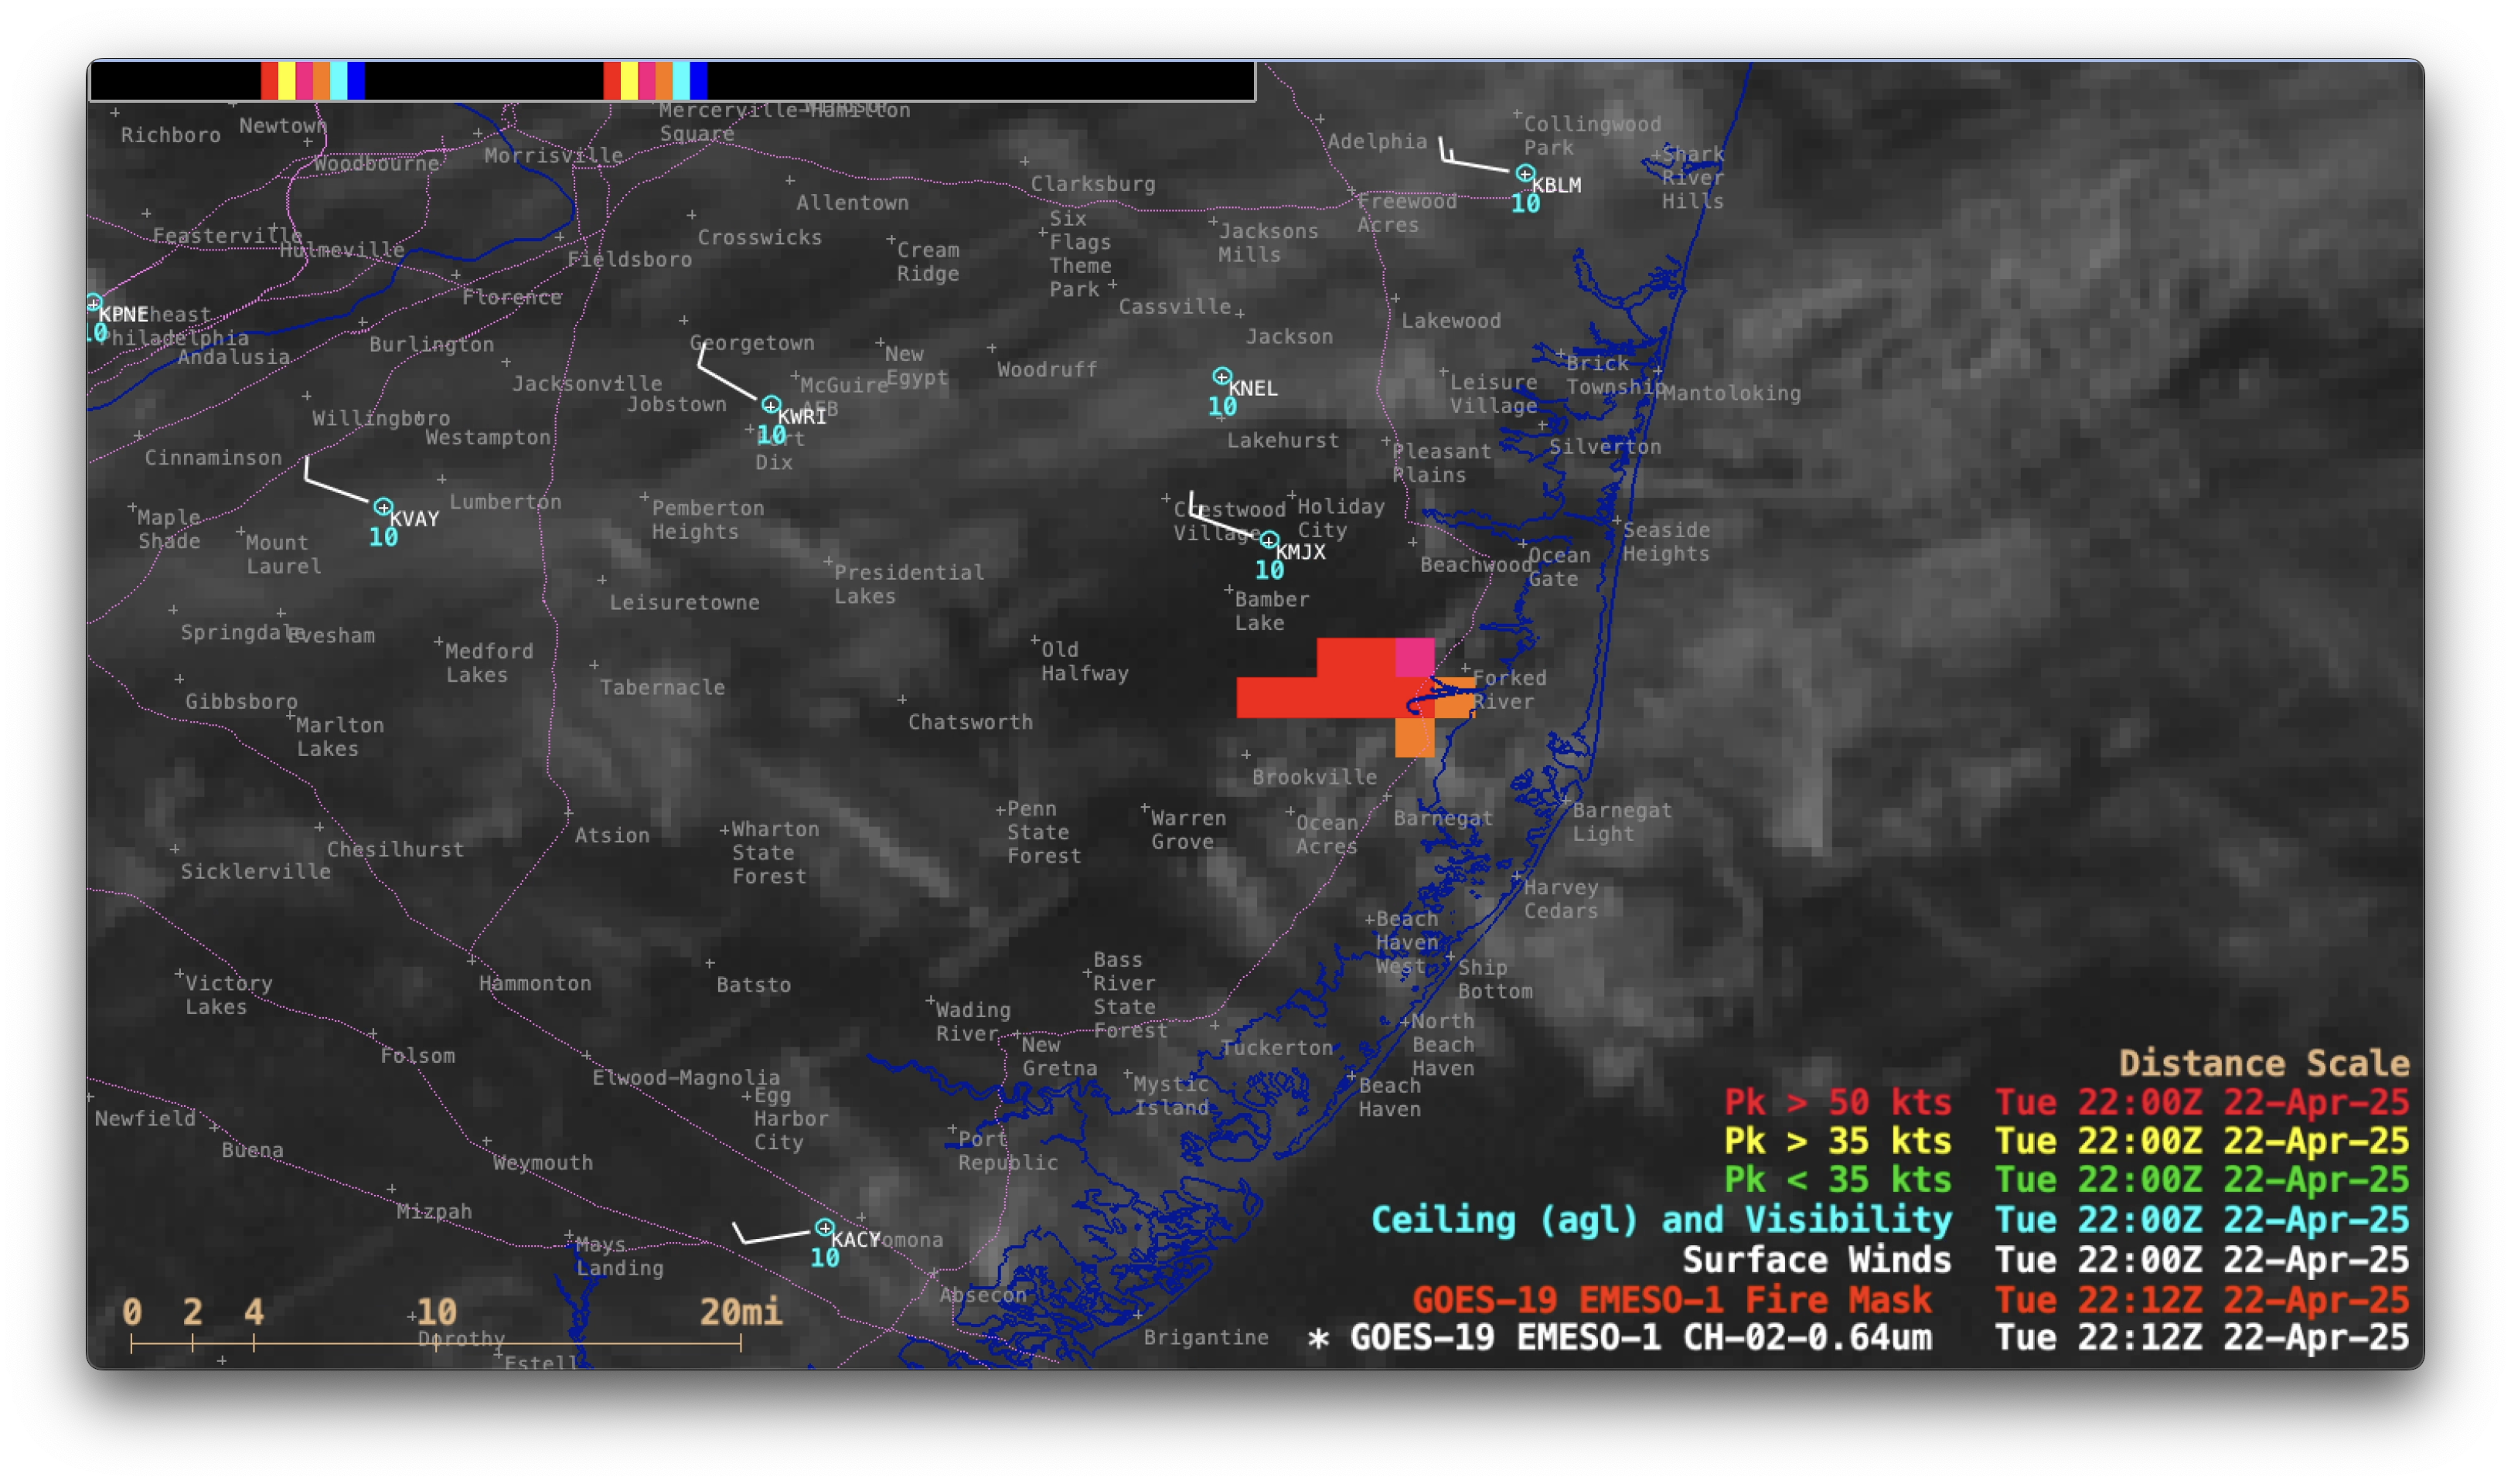
1-minute GOES-19 Visible images with an overlay of the GOES-19 Fire Mask derived product, from 1600-2259 UTC on 22 April; Highways are plotted in dotted magenta [click to play MP4 animation]
1-minute Mesoscale Domain Sector GOES-19
(GOES-East) Visible images with an overlay of the
Fire Detection and Characterization Algorithm (FDCA) Fire Mask derived product
(above) displayed the rapid growth and movement of the Jones Road Wildfire in eastern New Jersey on
22 April 2025. The initial GOES-19 FDCA fire detection occurred at
1616 UTC. In addition, the maximum 3.9 µm infrared brightness temperature reached 137.77ºC — the saturation temperature of GOES-19 ABI Band 7 detectors — for several minutes beginning at
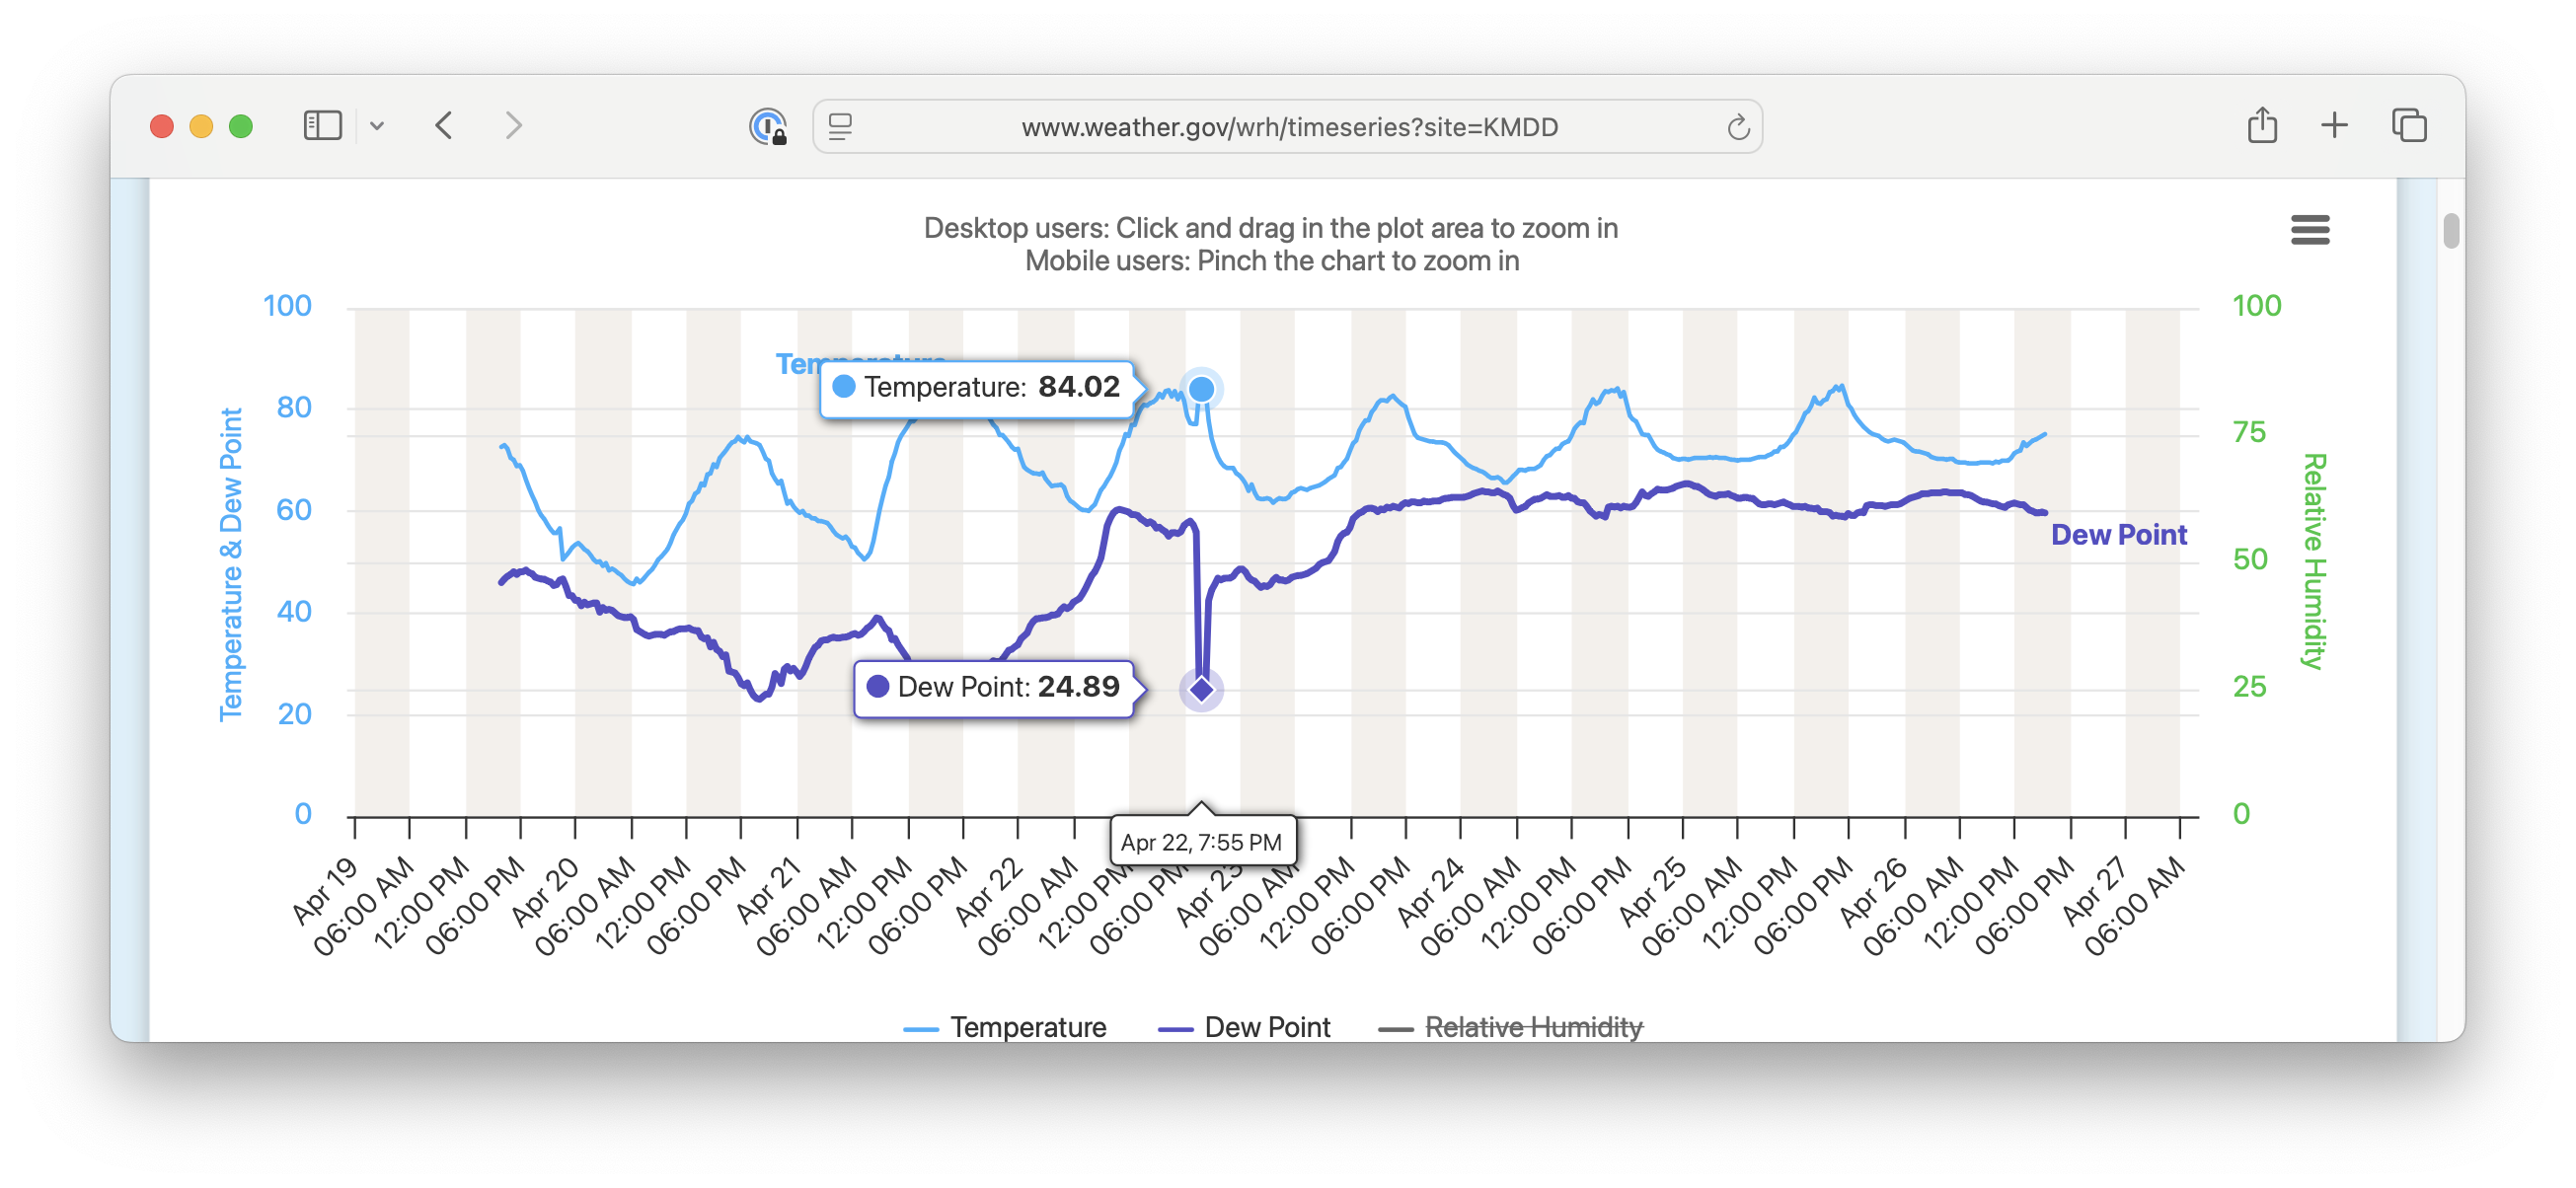
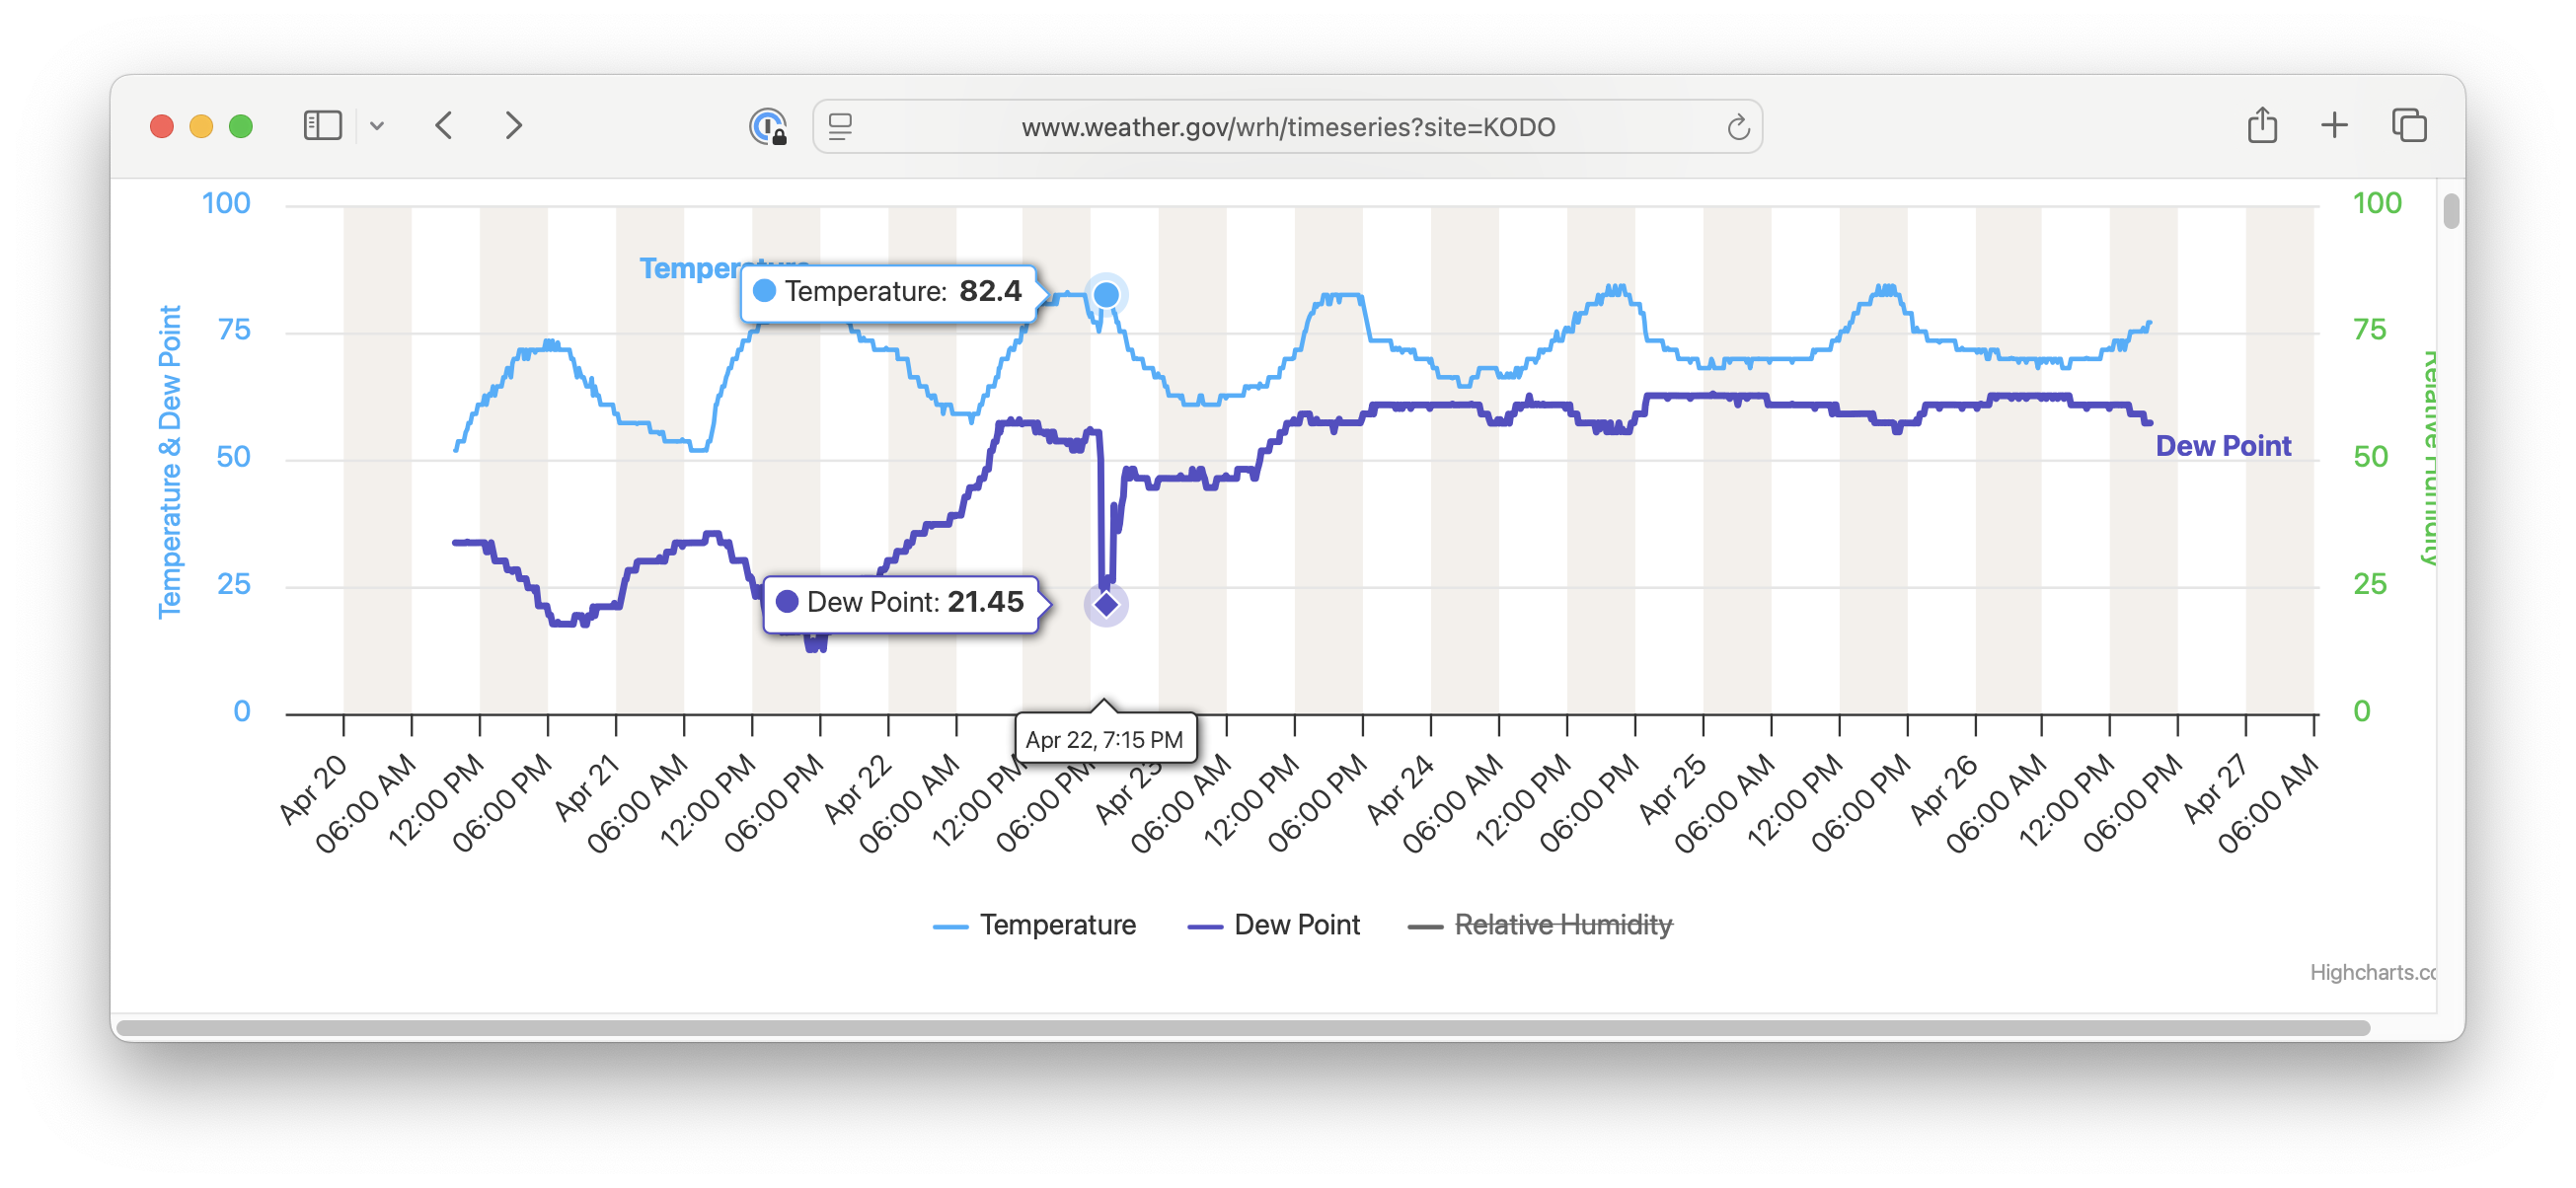
2109 UTC. Just north of the wildfire, westerly winds at Toms River (
KMJX) occasionally gusted to 18 kts (21 mph) in the wake of a
cold frontal passage, which likely played a role in the rapid eastward run of the fire toward the Garden State Parkway (that was subsequently closed to traffic for most of the following overnight hours, as the fire jumped the Parkway). Note that the dense cirrus clouds drifting over the area occasionally attenuated the fire signature enough to prevent FDCA Fire Mask detections.
In contrast, the more sensitive GOES-19 Next Generation Fire System (NGFS) (below) consistently displayed a fire signature every minute during the same 7-hour period as the FDCA shown above (in spite of the dense cirrus clouds moving overhead). The initial NGFS fire detection occurred at 1617 UTC. In addition to closure of a portion of the Garden State Parkway and a few other roads, evacuation orders were issued for approximately 5000 residents.

1-minute GOES-19 GeoColor RGB images with an overlay of GOES-19 NGFS Fire Detection polygons, from 1600-2259 UTC on 22 April [click to play MP4 animation]
=====
The fire continued burning overnight, followed by an increase in intensity during the morning/afternoon hours on 23 April (below). As a sea breeze began to advance inland, the transition to southeast winds transported some of the wildfire smoke north/northwestward — and the visibility dropped as low as 2.5 miles at Toms River KMJX and Lakehurst Naval Air Station KNEL. As a result of this smoke, Air Quality Alerts were issued for parts of eastern New Jersey.
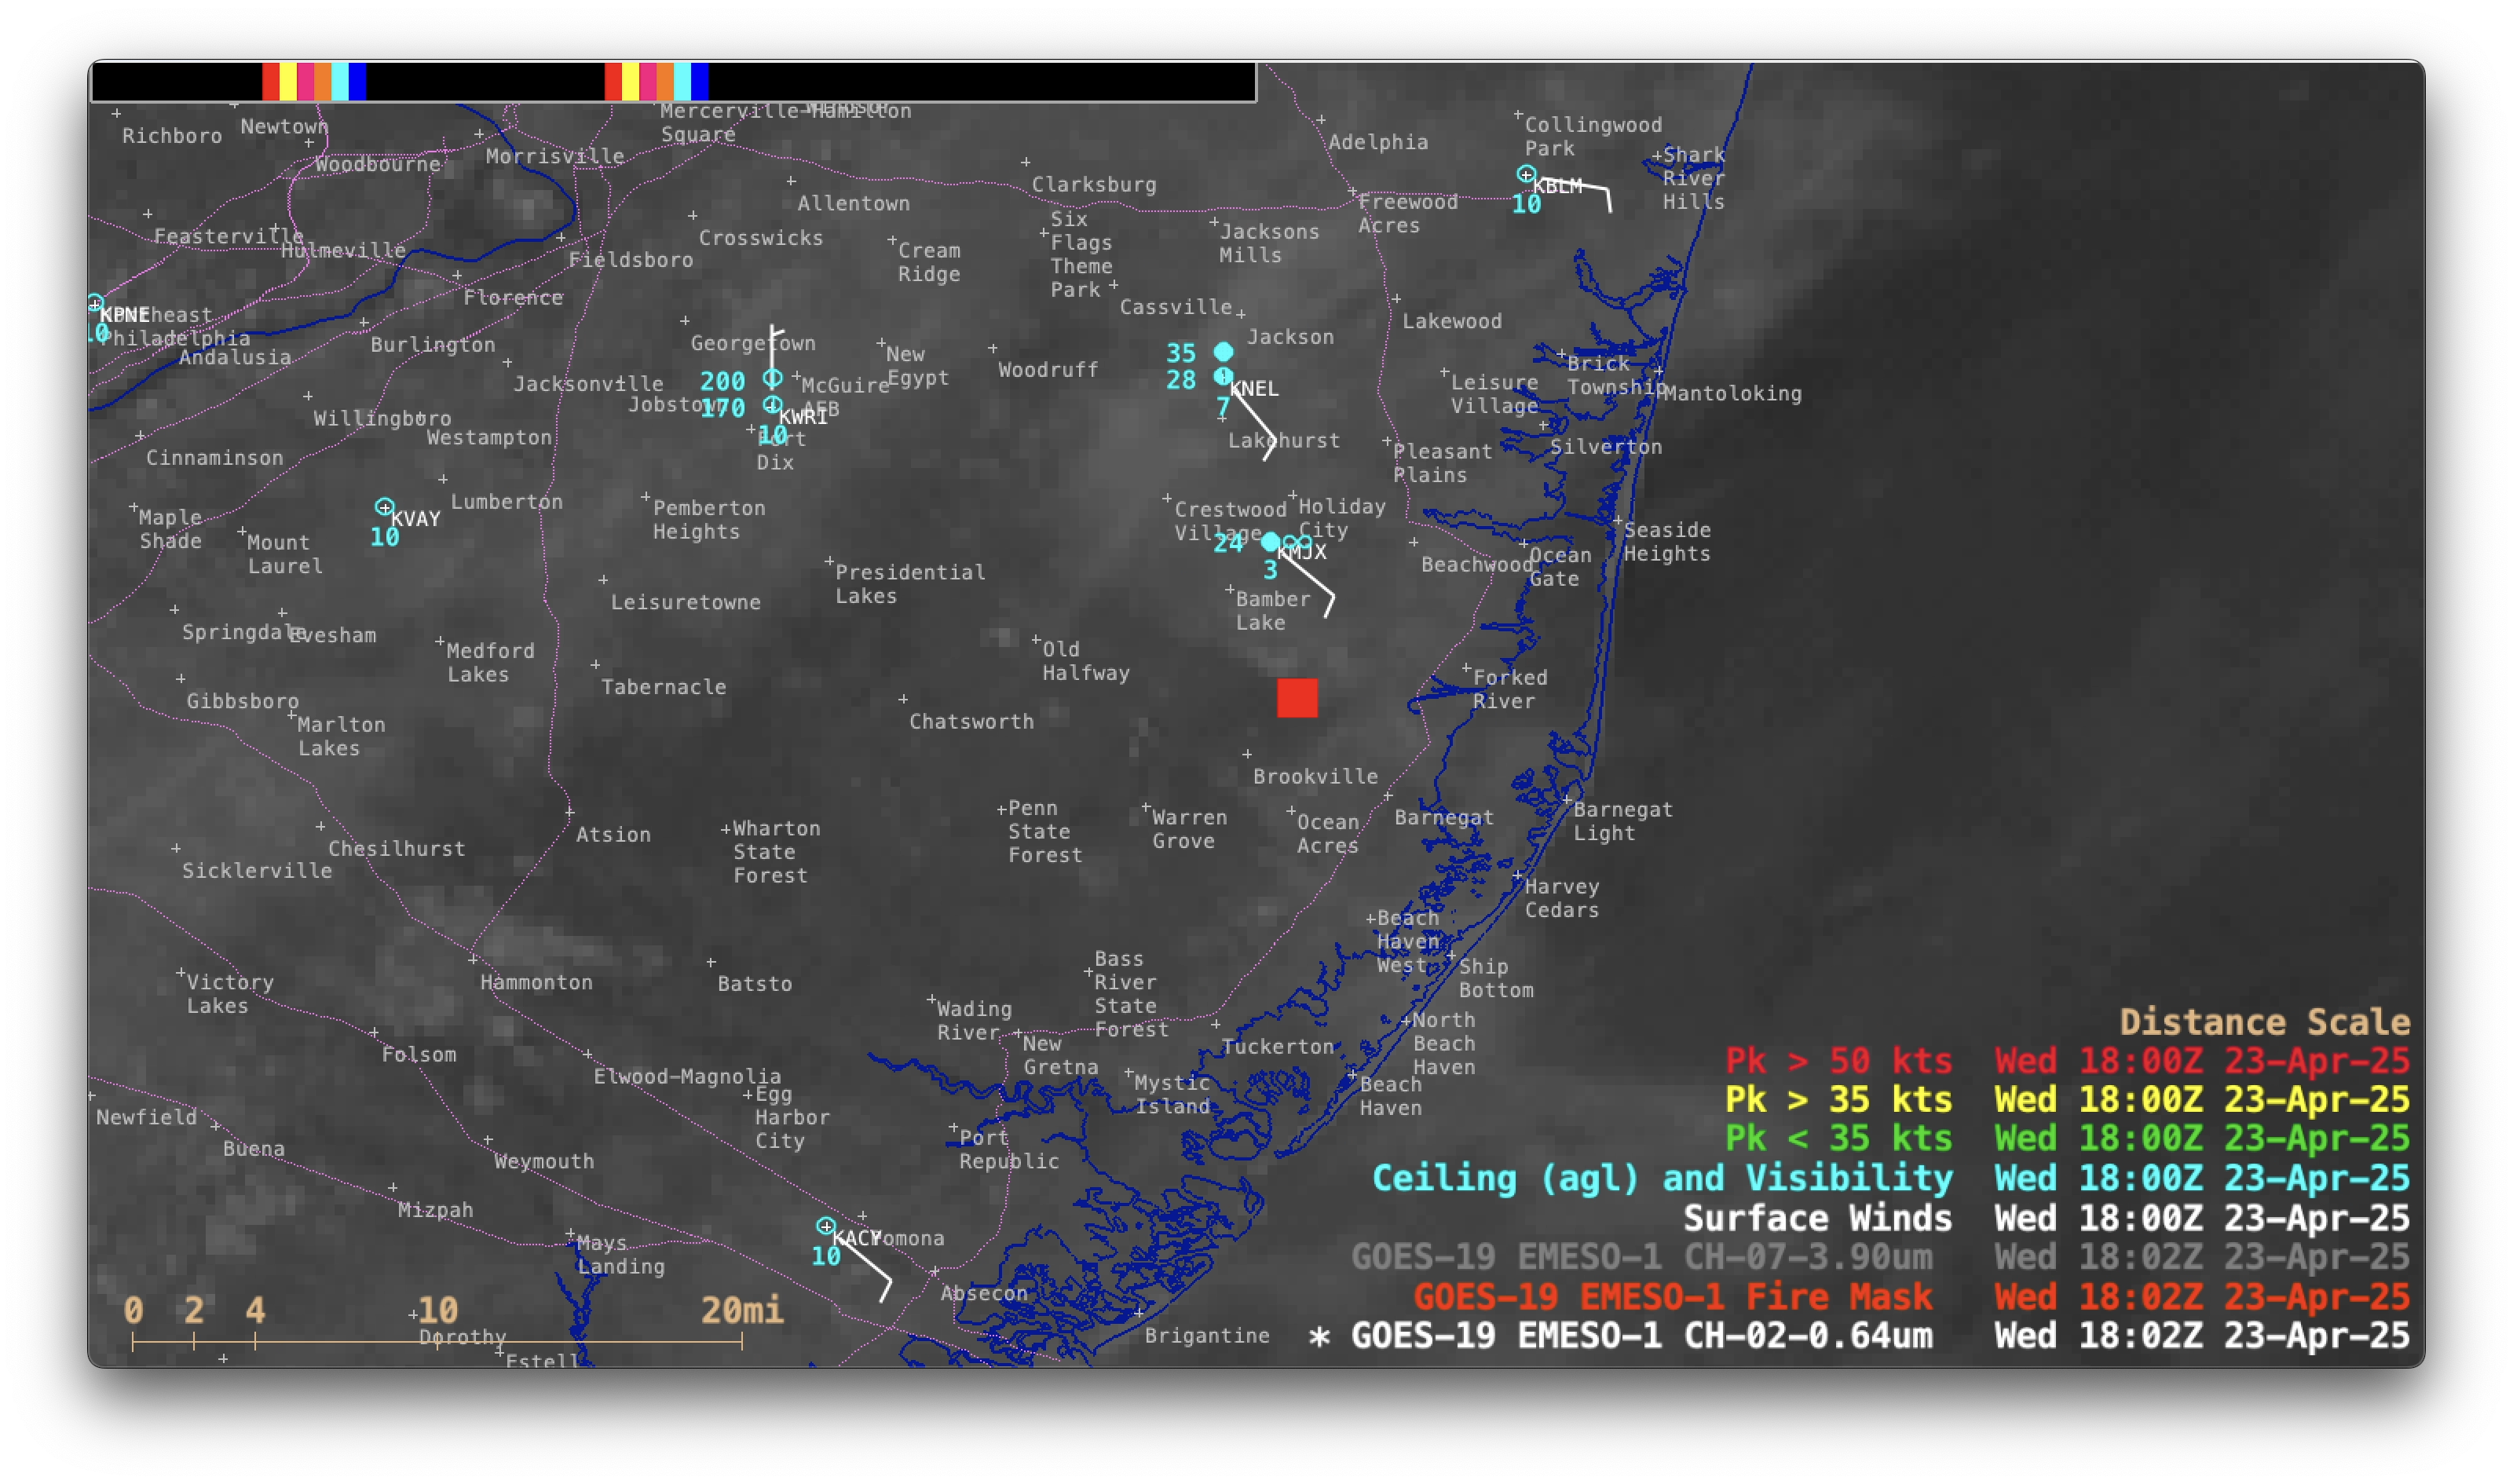
1-minute GOES-19 Visible images with an overlay of the GOES-19 Fire Mask derived product, from 1201-1900 UTC on 23 April [click to play MP4 animation]
A 30-meter resolution Landsat-9 “Natural Color” RGB image from the
RealEarth site
(below) revealed the areal coverage of the Jones Road Wildfire burn scar (darker shades of brown), along with a few areas of ongoing fire activity (brighter shades of pink/red).

Landsat-9 “Natural Color” RGB image at 1539 UTC on 23 April [click to enlarge]
=====
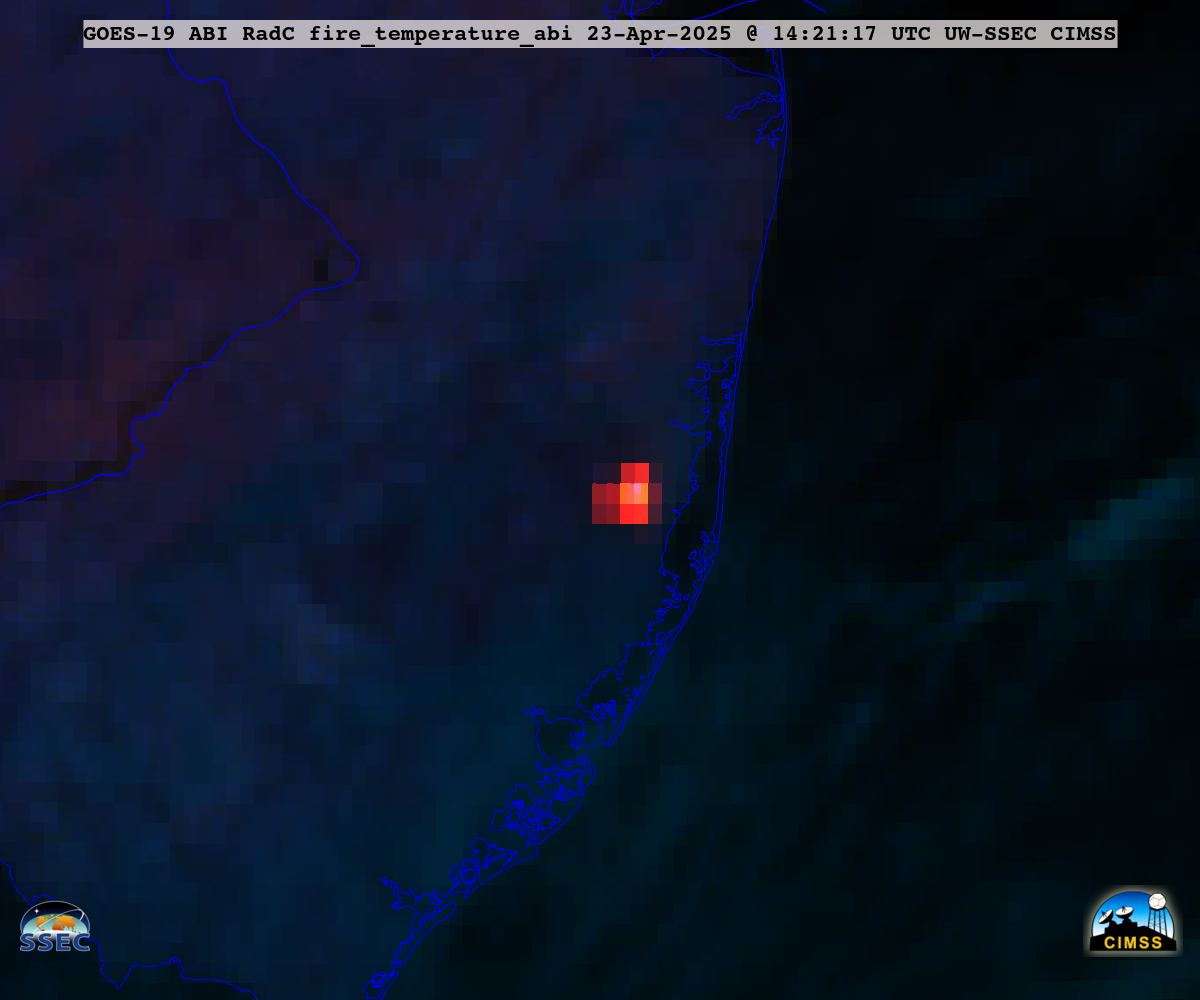
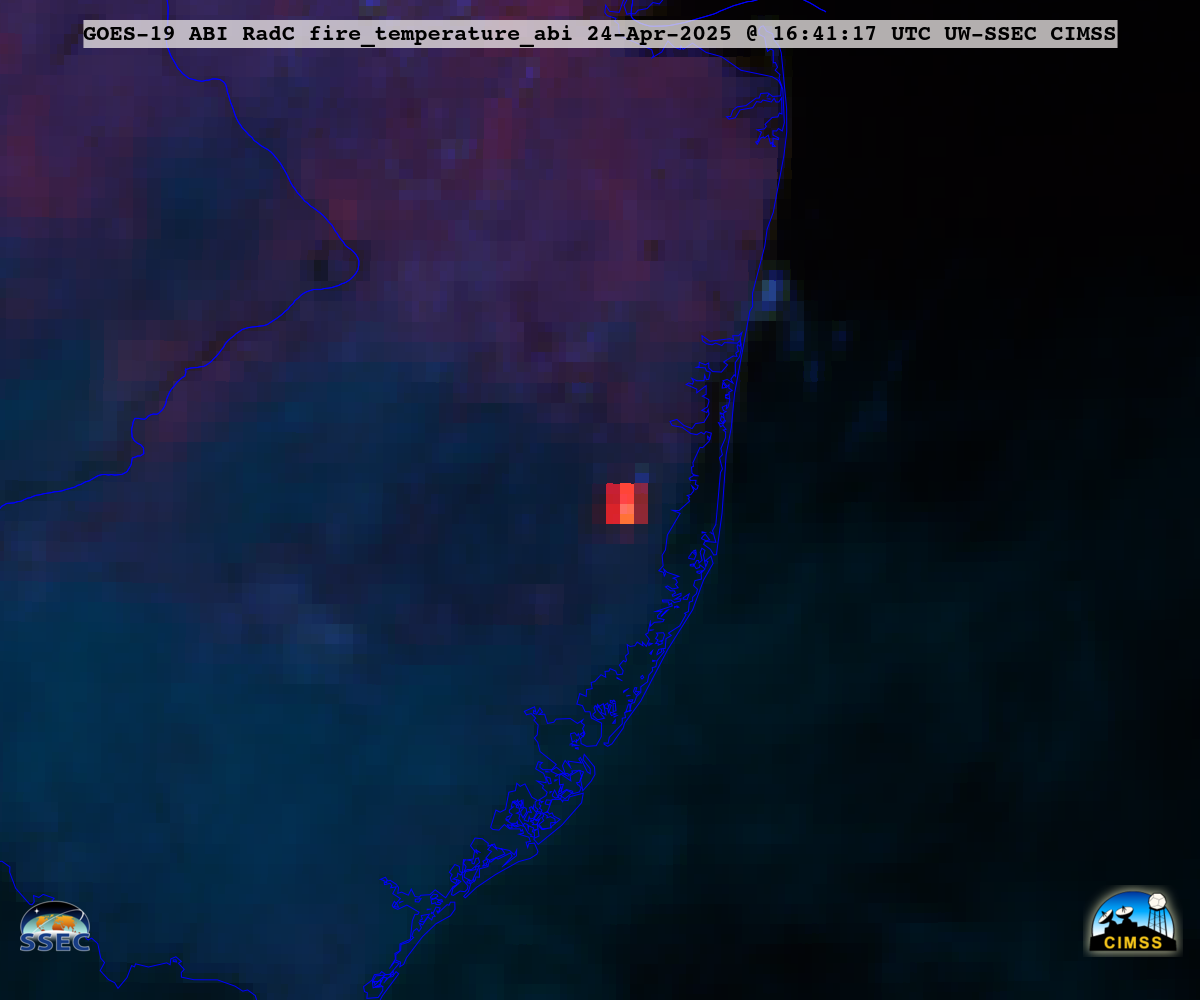
In a 2-day animation of GOES-19 Fire Temperature RGB images created using Geo2Grid (below), the thermal signature (shades of red to bright yellow) was very pronounced during the day on 22 April (2116 UTC image) as wildfire rapidly grew and spread eastward — and again during the first half of the day on 23 April (1421 UTC image), before becoming more subdued later in the day as fire suppression efforts increased containment. The thermal signature was relatively subtle during the day on 24 April, except for one brief flare-up in the early afternoon (1641 UTC image).
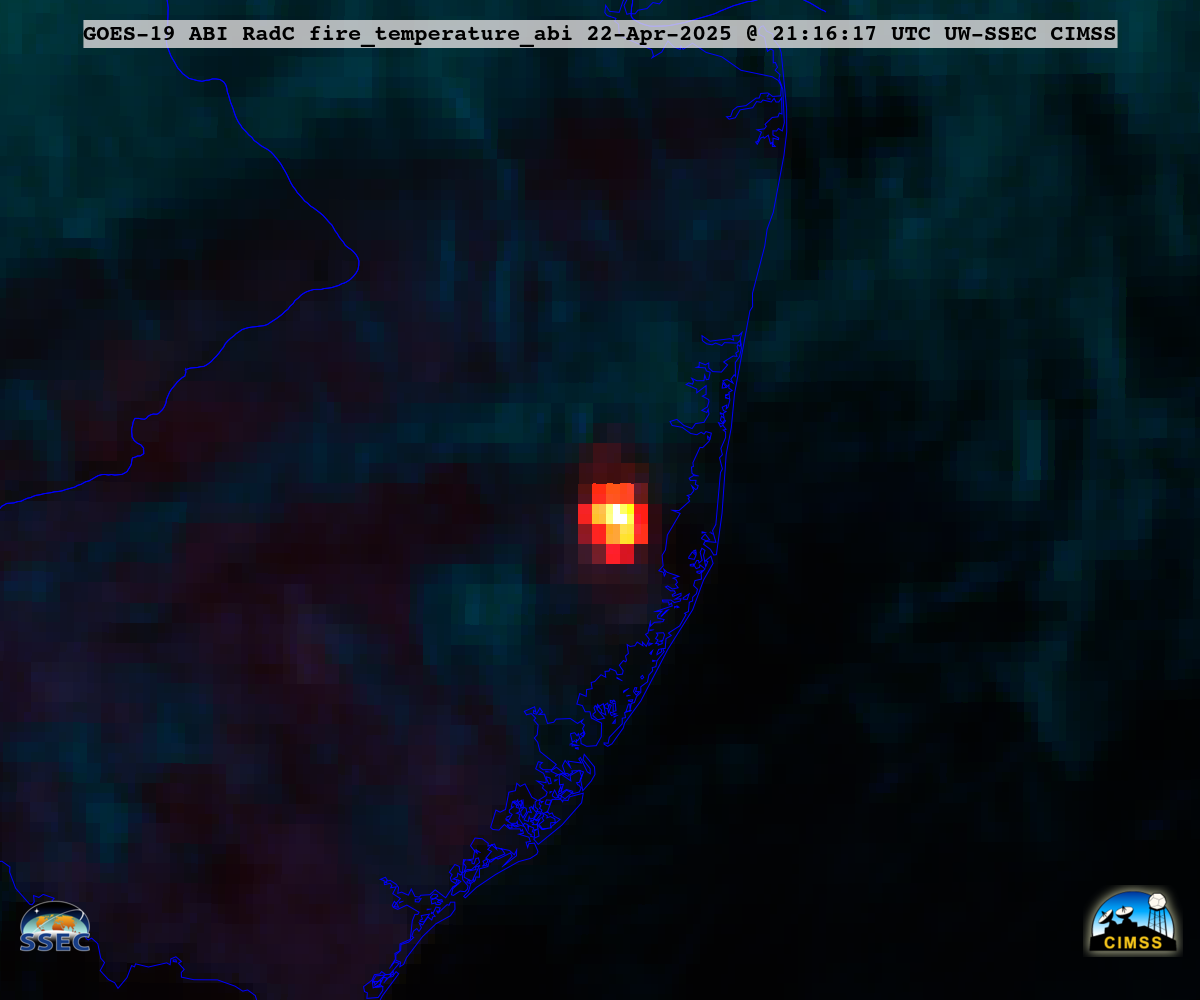
5-minute GOES-19 Fire Temperature RGB images, from 1601 UTC on 22 April to 1716 UTC on 24 April [click to play animated GIF | MP4]
View only this post
Read Less


