This website works best with a newer web browser such as Chrome, Firefox, Safari or Microsoft Edge. Internet Explorer is not supported by this website.

Typhoon Tiffany makes landfall in Australia

JMA Himawari-8 Visible (0.64 µm) images (above) showed Tropical Cyclone Tiffany as it made landfall along the eastern coast of the Cape York Peninsula in Queensland, Australia on 09 January 2022. [UPDATE: just prior to making landfall around 0130 UTC on 10 January, Tiffany intensified to a Category 1 typhoon... Read More

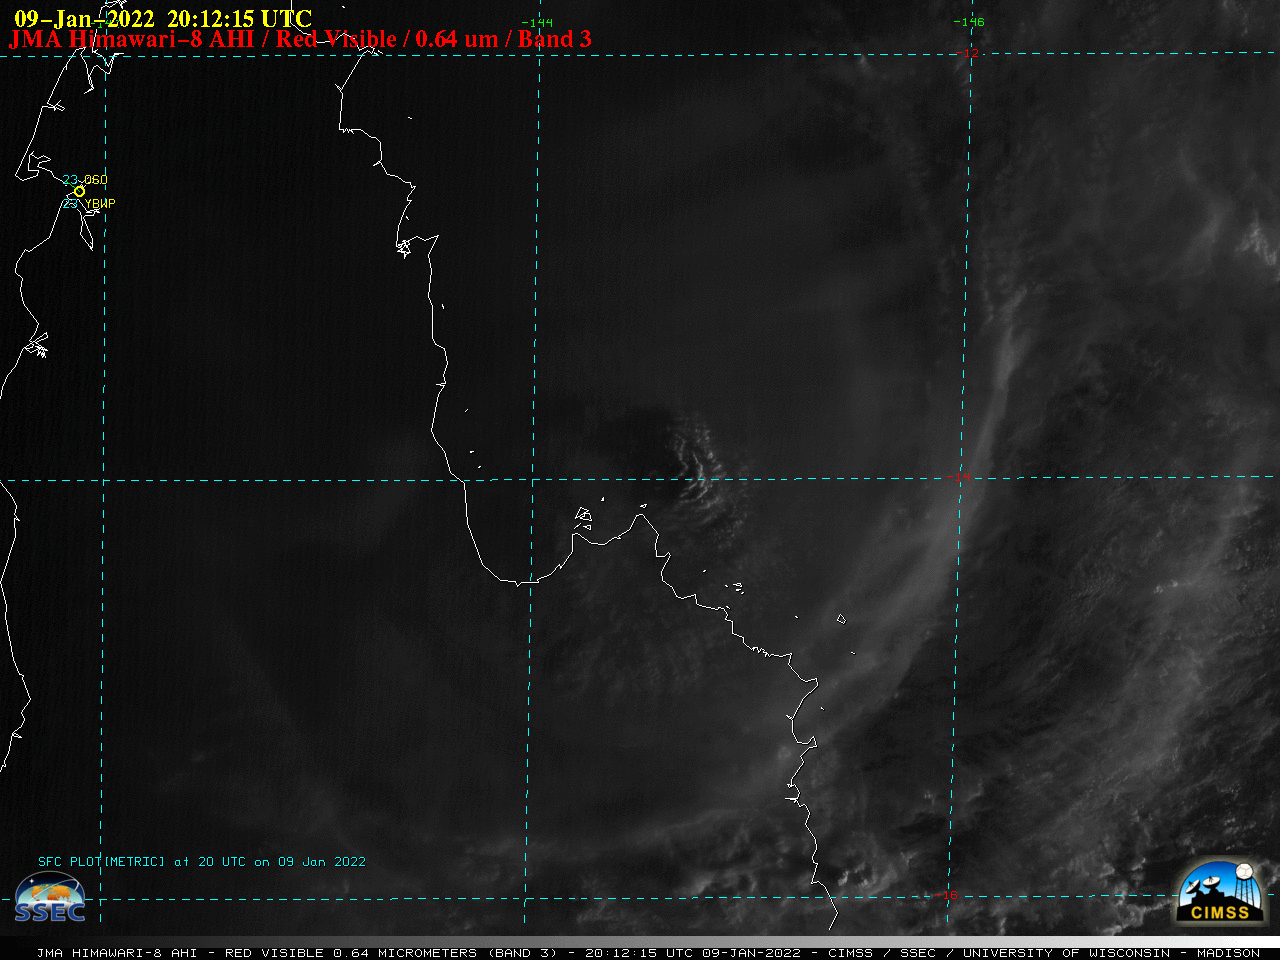
JMA Himawari-8 Visible (0.64 µm) images [click to play animated GIF | MP4]

JMA Himawari-8 Visible (0.64 µm) images (above) showed Tropical Cyclone Tiffany as it made landfall along the eastern coast of the Cape York Peninsula in Queensland, Australia on 09 January 2022. [UPDATE: just prior to making landfall around 0130 UTC on 10 January, Tiffany intensified to a Category 1 typhoon (JTWC discussion)].

A longer animation of Himawari-8 Infrared (10.4 µm) images (below) revealed pulses of overshooting tops which exhibited cloud-top infrared brightness temperatures in the -90 to -95°C range.

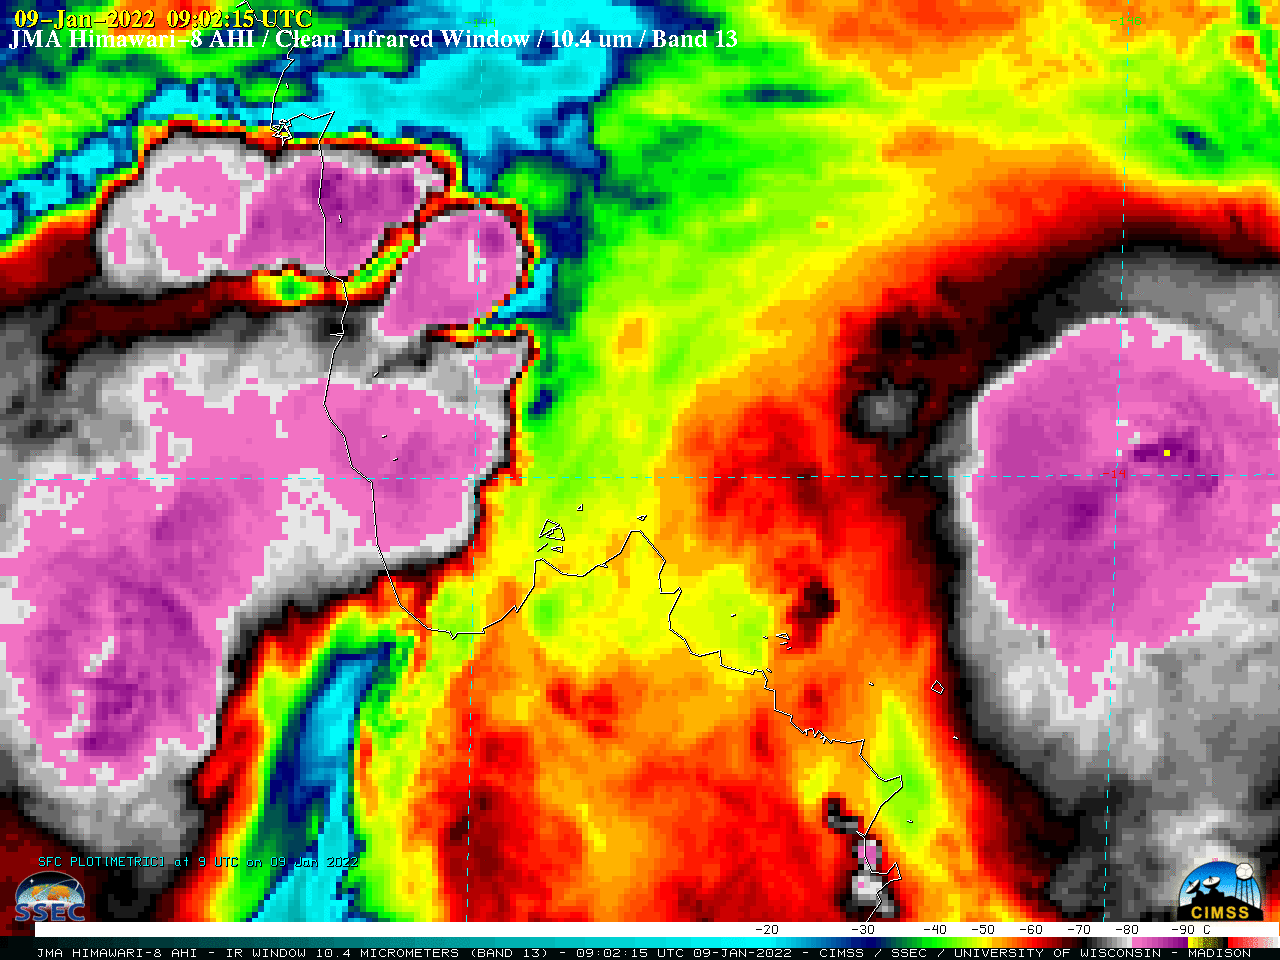
JMA Himawari-8 Infrared (10.4 µm) images [click to play animated GIF | MP4]

A stepped sequence of zoomed-in Suomi-NPP VIIRS Infrared (11.45 µm) images at 1517 UTC, viewed using RealEarth (below) showed a few red pixels — which highlighted cloud-top infrared brightness temperatures of -100°C or colder.   

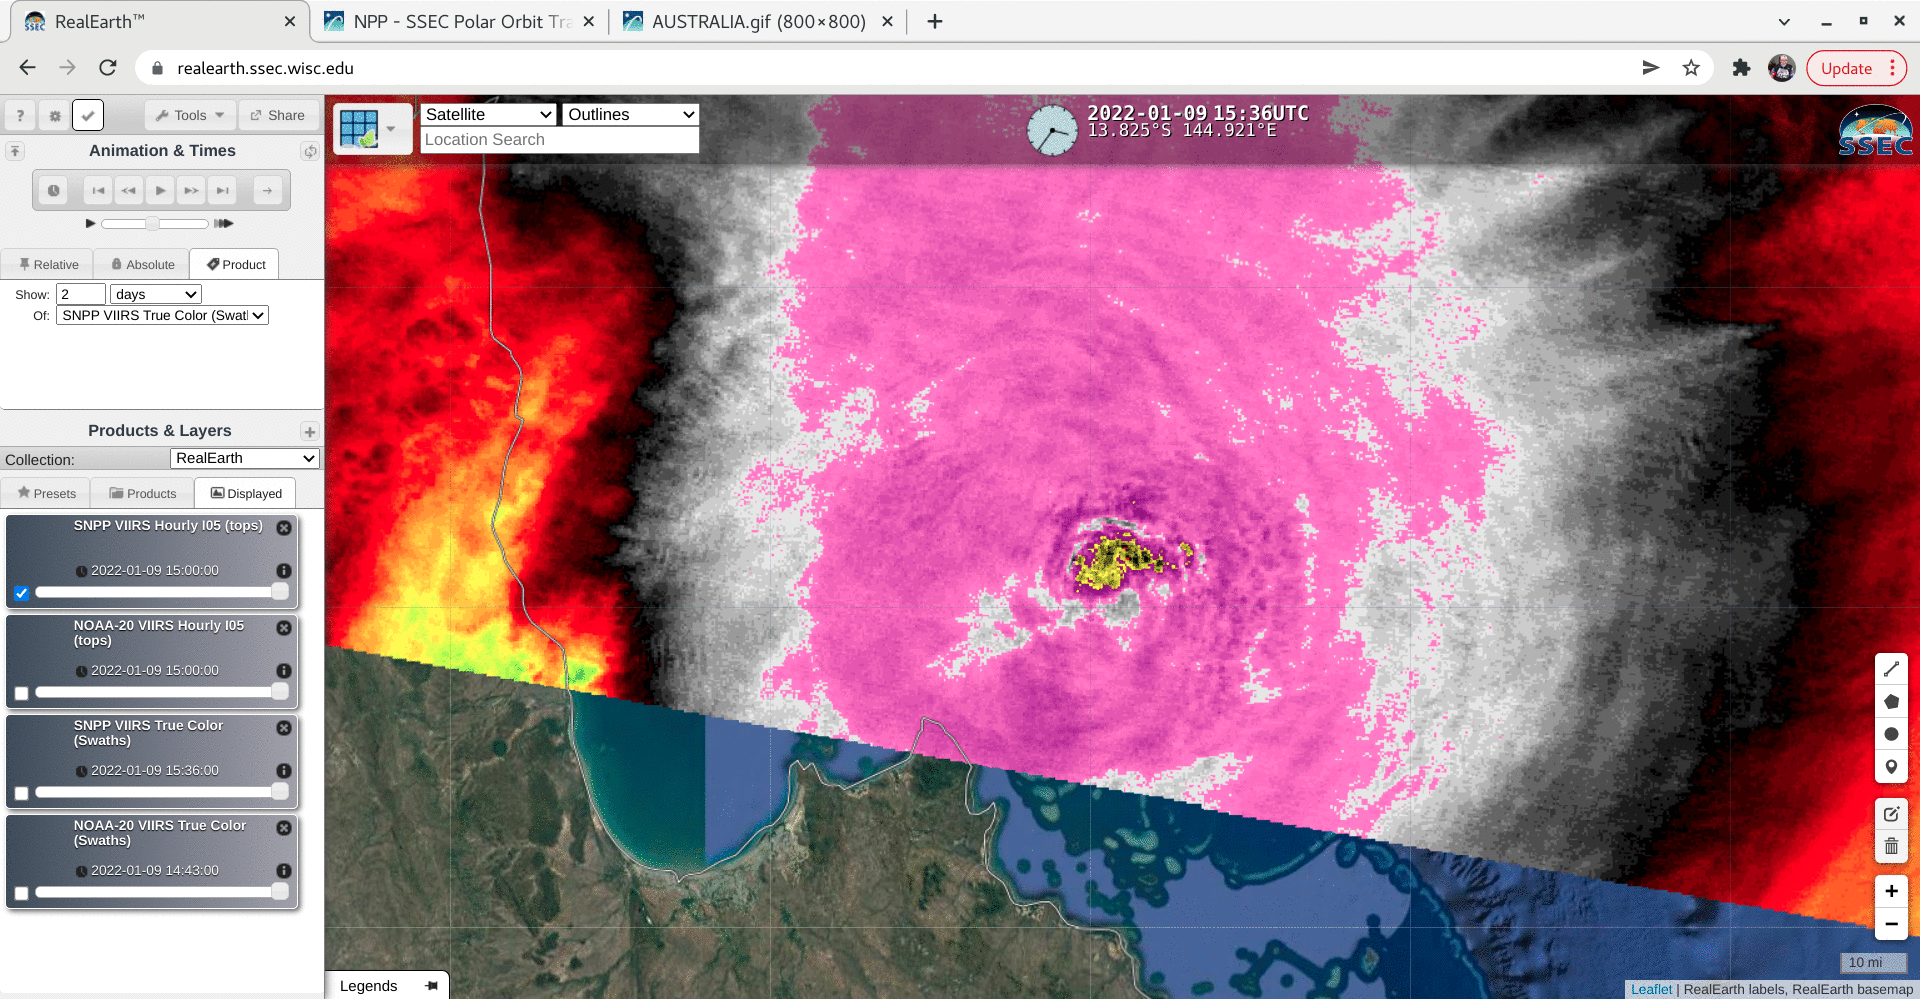
Suomi-NPP VIIRS Infrared (11.45 µm) image at 1517 UTC [click to enlarge]

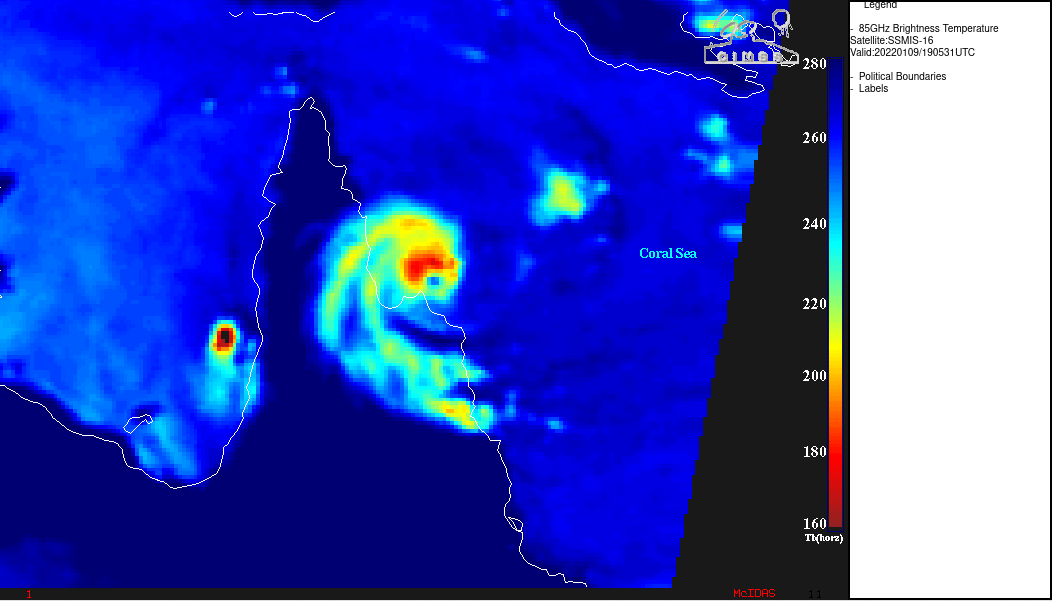
DMSP-16 SSMIS Microwave (85 GHz) imagery from the CIMSS Tropical Cyclones site (below) showed convection wrapping around a very small eye feature at 1905 UTC.

DMSP-16 SSMIS Microwave (85 GHz) image [click to enlarge]

Himawari-8 Infrared images with contours of deep-layer wind shear (below) indicated that Tiffany was moving through an environment of light to moderate shear. 

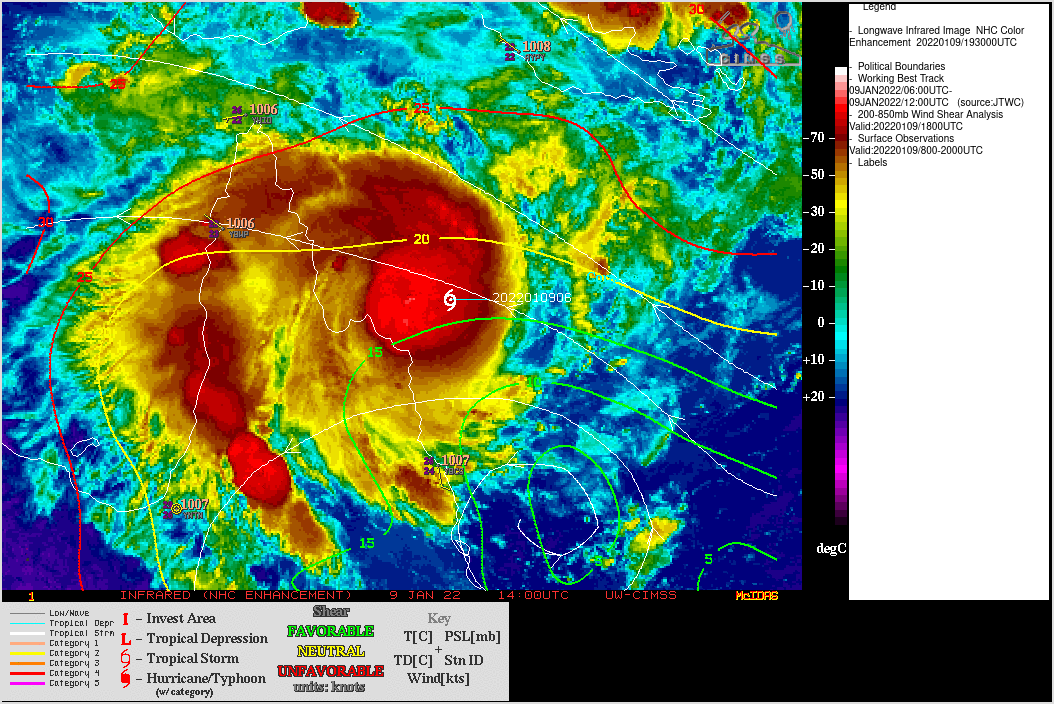
JMA Himawari-8 Infrared images, with contours of deep-layer wind shear [click to enlarge]

View only this post Read Less

Eruption of Volcán Wolf in the Galápagos Islands

GOES-16 Ash RGB images created using Geo2Grid (above) displayed the expansion of 2 volcanic clouds following the eruption of Wolf in the Galápagos Islands on 07 January 2022 — one moving northeastward and dissipating, and the other moving westward. The green shades of the volcanic cloud suggested that it contained fairly... Read More

GOES-16 Ash RGB images [click to play animated GIF | MP4]

GOES-16 Ash RGB images created using Geo2Grid (above) displayed the expansion of 2 volcanic clouds following the eruption of Wolf in the Galápagos Islands on 07 January 2022 — one moving northeastward and dissipating, and the other moving westward. The green shades of the volcanic cloud suggested that it contained fairly high concentrations of SO2 (in contrast to volcanic ash, would would appear as shades of pink/magenta). The cluster of dark blue pixels represented the hot thermal anomaly at the summit of the volcano, which persisted during the entire day.

This persistent thermal anomaly was also apparent in Shortwave Infrared (3.9 µm) images from GOES-17 (GOES-West) and GOES-16 (GOES-East) (below), shown in the native projection of each satellite.

Shortwave Infrared (3.9 µm) images from GOES-17 (left) and GOES-16 (right) [click to play animated GIF | MP4]

View only this post Read Less

Tropical disturbance near Fiji

GOES-17 ABI and GLM imagery (from this NOAA STAR website), above, over the southern Pacific Ocean show a region of potential tropical cyclogenesis to the west of Fiji, near the western boundary of this mapping. This Invest Area has been percolating for much of the week. Despite low values of shear (shown below,... Read More

GOES-17 Geocolor imagery and Flash Extent Density, 1506-1911 UTC on 7 January 2022 (Click to enlarge)

GOES-17 ABI and GLM imagery (from this NOAA STAR website), above, over the southern Pacific Ocean show a region of potential tropical cyclogenesis to the west of Fiji, near the western boundary of this mapping. This Invest Area has been percolating for much of the week. Despite low values of shear (shown below, from this website) and warm sea-surface temperatures, intensification to a tropical depression has not yet occurred (see this discussion from the Joint Typhoon Warning Center). However, GLM observations of Flash Extent Density (FED) do show occasional lightning events within the developing system.

Diagnosed wind shear, 1800 UTC on 07 January 2022 (Click to enlarge)

Upper-level water vapor imagery (GOES-17 Band 8, at 6.19 µm), below, from 1940 UTC, shows a distinct cirrus overcast at about 17 S, 172 E. Substantial dry air is not indicated in the water vapor imagery, nor in a MIMIC TPW mapping from 1200 UTC (downloaded from here), shown below.

Upper-level water vapor imagery (GOES-17 Band 8, 6.19 µm), 1930 UTC on 7 January 2022 (Click to enlarge)
MIMIC Total Precipitable Water fields, 1200 UTC on 7 January 2022 (Click to enlarge)

Scatterometry over this system on 7 January (downloaded from this website), show an increase in symmetry to the storm between the HY-2B overpass at 0630 UTC and the HY-2C overpass at 1330 UTC. For more information on this system over the weekend, refer to the SSEC/CIMSS Tropical Website, the Joint Typhoon Warning Center, and the Fiji Meteorological Service.

Scatterometery over the south Pacific, 0630 and 1330 UTC on 7 January 2022 (Click to enlarge)

View only this post Read Less

Blowing snow across parts of Minnesota and Iowa

1-minute Mesoscale Domain Sector GOES-16 (GOES-East) “Red” Visible (0.64 µm) and Day Snow-Fog RGB images (above) displayed NW-to-SE oriented horizontal convective roll cloud features that highlighted areas where blowing snow was reducing surface visibility across southeastern Minnesota and northwestern Iowa during the afternoon hours on 06 January 2022. The visibility dropped to 2 miles at Alberta Lea,... Read More

GOES-16 “Red” Visible (0.64 µm) and Day Snow-Fog RGB images [click to play animated GIF | MP4]

1-minute Mesoscale Domain Sector GOES-16 (GOES-East) “Red” Visible (0.64 µm) and Day Snow-Fog RGB images (above) displayed NW-to-SE oriented horizontal convective roll cloud features that highlighted areas where blowing snow was reducing surface visibility across southeastern Minnesota and northwestern Iowa during the afternoon hours on 06 January 2022. The visibility dropped to 2 miles at Alberta Lea, Minnesota (KAEL) — which is at the junction of Interstates 35 and 90 — at 21 UTC. 

View only this post Read Less