This website works best with a newer web browser such as Chrome, Firefox, Safari or Microsoft
Edge. Internet Explorer is not supported by this website.
JMA Himawari-8 Visible (0.64 µm) and Infrared Window (10.4 µm) images (above) showed the development of “island-effect” thunderstorms over Guam on 05 October 2022 — as mentioned in the NWS Guam Area Forecast Discussion, these storms produced 2-3 inches of rainfall over parts of western/central Guam (prompting the issuance of a Flood... Read More
Himawari-8 Visible (0.64 µm, left) and Infrared Window (10.4 µm, right) [click to play animated GIF | MP4]
JMA Himawari-8 Visible (0.64 µm) and Infrared Window (10.4 µm) images (above) showed the development of “island-effect” thunderstorms over Guam on 05 October 2022 — as mentioned in the NWS Guam Area ForecastDiscussion, these storms produced 2-3 inches of rainfall over parts of western/central Guam (prompting the issuance of a Flood Advisory: Text | Tweet).
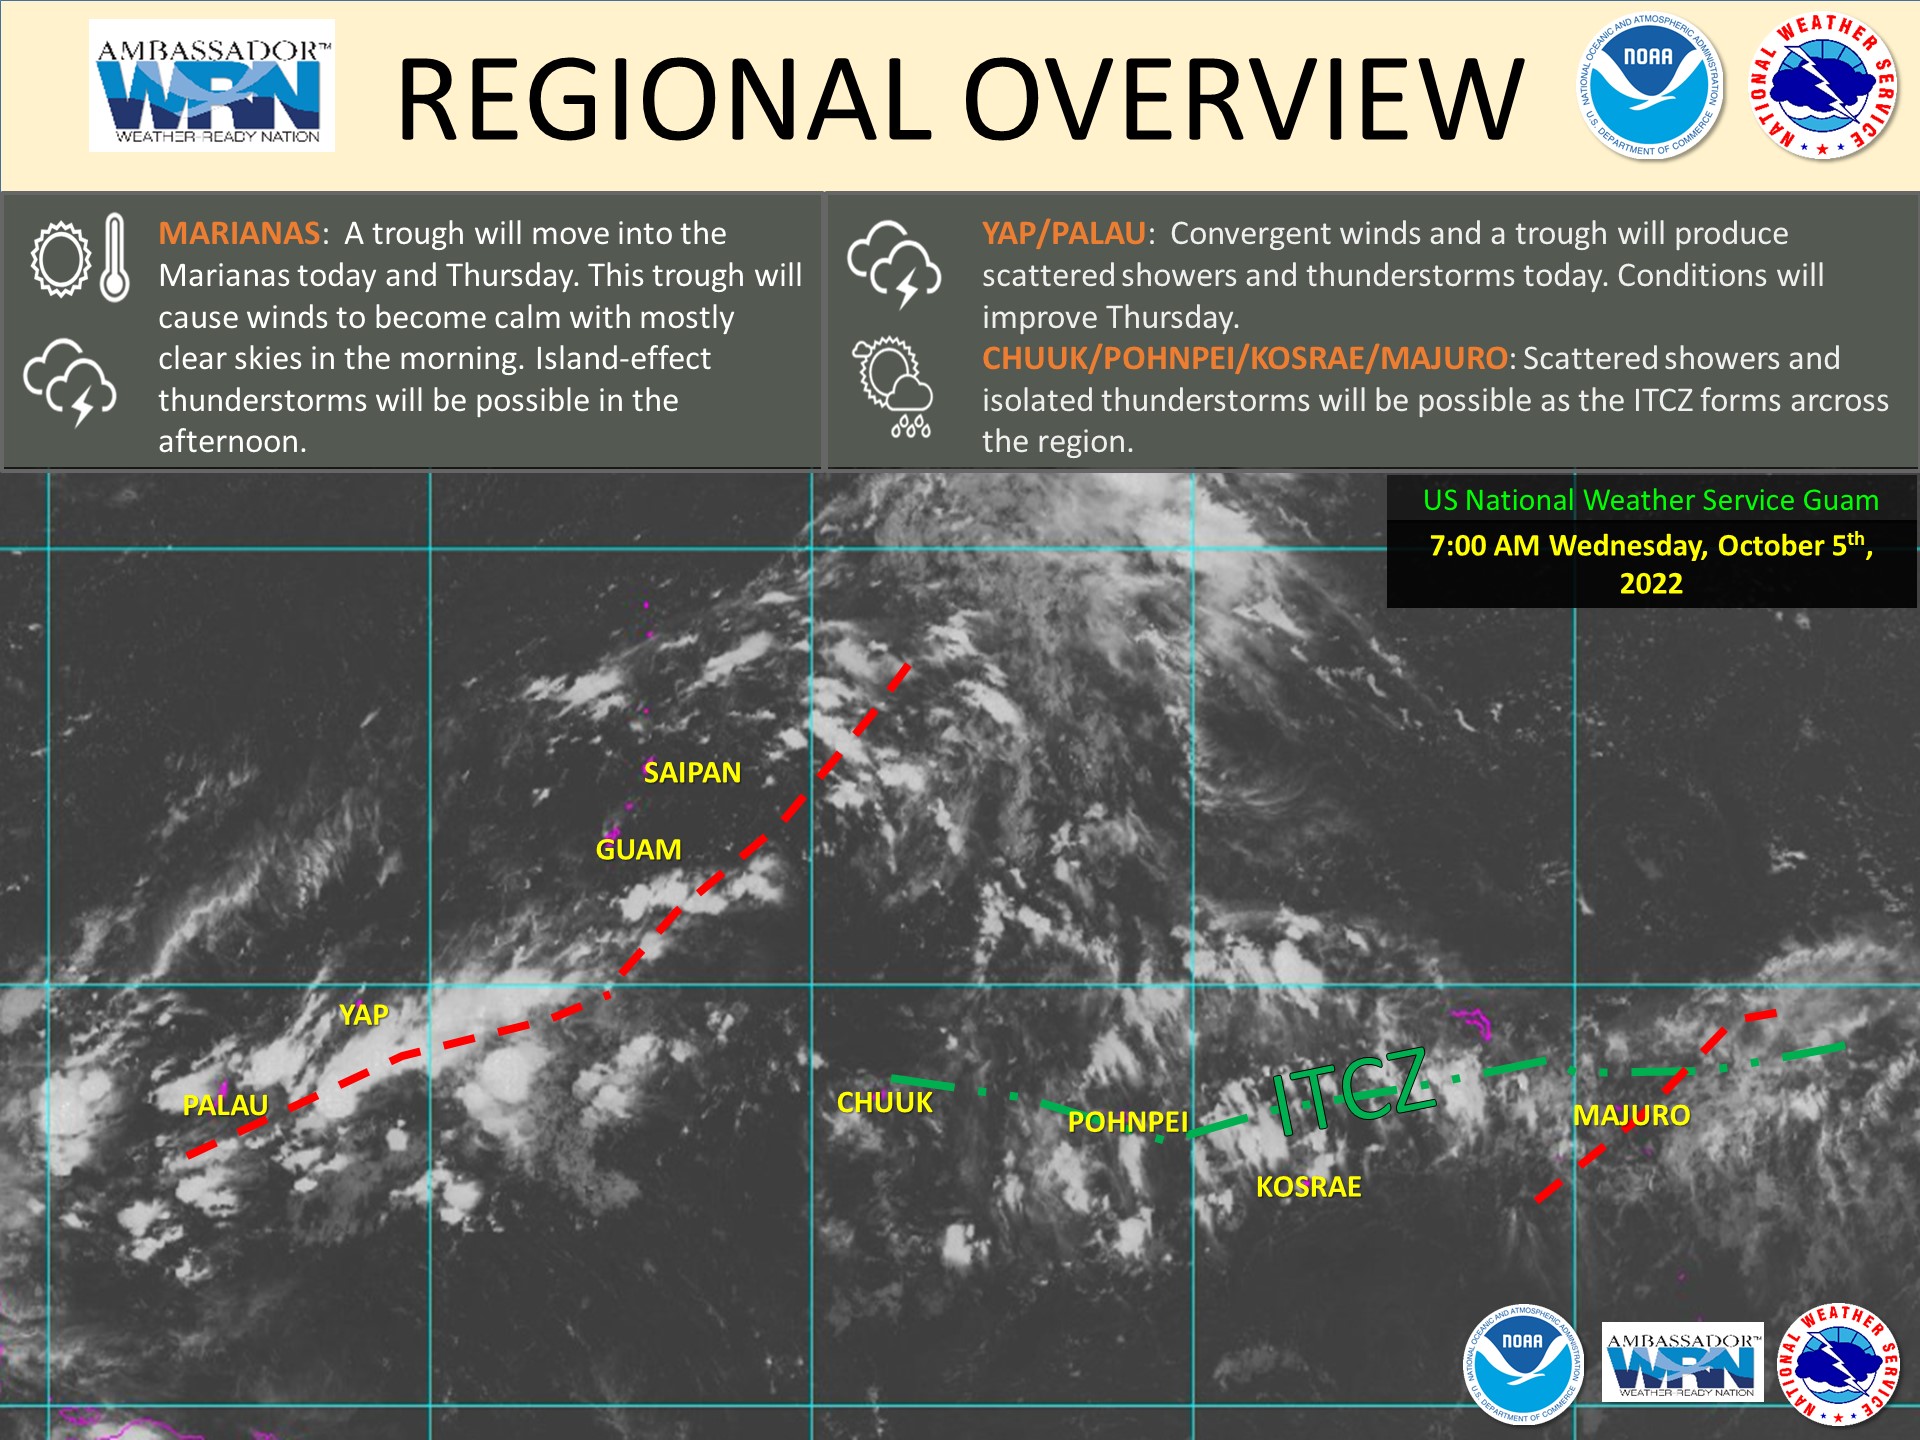
This type of island-effect convection occurred because the typical easterly trade wind flow within the boundary layer was disrupted when a trough of low pressure became situated across the region, which led to a regime of light surface winds across the Mariana Islands (below) — and daytime heating of the islands contributed to “land breeze” convergence which aided convective development.
Himawari-8 Visible (0.64 µm) image at 0000 UTC on 05 October, with GFS model 1000 hPa wind barbs plotted in yellow [click to enlarge]
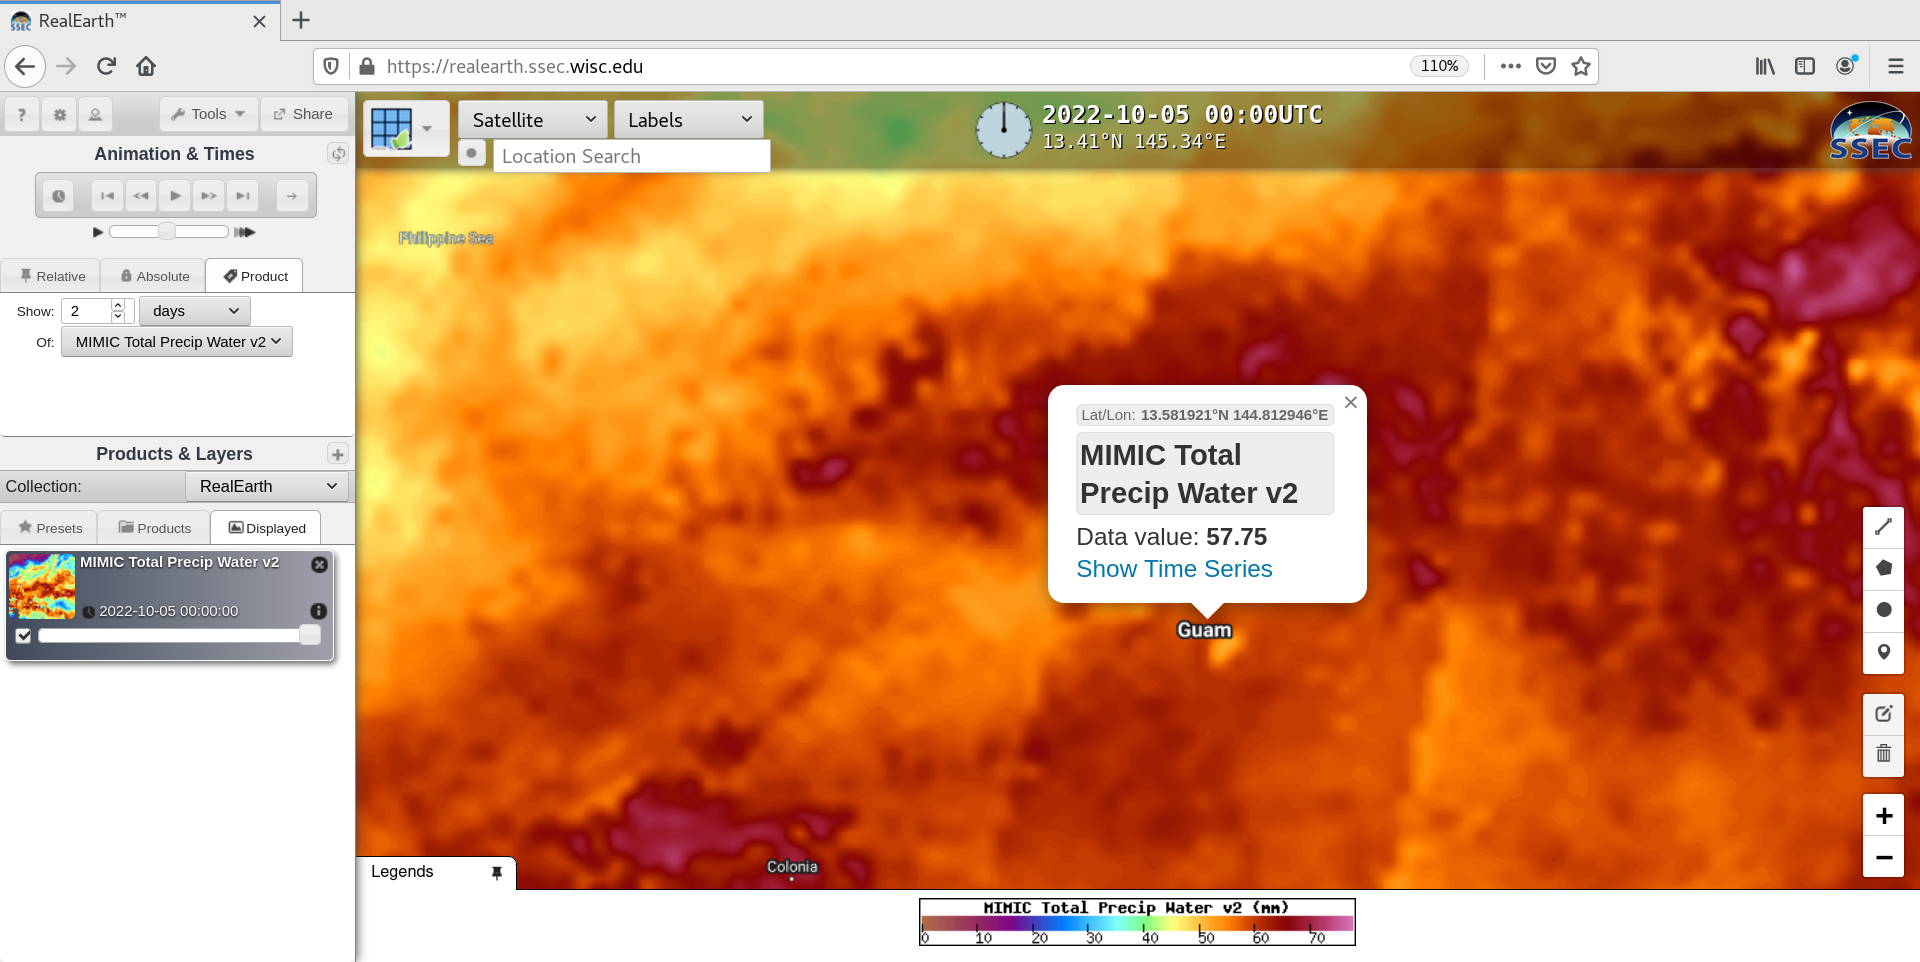
Hourly images of the MIMIC Total Precipitable Water product, viewed using RealEarth(below), indicated that abundant moisture was in place over Guam and the Mariana Islands during this period — for example, 57.75 mm (2.27 inches) in the vicinity of Guam at 0000 UTC (the Guam rawinsonde TPW value at that time was 54.48 mm or 2.15 inches).
Hourly MIMIC Total Precipitable Water product [click to play animated GIF]
A toggle between Suomi-NPP VIIRS True Color RGB and Infrared Window (11.45 µm) images valid at 0332 UTC (below) showed a thunderstorm that was developing over the western edge of the island.
Suomi-NPP VIIRS True Color RGB and Infrared Window (11.45 µm) images, valid at 0332 UTC [click to enlarge]
Another example of island-effect convection over Guam on the following day is discussed here.
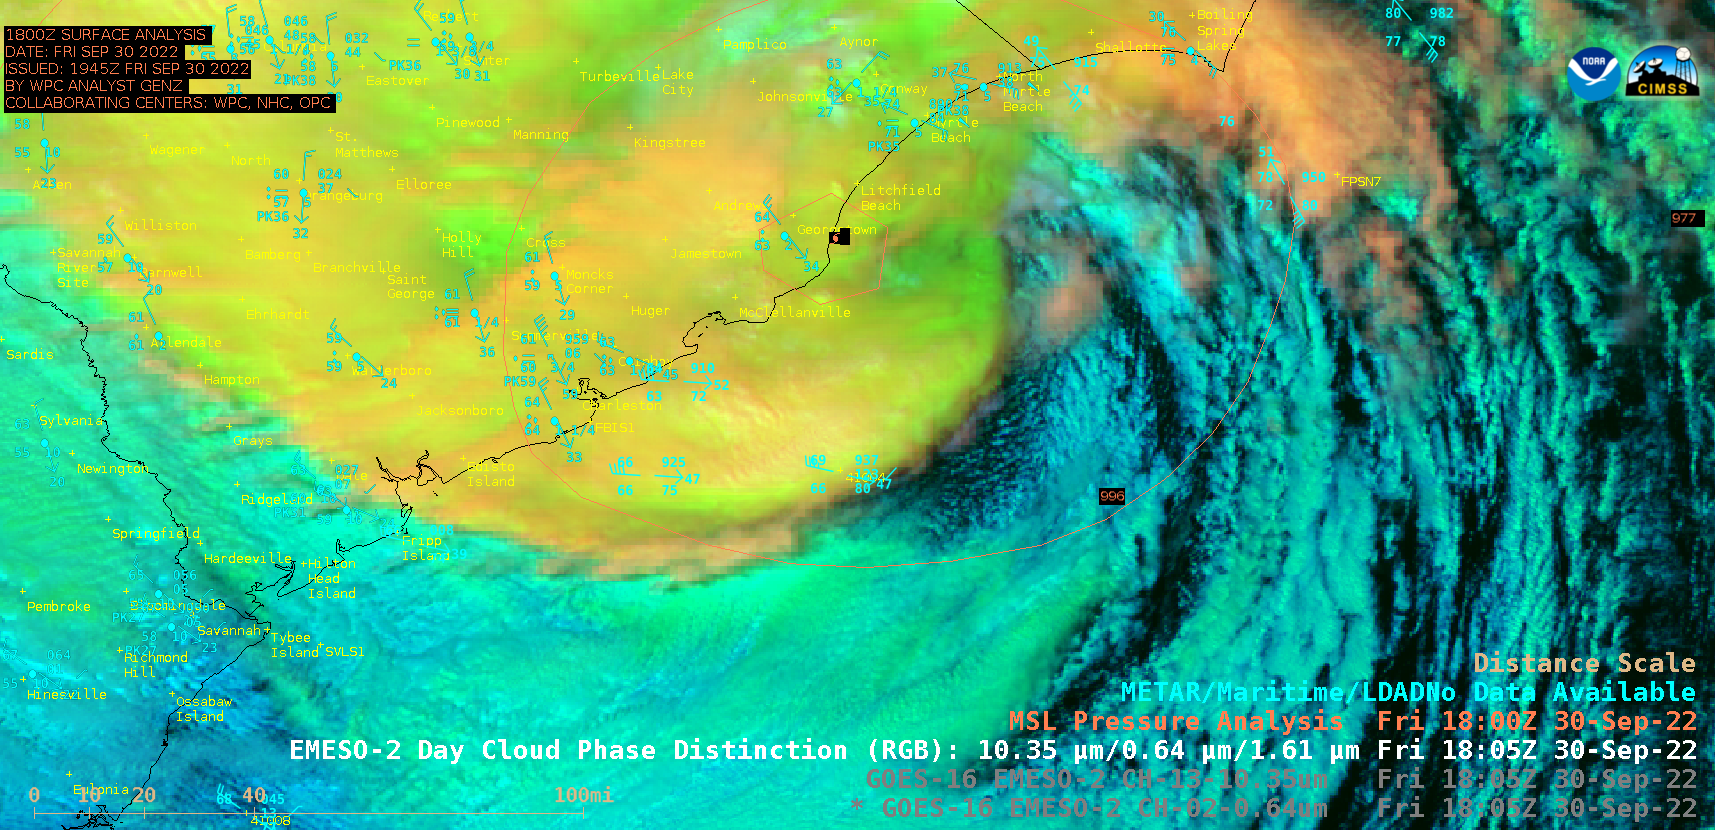
1-minute Mesoscale Domain Sector GOES-16 (GOES-East) “Red” Visible (0.64 µm) images (above) showed Hurricane Ian as it made landfall as a Category 1 storm near Georgetown, South Carolina at 1805 UTC on 30 September 2022 — producing wind gusts as high as 92 mph and rainfall totals exceeding 5 inches. The low-level circulation center was mostly obscured by... Read More
GOES-16 “Red” Visible (0.64 µm) images [click to play animated GIF | MP4]
1-minute Mesoscale Domain Sector GOES-16 (GOES-East) “Red” Visible (0.64 µm) images (above) showed Hurricane Ian as it made landfall as a Category 1 storm near Georgetown, South Carolina at 1805 UTC on 30 September 2022 — producing wind gusts as high as 92 mph and rainfall totals exceeding 5 inches. The low-level circulation center was mostly obscured by high clouds during the time period shown, though partial clearing did reveal some of the low cloud motions within the southeastern quadrant of the hurricane.
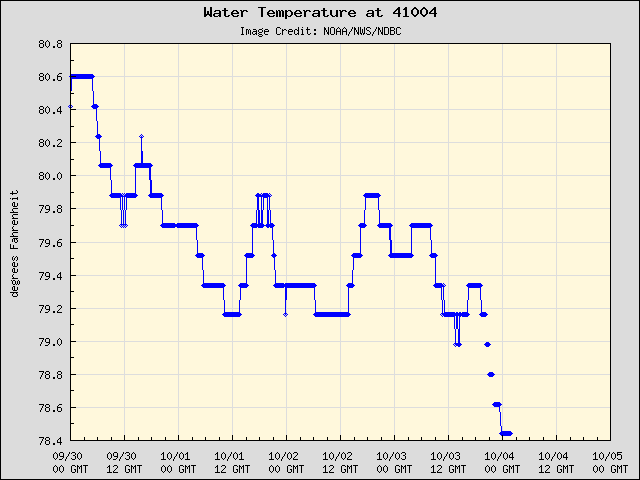
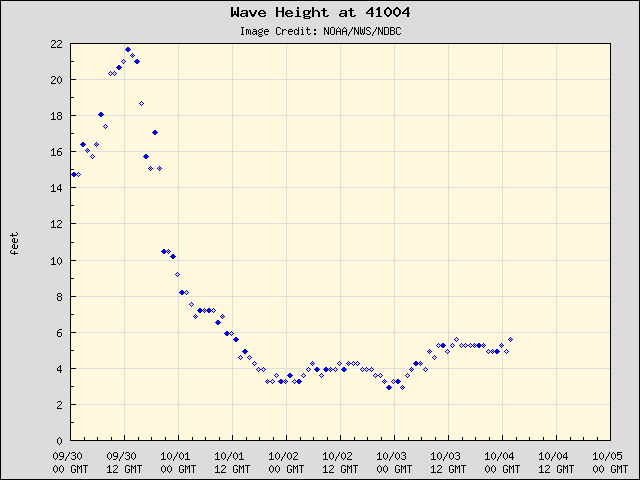
The hurricane center moved just east of Buoy 41004, where a wind gust to 64 knots / 74 mph was recorded several hours prior to the closest passage. The Buoy 41004 sea surface temperature as Ian moved through was 80ºF, with a cooling trend seen during the following 4 days (due to the upwelling of cooler sub-surface water, caused by wind-driven high waves).
GOES-16 Day Cloud Phase Distinction RGB images (below) helped to discriminate between the low-level clouds (shades of cyan) and mid to high-level clouds (shades of green to yellow).
GOES-16 Day Cloud Phase Distinction RGB images [click to play animated GIF | MP4]
GOES-16 “Clean” Infrared Window (10.3 µm) images (below) showed that the coldest cloud-top infrared brightness temperatures were around -70ºC (darker shades of red).
GOES-16 “Clean” Infrared Window (10.3 µm) images [click to play animated GIF | MP4]
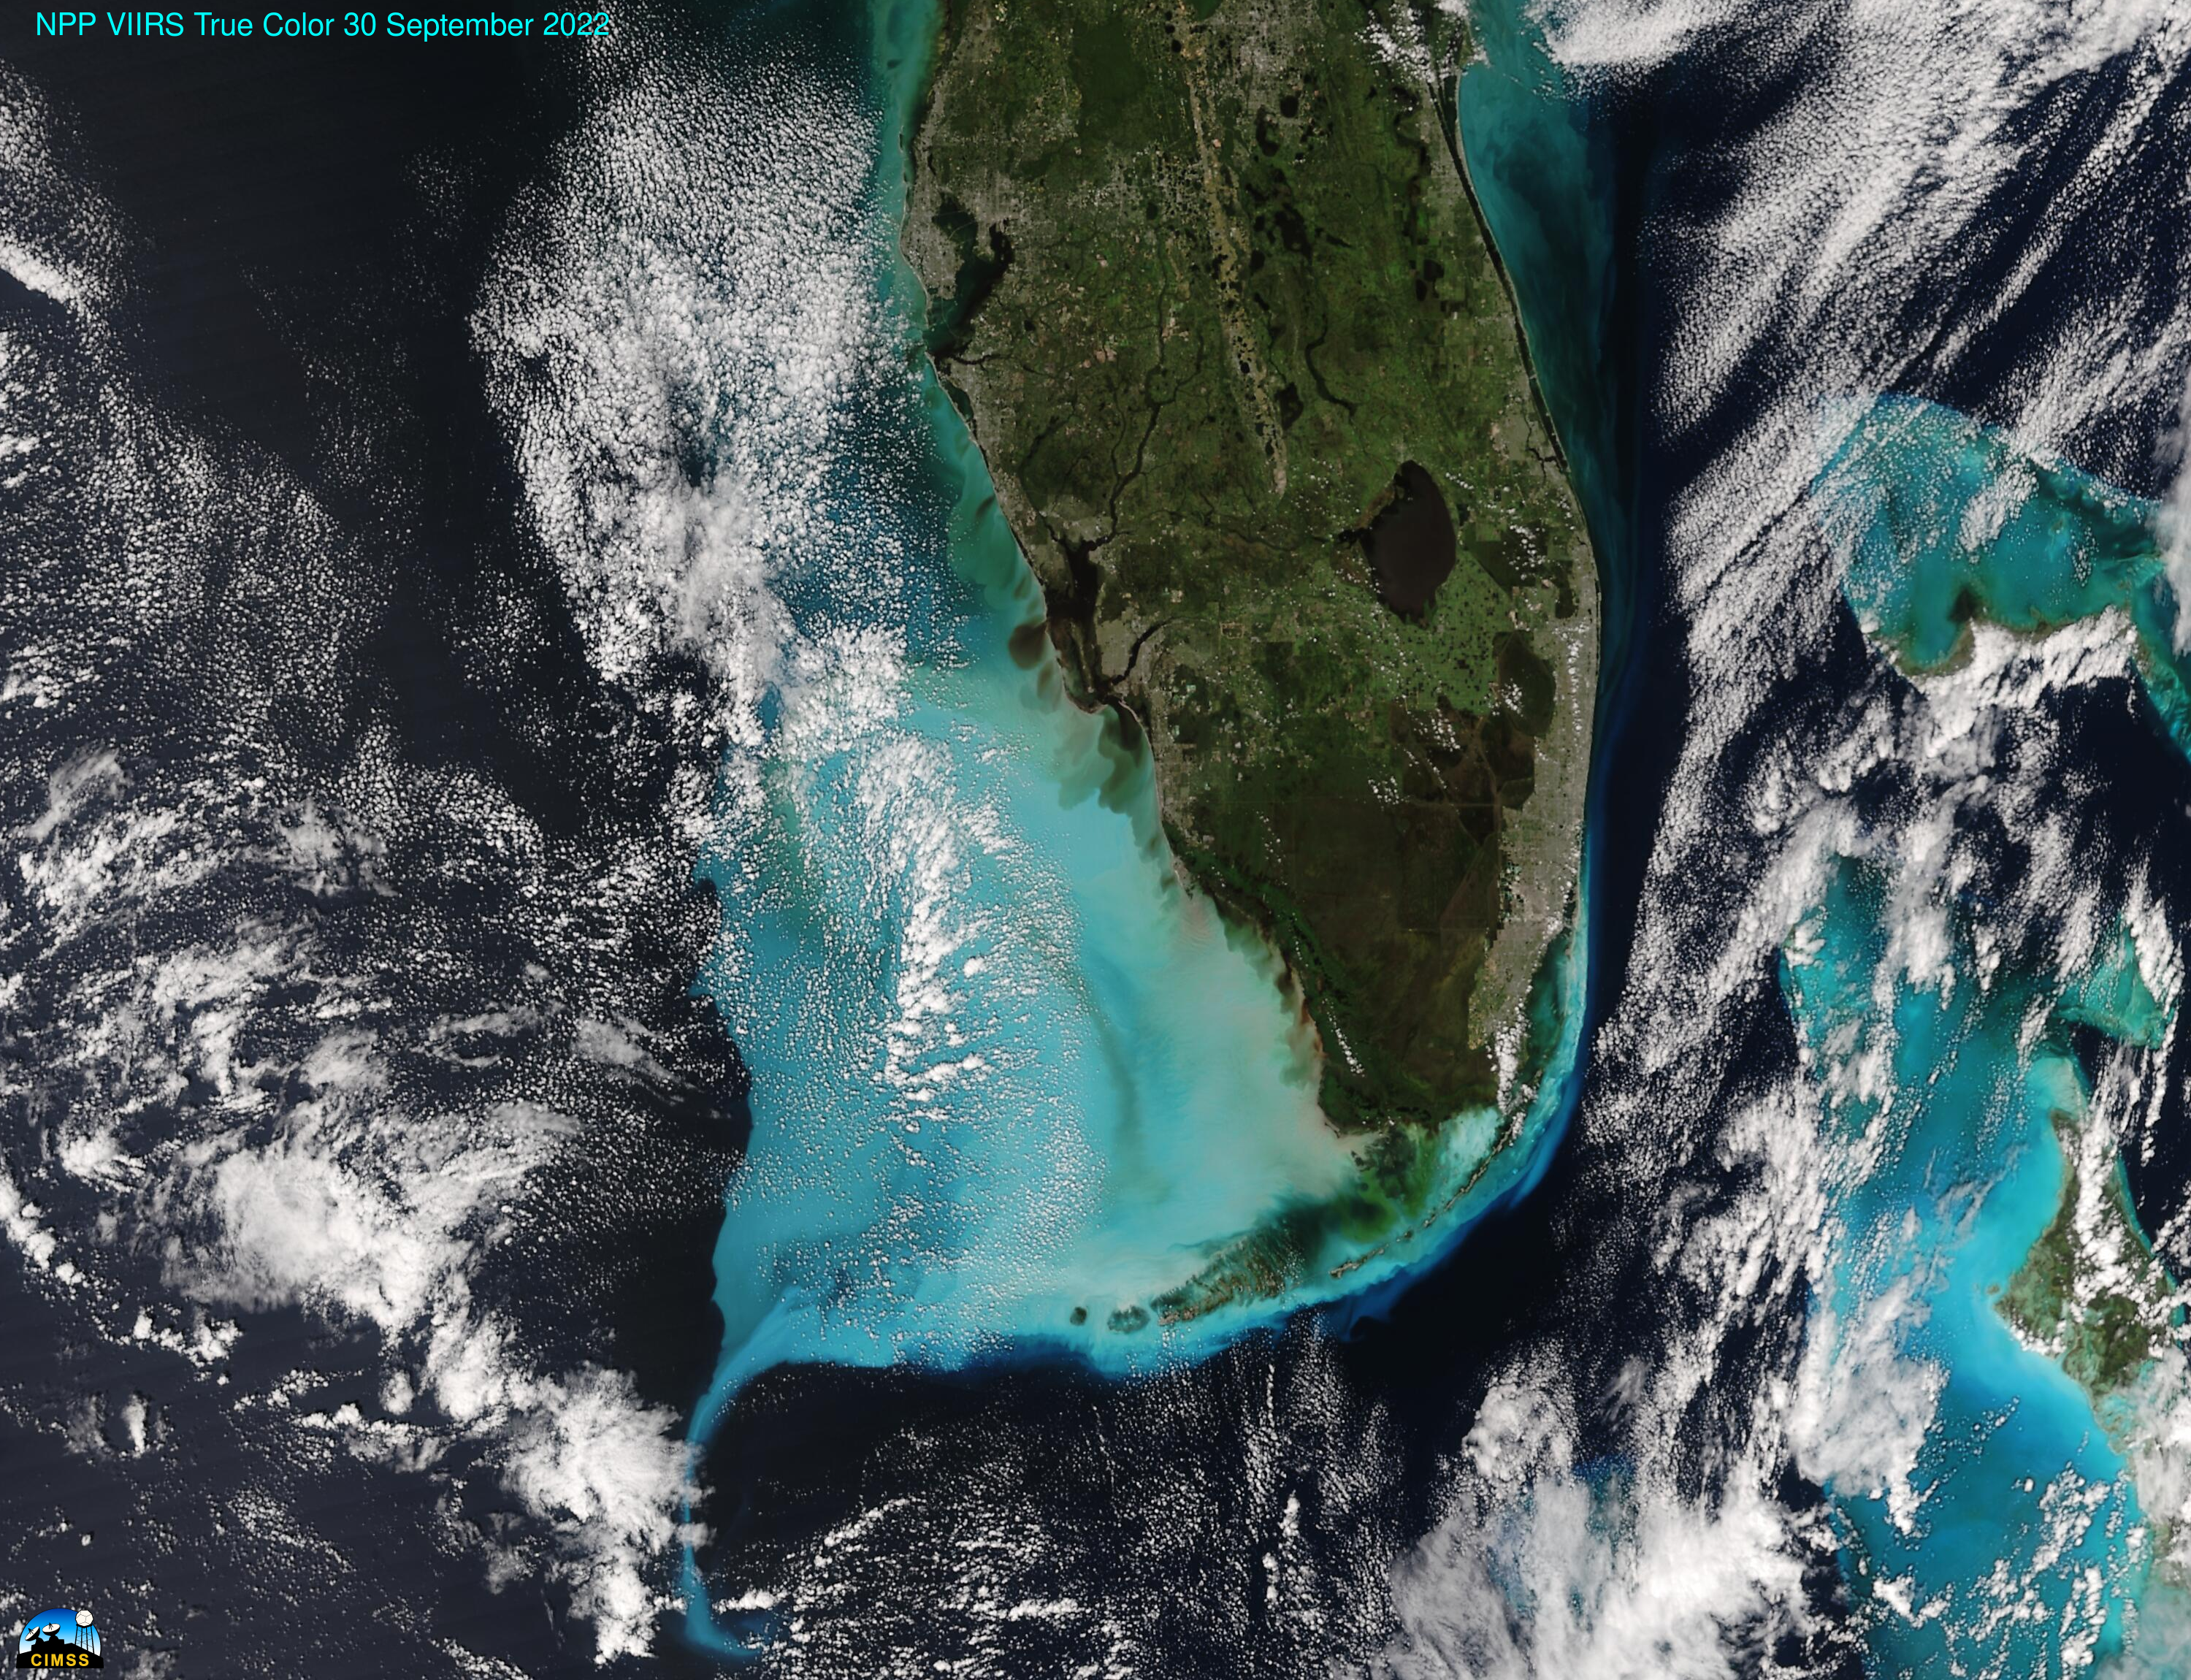
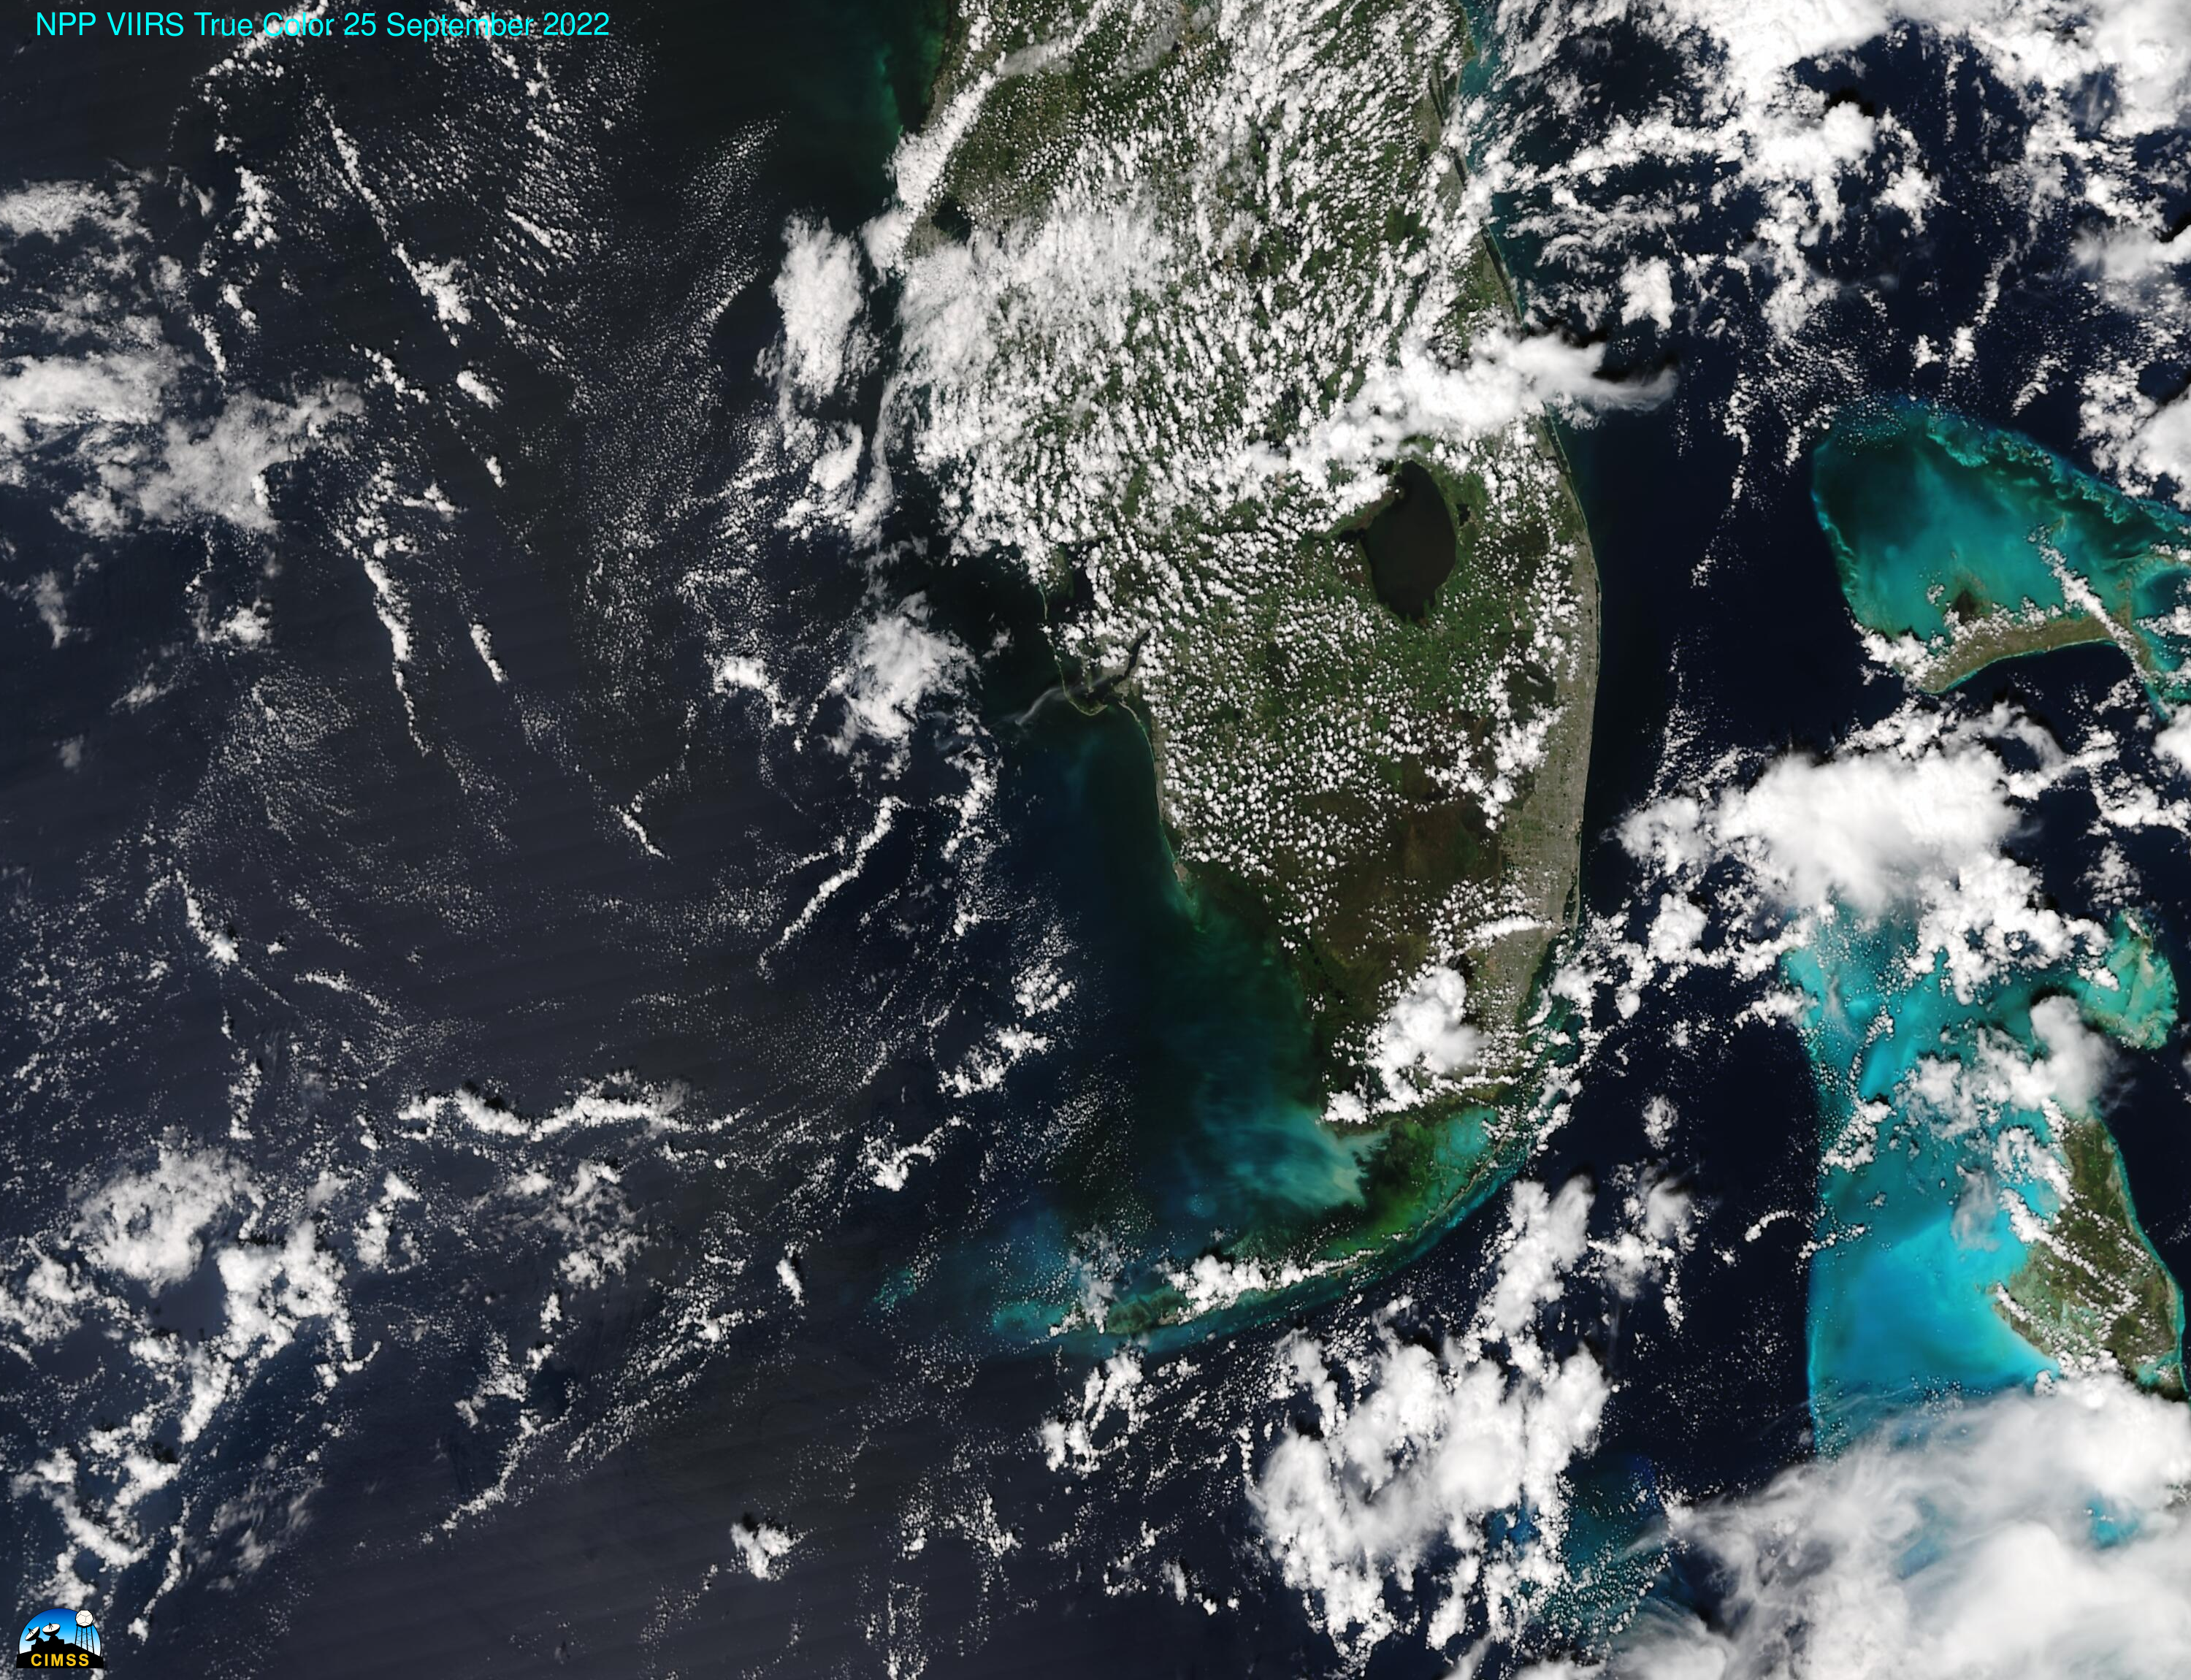
Polar-Orbiting satellites flying over Florida viewed remarkable changes in water quality from before and after the passage of Hurricane Ian. Imagery from Suomi-NPP, for example, from 25 September and 30 September, toggled below (imagery derived from the VIIRS Today website), shows a large increase in turbidity in the Gulf (and over the Atlantic... Read More
Polar-Orbiting satellites flying over Florida viewed remarkable changes in water quality from before and after the passage of Hurricane Ian. Imagery from Suomi-NPP, for example, from 25 September and 30 September, toggled below (imagery derived from the VIIRS Today website), shows a large increase in turbidity in the Gulf (and over the Atlantic off the coast of eastern Florida) as well as discharge plumes from near Fort Myers and from points to the south.
VIIRS Today True-Color imagery from Suomi-NPP, 25 and 30 September 2022 (Click to enlarge)
True-color imagery from the Aqua MODIS instrument (below), taken from the MODIS Today website, also shows the dramatic changes (between 25 September and 30 September) in turbidity and water quality off the southwestern coast of Florida.
MODIS True-color imagery over the southeastern Gulf of Mexico before (25 September) and after (30 September) Hurricane Ian
Note: Hurricane Wilma caused a similar increase in turbidity (link).
Thanks to RIck DiMaio, Lewis University, for pointing this out!
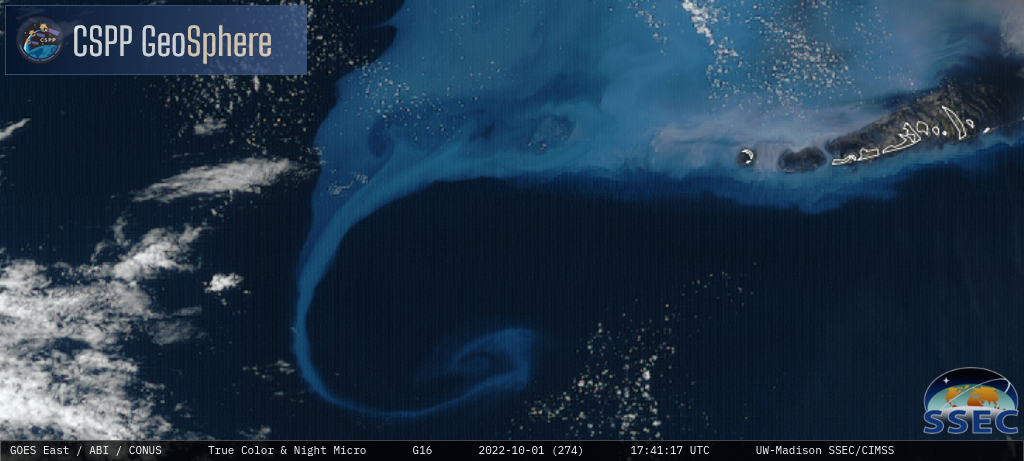
01 October Update: One feature of interest was a small cyclonic eddy that developed along the end of a long curved filament of cyan-colored turbidity which was wrapping around the Florida Keys — shown in GOES-16 (GOES-East) True Color RGB images from the CSPP Geosphere site (below).
GOES-16 True Color RGB images [click to play MP4 animation]
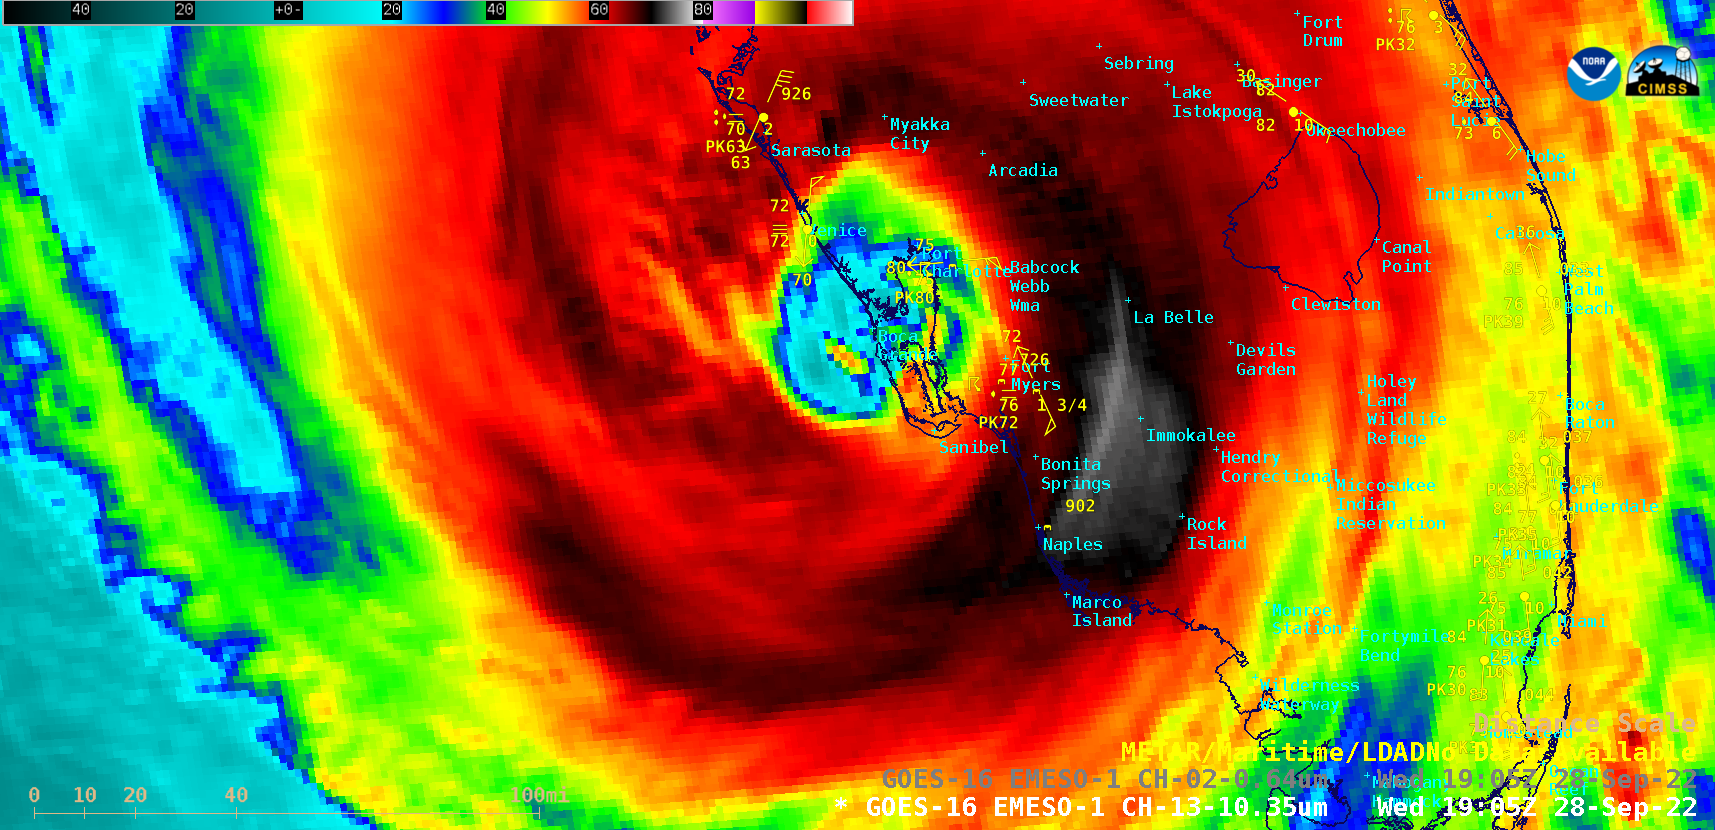
Overlapping 1-minute Mesoscale Domain Sectors provided 30-second interval GOES-16 (GOES-East) “Clean” Infrared Window (10.3 µm) and “Red” Visible (0.64 µm) images (above) during a 7-hour period that included the landfall of Hurricane Ian along the southwest coast of Florida at 1905 UTC (Visible | Infrared) on 28 September 2022. Moving across very warm water (where buoy... Read More
GOES-16 “Clean” Infrared Window (10.3 µm) and “Red” Visible (0.64 µm) images [click to play animated GIF | MP4]
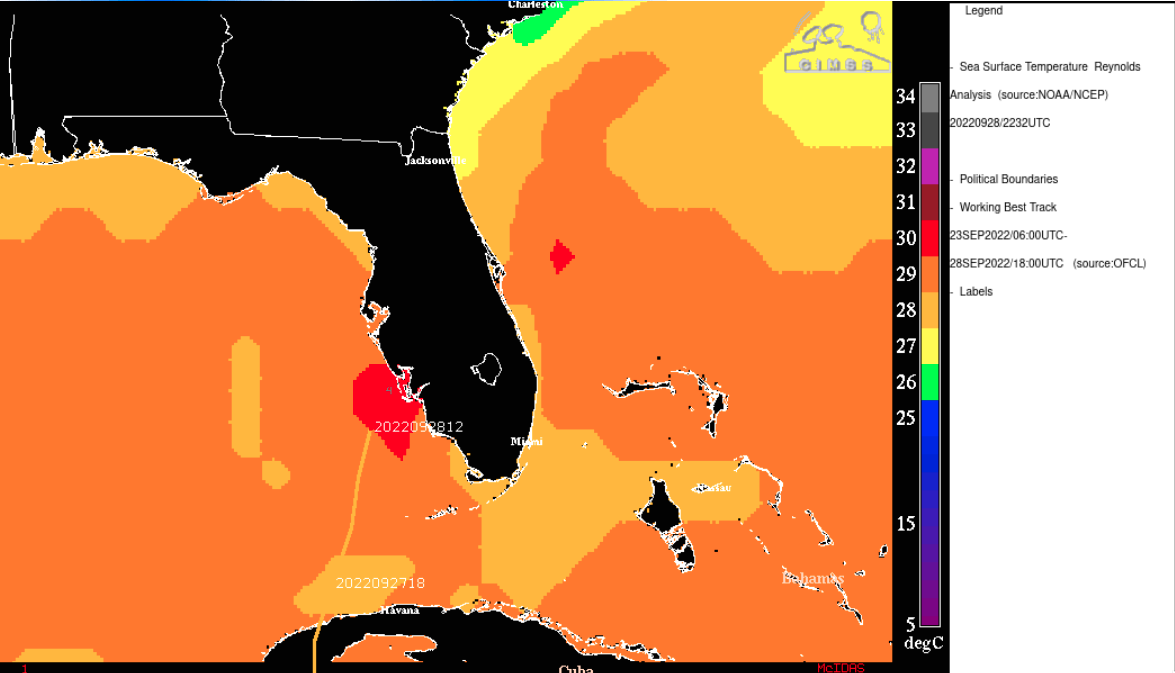
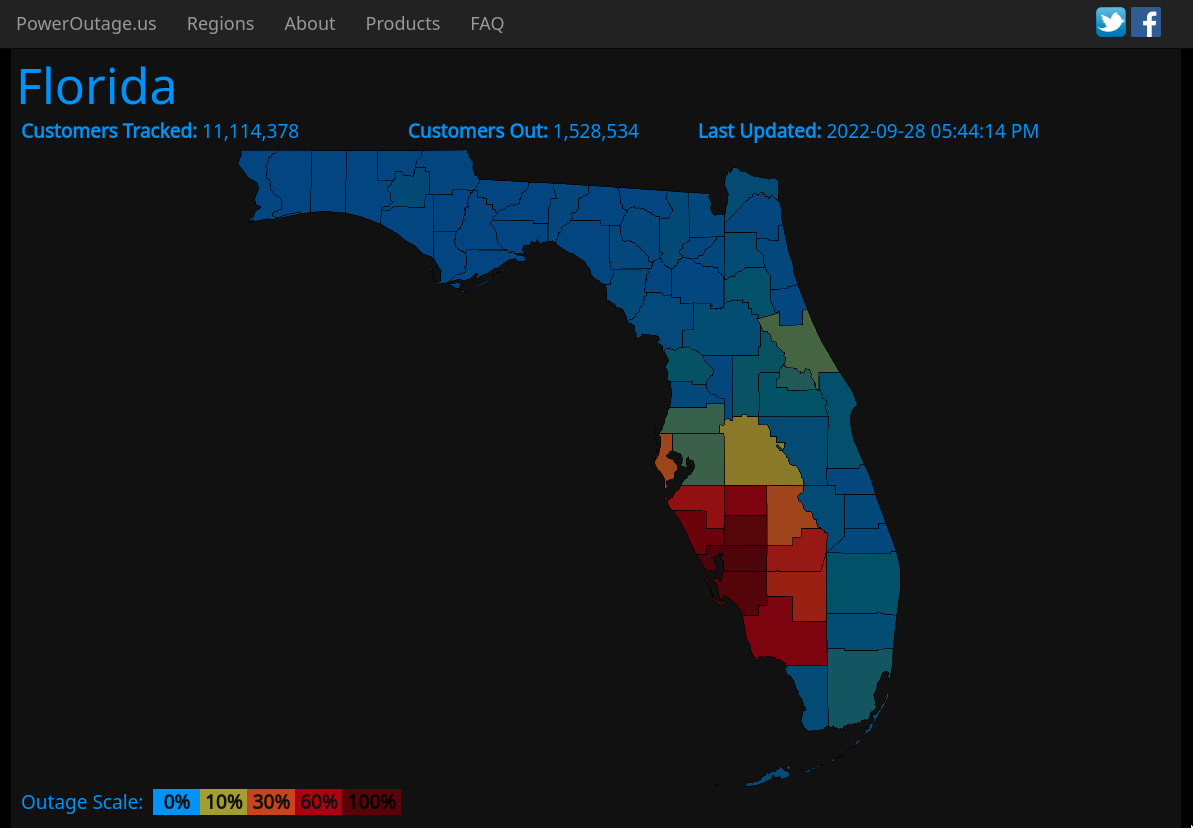
Overlapping 1-minute Mesoscale Domain Sectors provided 30-second interval GOES-16 (GOES-East) “Clean” Infrared Window (10.3 µm) and “Red” Visible (0.64 µm) images (above) during a 7-hour period that included the landfall of Hurricane Ian along the southwest coast of Florida at 1905 UTC (Visible | Infrared) on 28 September 2022. Moving across very warm water (where buoy Sea Surface Temperature values were 82-85ºF), Ian intensified to a Category 4 hurricane at 1200 UTC, and further intensified as it neared the Florida coast to just below Category 5 strength (rated at 135 knot sustained winds). As Ian moved inland, peak wind gusts were as high as 140 mph, and heavy rainfall exceeded 10 inches within a 4-hour period (WPC Storm Summary). These strong winds quickly resulted in power outages to 96-99% of customers in DeSoto, Charlotte and Lee Counties by 2244 UTC — note the disappearance of surface plot data in the GOES-16 imagery after 20 UTC at sites such as Venice (peak gust 90 knots / 104 mph), Punta Gorda (peak gust 117 knots / 135mph) and Fort Meyers (peak gust 87 knots / 100 mph).
30-second GOES-16 Visible images with time-matched plots of GLM Flashes (below) indicated that lightning activity within the eyewall decreased as the eye of Ian approached the coast.
GOES-16 “Red” Visible (0.64 µm) images, with plots of GLM Flashes [click to play animated GIF | MP4]
In a comparison of ~500-meter resolution GOES-16 Visible and ~15-meter resolution Landsat-8 Operational Land Imager Panchromatic images valid at 1557 UTC — viewed using RealEarth(below) — the Landsat image provided a more detailed view of the cloud structures within the eye of Hurricane Ian as it was just off the west coast of Florida.
GOES-16 “Red” Visible (0.64 µm) and Landsat-8 Panchromatic (0.59 µm) images, valid at 1557 UTC [click to enlarge]
A closer look at the 15-meter resolution Landsat-8 Panchromatic image is available here.
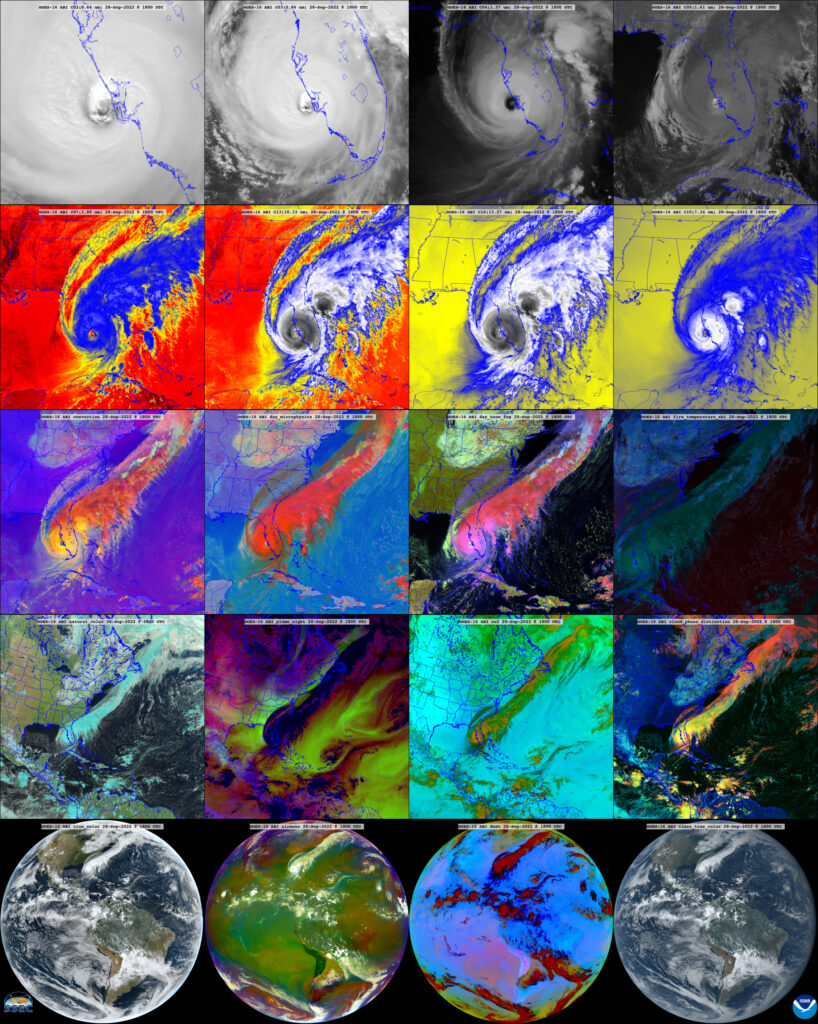
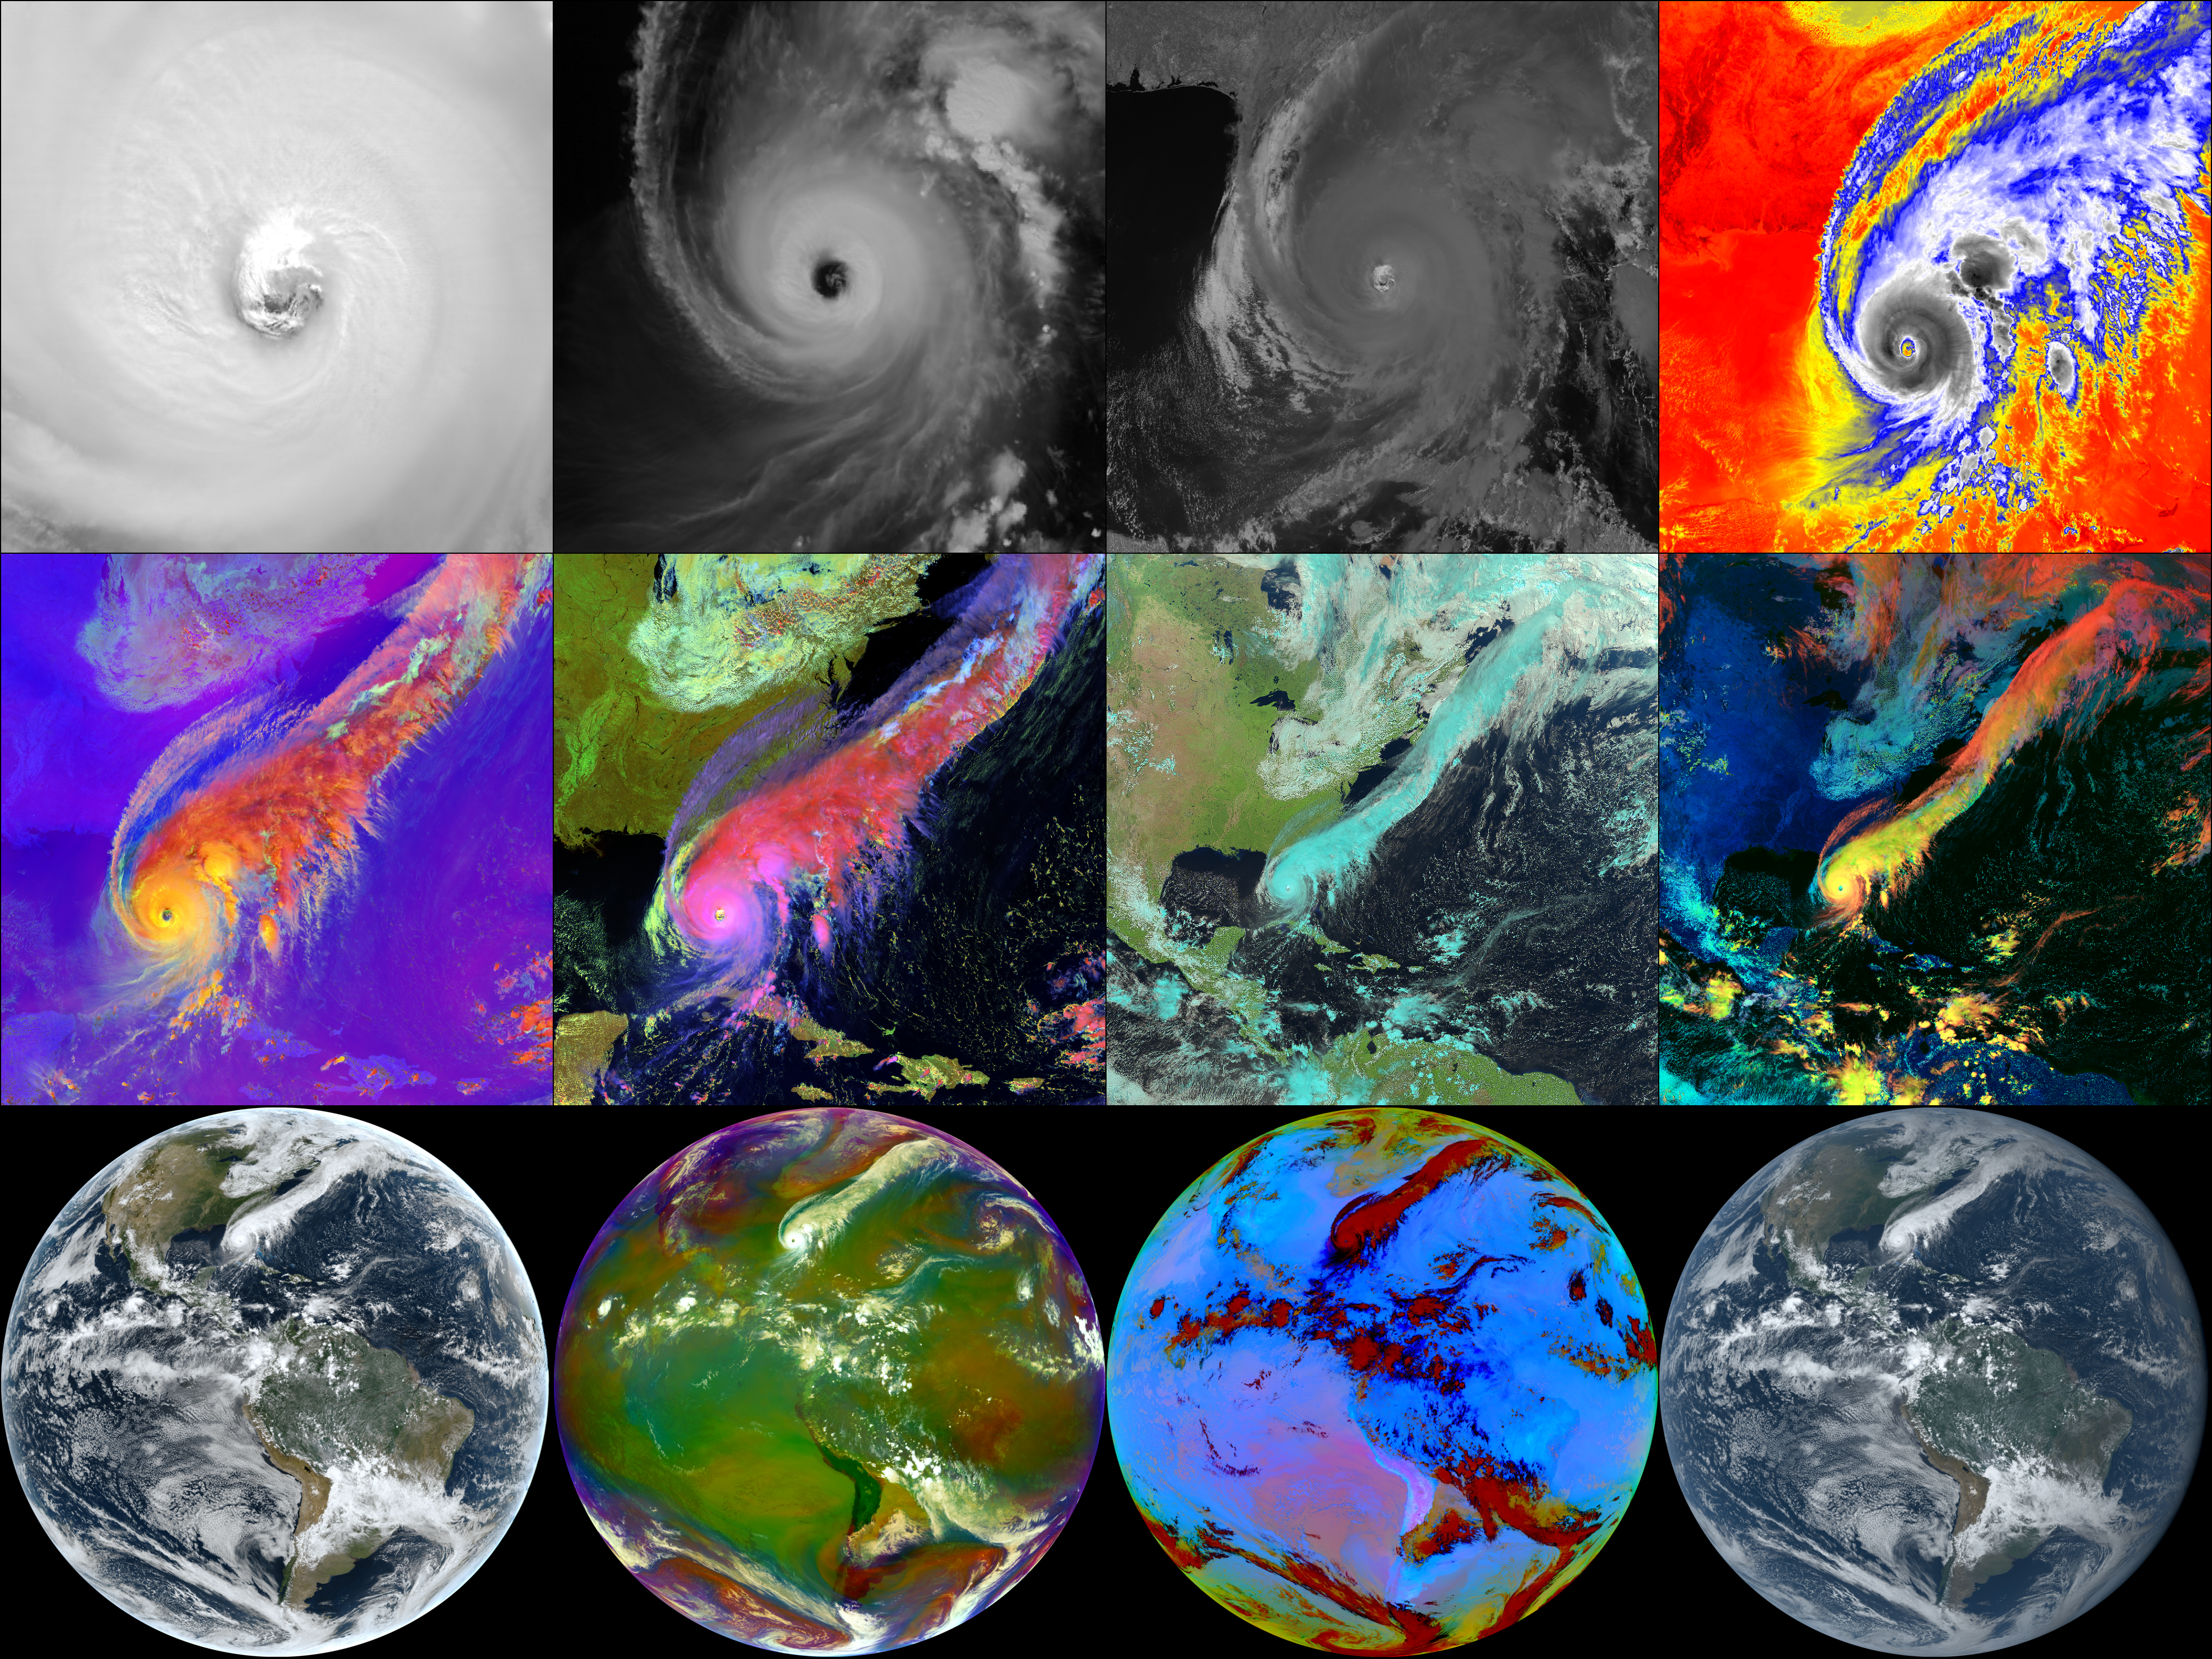
Multi-panel Image at Landfall
This multi-panel image shows a number of GOES-16 ABI spectral bands, or band composites when Hurricane Ian made landfall. The upper left image is the finest spatial resolution, while the last row showing full disk scale imagery.
GOES-16 ABI images from 18 UTC on September 28, 2022.


