The animation above (from the CSPP Geosphere site — click here for a direct link to the animation) shows True Color imagery (daytime) and Night Microphysics RGB (nighttime) from 2310 on 6 October through 0540 UTC on 7 October 2022 in 10-minute time-steps.
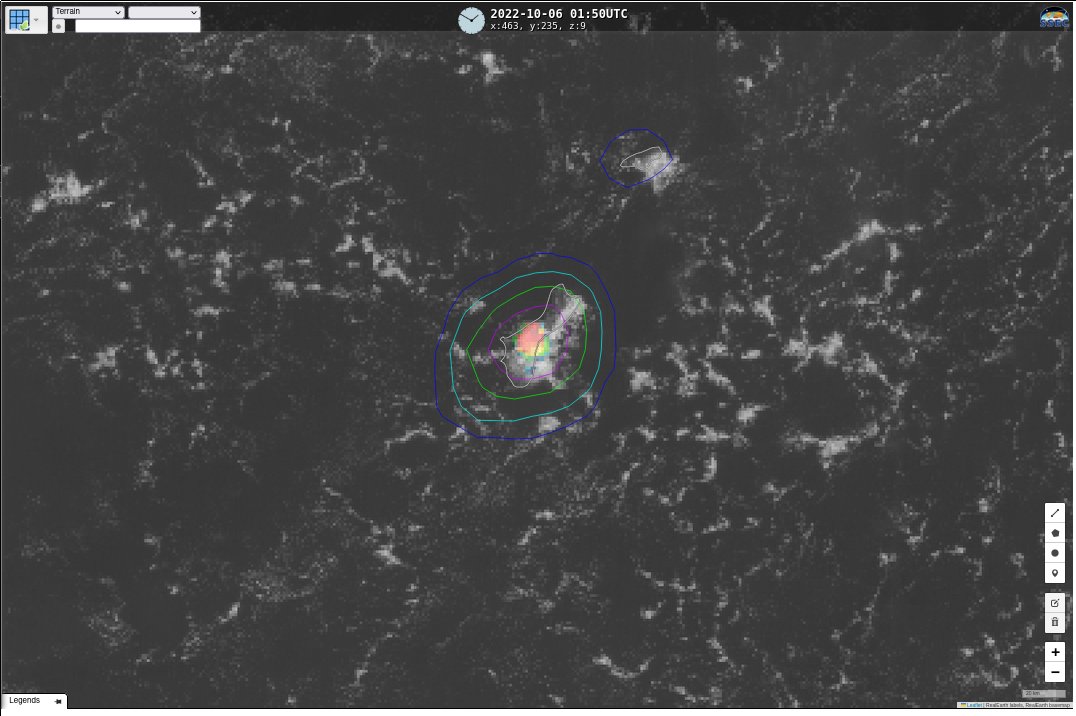
Convection developed over southwest Arizona after noon on 6 October, and the outflow boundary that developed generated a haboob that propagated from the Imperial and Coachella Valleys into San Diego County, California, and resulted in at least one Dust Storm Warning from the NWS in San Diego (The NWS San Diego Twitter Feed has plenty of surface-based images of the dust). How well does the dust show up in the true-color imagery above? Imagery before 0000 UTC on the 7th suggest dust, and likely even a linear feature at the leading edge of the dust, over the central part of extreme southern California, even though the background is about the same color as the dust cloud that is moving over it. Zoomed in, however, below, the dust feature is indeed distinct!
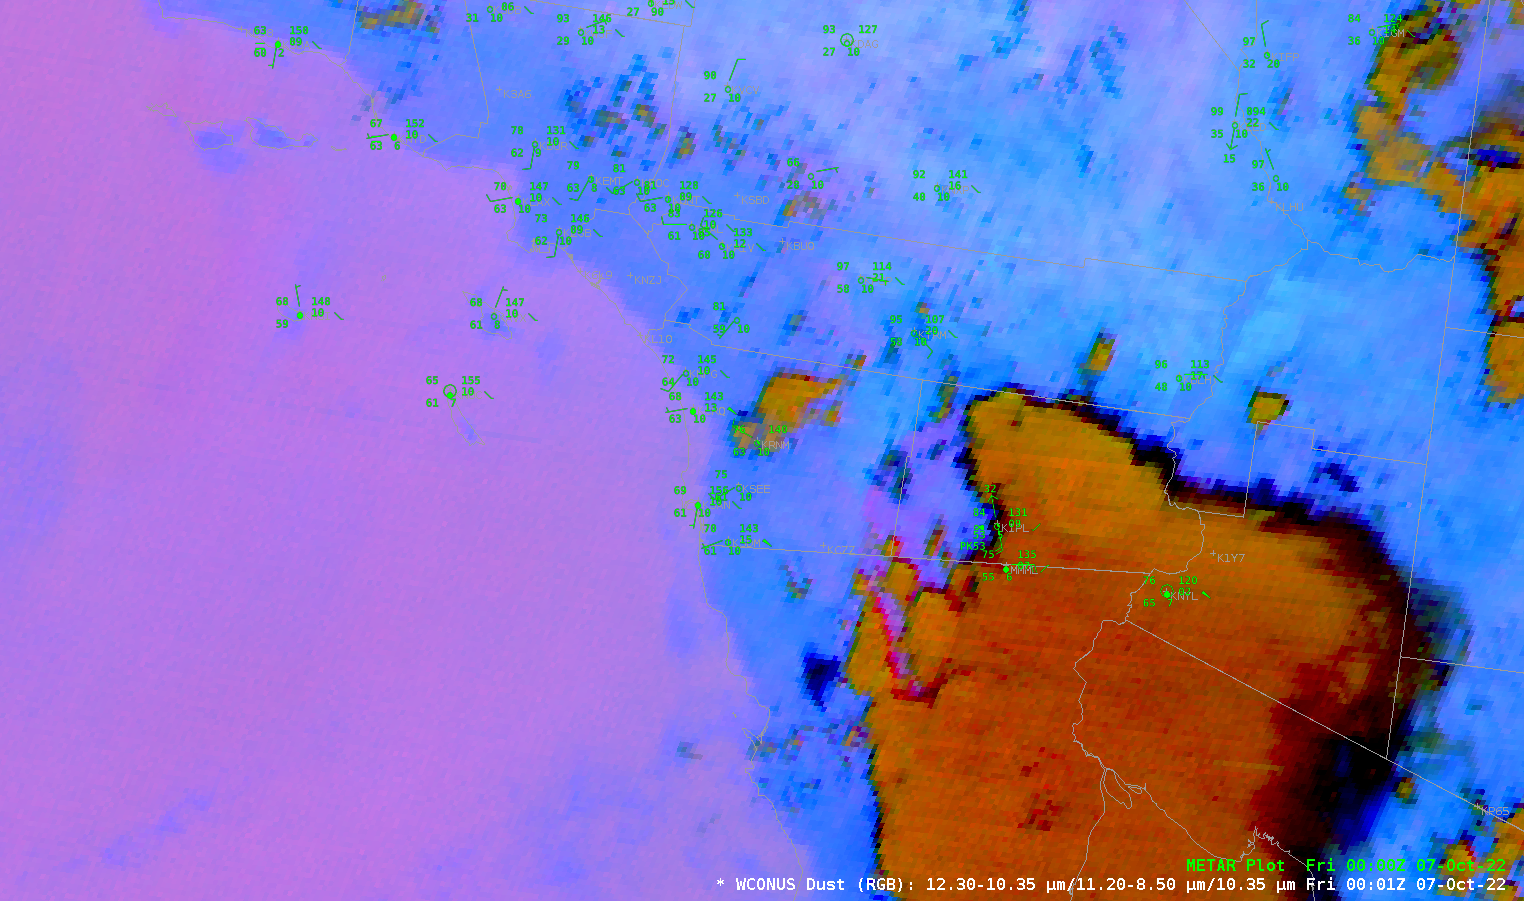
Did the GOES-West Dust RGB capture this wind event? Somewhat. The animation below shows the Dust RGB plotted with surface observations that testify to the vigor of the outflow boundary. Dust should show up as bright pink/magenta in the RGB, and there are some small regions where that color is apparent. Information on the Dust RGB is available here and here. For this case, True-color imagery better identifies the dust than does the Dust RGB.
After sunset, the ability to track the dust (in the visible) is gone, and the dust RGB also loses its signal. The focus of attention can then shift in the animation at the top of the blog post to the very interesting scouring of the low clouds along the northwest Mexican coast. Dry continental air moves over the ocean (in the form of an outflow boundary from decaying convection over the land). Mixing of this dry air with the marine boundary layer occurs, causing evaporation of clouds. The bright cyan enhancement in the Night Microphysics depicts low clouds. As the clouds evaporate, the purple enhancement that replaces cyan shows the underlying sea surface. Notice also the ripples in the cyan enhancement showing gravity waves propagating along the top of the boundary layer stratus ahead of the outflow boundary!
View only this post Read Less


