This website works best with a newer web browser such as Chrome, Firefox, Safari or Microsoft
Edge. Internet Explorer is not supported by this website.
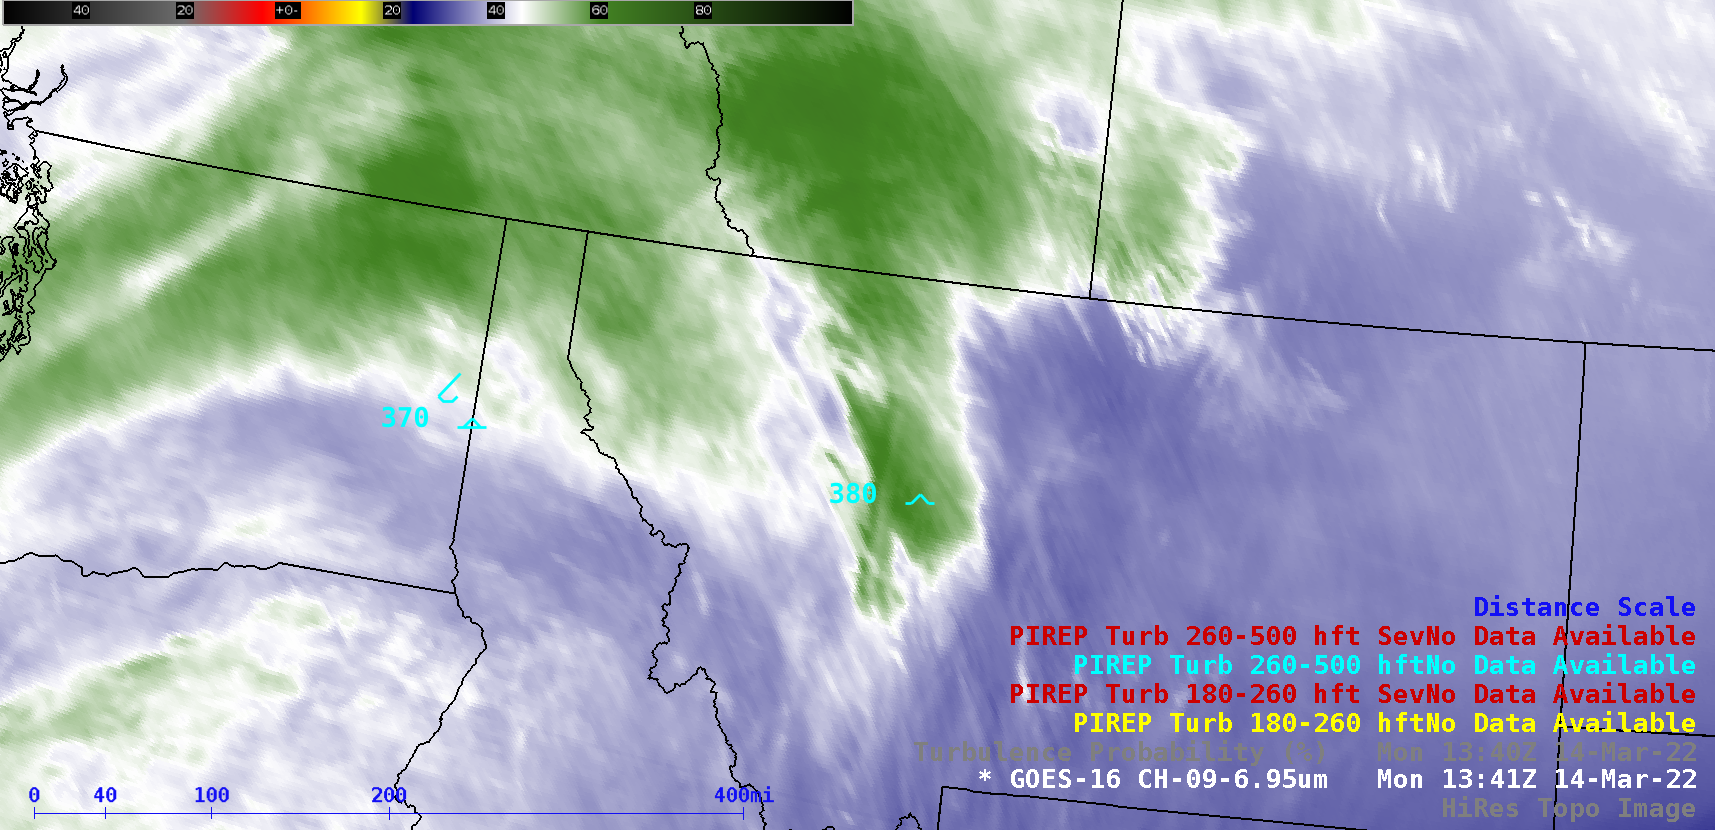
GOES-16 (GOES-East) Mid-level Water Vapor (6.9 µm) images along with a Turbulence Probability product (above) showed the formation of a banner cloud in northwestern Montana on 14 March 2022 — this orographic cloud feature appeared to be anchored to the Lewis Range and Sawtooth Range, which rise to elevations of 8,000-9,000 feet. The Probability of... Read More
GOES-16 Mid-level Water Vapor (6.9 µm) images + plots of pilot-reported turbulence, with and without an overlay of Turbulence Probability [click to play animated GIF | MP4]
GOES-16 (GOES-East) Mid-level Water Vapor (6.9 µm) images along with a Turbulence Probability product (above) showed the formation of a banner cloud in northwestern Montana on 14 March 2022 — this orographic cloud feature appeared to be anchored to the Lewis Range and Sawtooth Range, which rise to elevations of 8,000-9,000 feet. The Probability of Moderate or Greater (MOG) Turbulence correctly peaked at values of 70-80% during the course of the day in the general vicinity of the banner cloud — including around the time of a pilot report of Moderate Turbulence at 38,000 feet at 1341 UTC.
A GOES-16 Cloud Top Height derived product (below) indicated that the banner cloud tops were in the 37,000-40,000 feet range (darker blue enhancement) — the altitude of many pilot reports of turbulence that day.
GOES-16 Cloud Top Height derived product, with plots of pilot-reported turbulence [click to play animated GIF | MP4]
On March 14, 2022 NOAA‘s GOES-T becoming GOES-18 (once the satellite obtained the geostationary orbit). Let’s celebrate both pi day and GOES-18 with a look back at the launch. GOES-17 ABIGOES-17 ABI provided 30-sec imagery, as shown in these blog posts by Scott Bachmeier and Bill Line. Of course GOES-17 ABI was... Read More
On March 14, 2022 NOAA‘s GOES-T becoming GOES-18 (once the satellite obtained the geostationary orbit). Let’s celebrate both pi day and GOES-18 with a look back at the launch.
GOES-17 ABI
GOES-17 ABI provided 30-sec imagery, as shown in these blog posts by Scott Bachmeier and Bill Line. Of course GOES-17 ABI was continuing to provide Contiguous US and Full Disk scans.
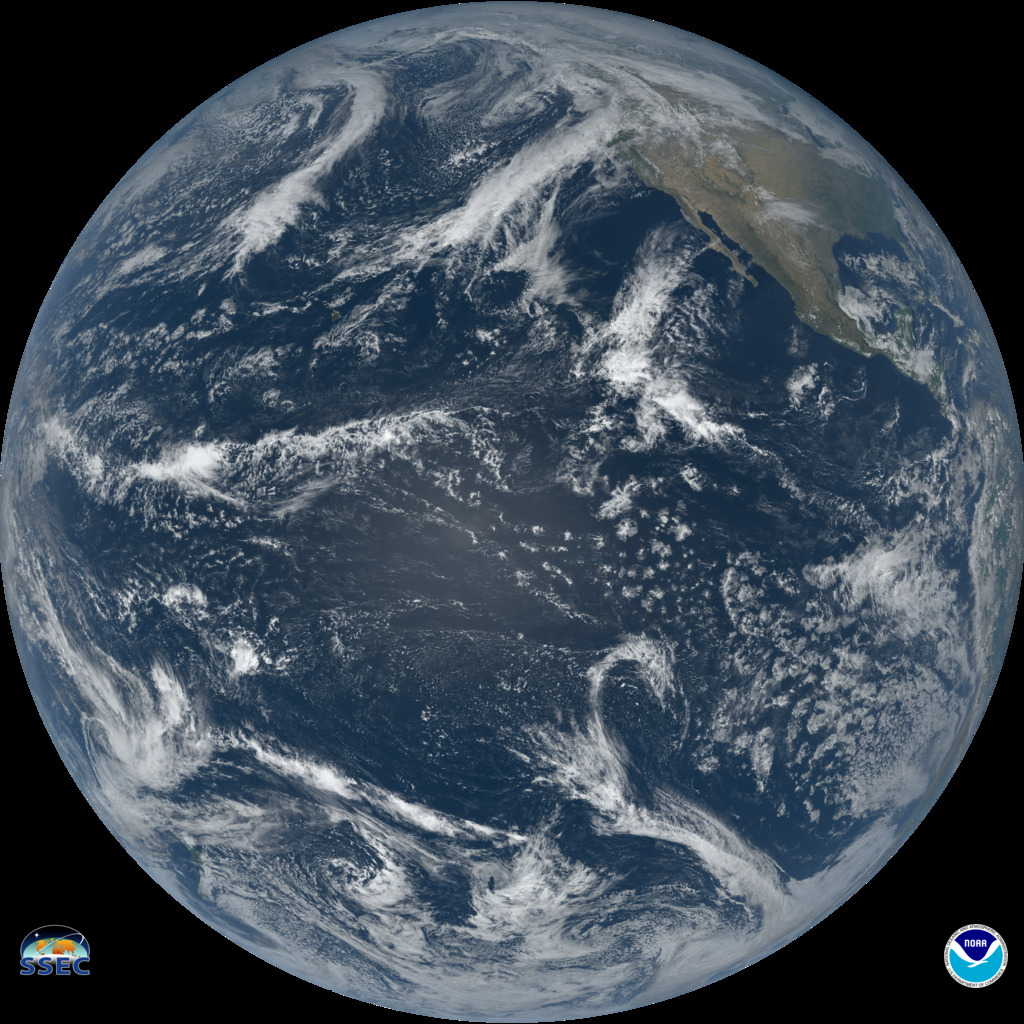
The GOES-17 ABI Full Disk CIMSS true color composite image from March 1, 2022 with a 21:40 UTC start time.
The above image is *highly* sub-sampled, roam around this full resolution (very large) GOES-17 full disk image. In this full resolution image, can you zoom and roam to see the GOES-T rocket plume?
GOES-17 ABI 30-sec imagery of the GOES-T launch: visible bands, CIMSS true color and true color.
Strong surface tradewinds over Guam, and the dry season over Guam, combined on 14 March to allow short-lived wildfires. The shortwave-infrared imagery above, color-enhanced so white pixels are warmest, shows occasional flare-ups over the southern half of the island between 2200 and 0400 UTC, and then again closer to 0600... Read More
Himawari-8 imagery shortwave infrared (3.89 µm) imagery, 1710 UTC on 13 March 2022 to 0630 UTC on 14 March 2022
Strong surface tradewinds over Guam, and the dry season over Guam, combined on 14 March to allow short-lived wildfires. The shortwave-infrared imagery above, color-enhanced so white pixels are warmest, shows occasional flare-ups over the southern half of the island between 2200 and 0400 UTC, and then again closer to 0600 UTC over central Guam (Note also how the island warms up — becomes whiter in the color enhancement used — during the day).
How strong were the surface winds that fanned the flames? ASCAT imagery from Metop-B, shown below at (shown during the day with visible imagery) shows surface winds around 15-20 knots.
ASCAT winds and Himawari-8 Band 3 visible (0.64 µm) imagery (during the day, 1131 and 2318 UTC on 13 March 2022 (Click to enlarge)
Sequential visible images can also be used to estimate wind speeds. The toggle below shows visible imagery between 0310 and 0320 UTC on 14 March. The cloud line over southern Guam moving west-southwestward towards the surrounding ocean moves about 4 nautical miles in the 10 minutes: at about 25 knots (latitude/longitude point distance separation can be computed here).
Himawari-8 Band 3 (Red Visible, 0.64 µm) imagery, 0310 and 0320 UTC on 14 March 2022 (Click to enlarge); a distance scale is included
The strong winds allowed for occasional flareups. Consider the animation below between 0610 and 0630 UTC of the shortwave infrared (3.89 µm) imagery. An obvious hot spot (in white) is present at 0610 and 0620 UTC, but at 0630 UTC it has either been extinguished, or it’s been covered by clouds (or both!)
Himawari-8 Band 7 (Shortwave Infrared, 3.89 µm) imagery, 0610, 0620 and 0630 UTC on 14 March 2022 (Click to enlarge)
Himawari-8 Level 2 products diagnose fire hot spots, and are available from this website. A hotspot is diagnosed at 0600, 0610 and 0620 UTC on 14 March (no hotspot was diagnosed at 0630 UTC). Work is ongoing to get this level 2 Product (and others, such as derived motion wind vectors) into AWIPS.
Diagnosed wild fires from Himawari-8, 0600-0620 UTC on 14 March 2022 (Click to enlarge)
AWIPS imagery in this post was created using the NOAA/NESDIS TOWR-S AWIPS in the cloud instance.
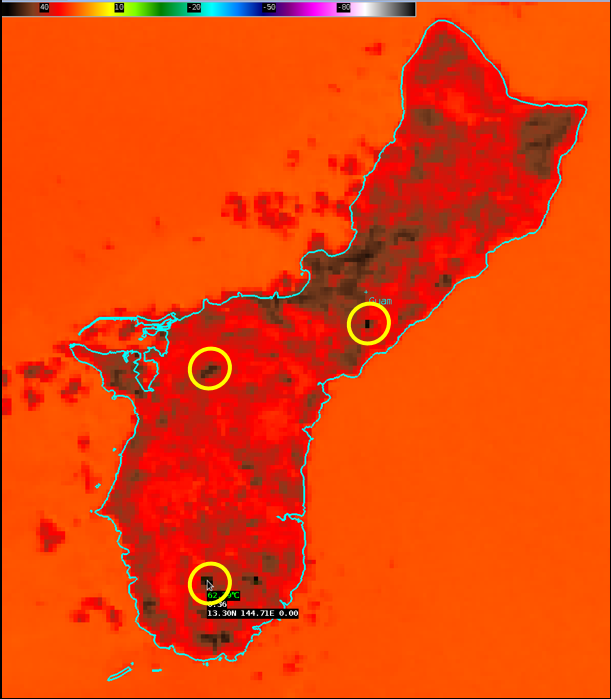
Brandon Bukunt, WFO GUM, supplied the VIIRS shortwave infrared (3.74 µm) imagery (from data downloaded from the Direct Broadcast antenna at the office, and processed with CSPP Software) below. Three wildfires are circled. Note the brightness temperature of 63 C over southern Guam!
VIIRS I04 (3.74 µm) imagery, 13 March 2022, ca. 0800 UTC (Click to enlarge)
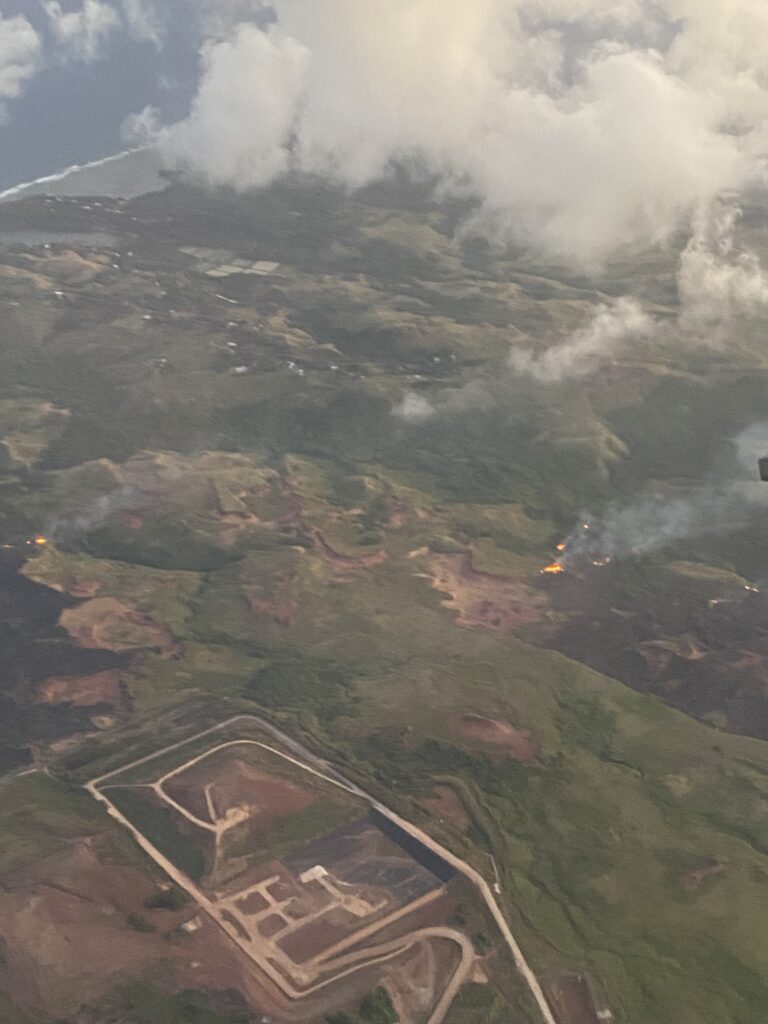
The photograph below (courtesy Eric Lau) from a plane landing at Guam shows fires burning.
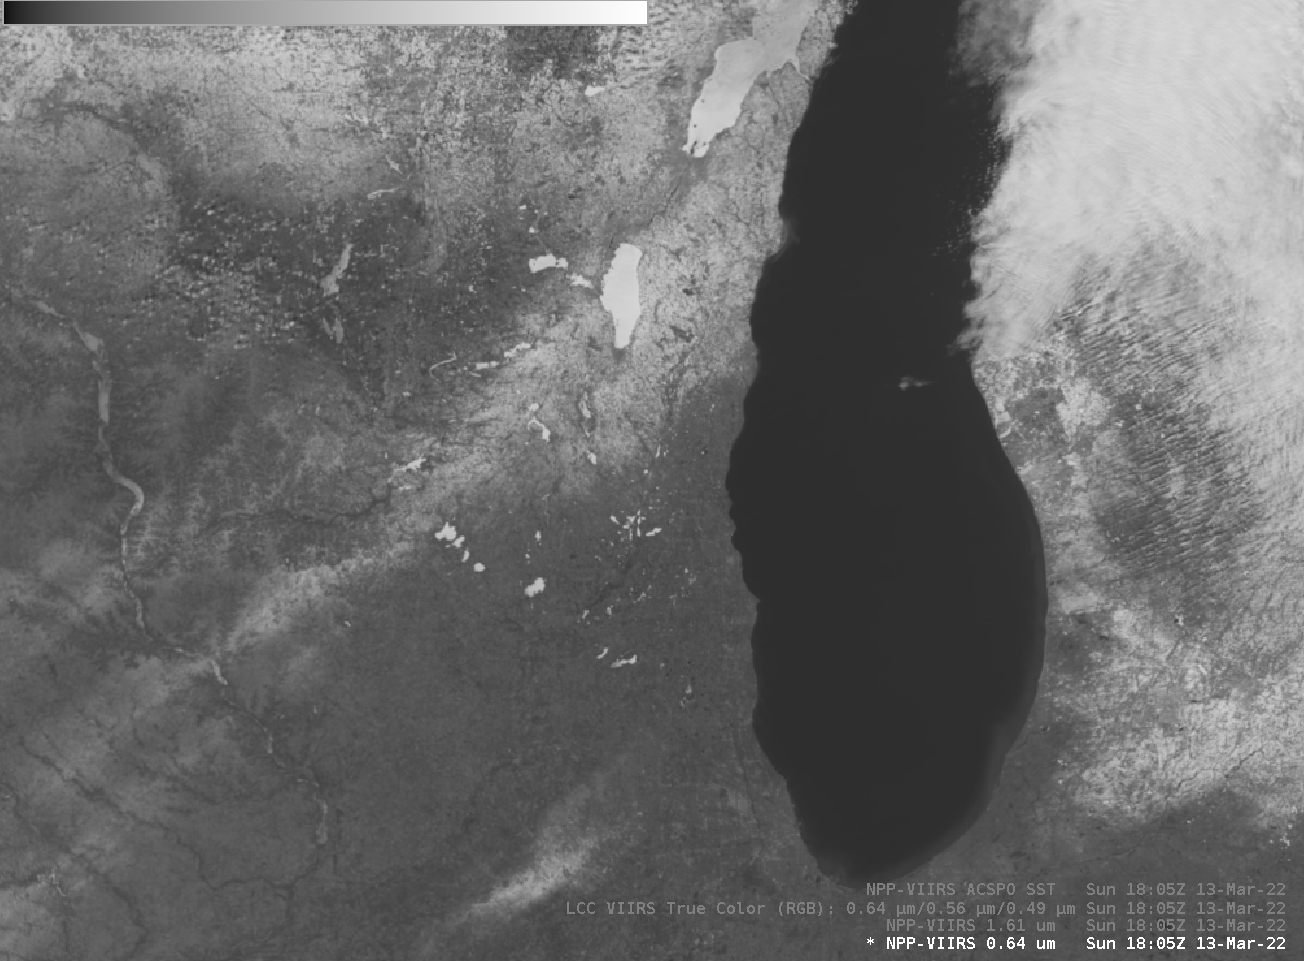
Clear skies over the upper Midwest allowed an unobstructed view of the surface for VIIRS instrument on NOAA-20 and Suomi NPP. An ice-free Lake Michigan is apparent. Small patches of snow remain over Iowa, Illinois and Wisconsin (ice-covered lakes remain as well); snow-covered surfaces and snow and ice-covered lakes appear... Read More
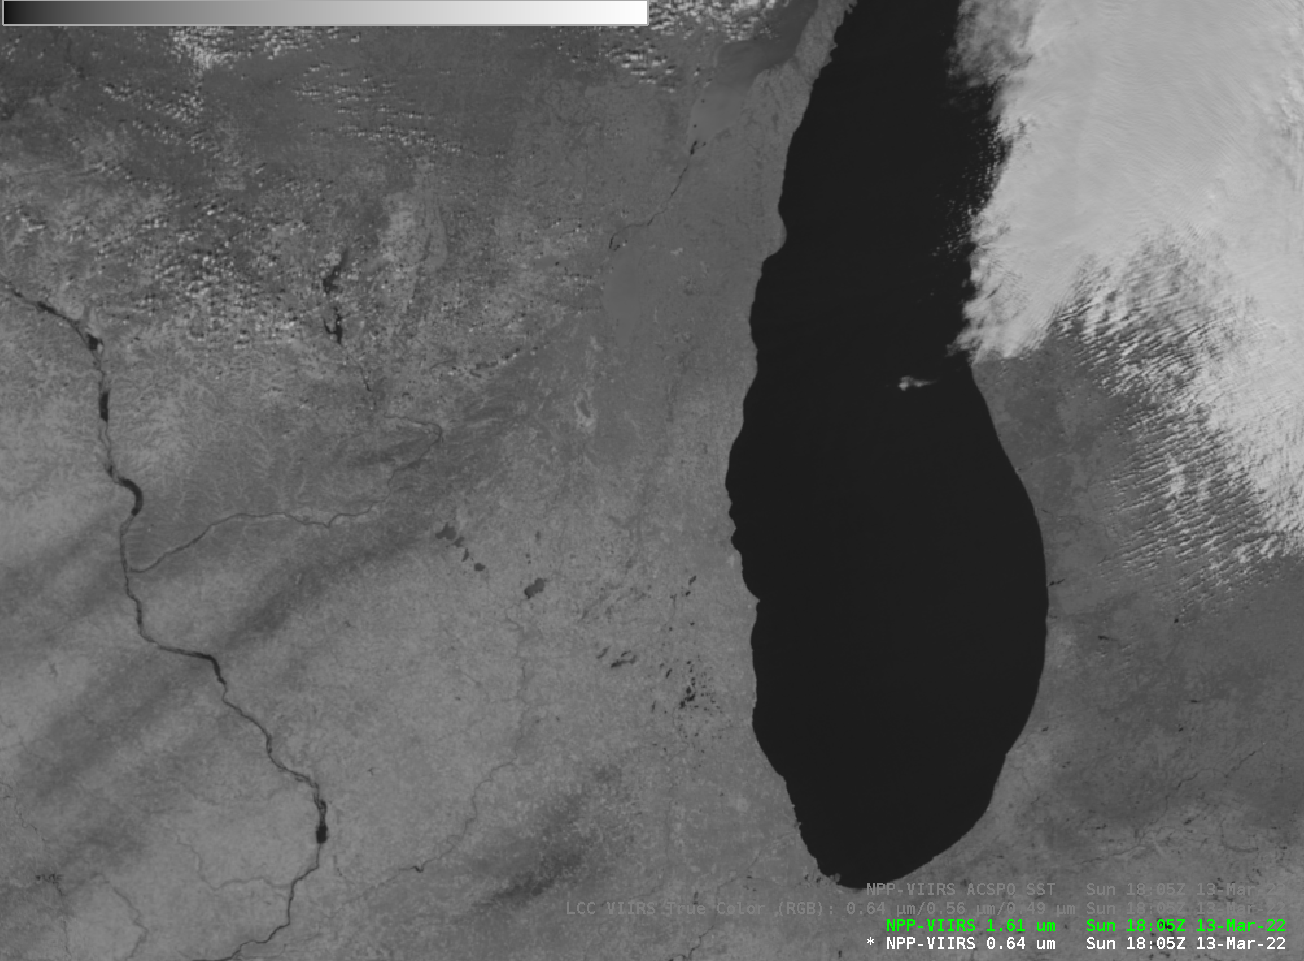
I01 (0.64 µm) and I03 (1.61 µm) bands from Suomi NPP, 1805 UTC on 13 March 2022 (Click to enlarge)
Clear skies over the upper Midwest allowed an unobstructed view of the surface for VIIRS instrument on NOAA-20 and Suomi NPP. An ice-free Lake Michigan is apparent. Small patches of snow remain over Iowa, Illinois and Wisconsin (ice-covered lakes remain as well); snow-covered surfaces and snow and ice-covered lakes appear bright white in the visible (0.64 µm) imagery, but dark in the near-infrared 1.61 µm because solar radation at 1.61 µm is absorbed by ice.
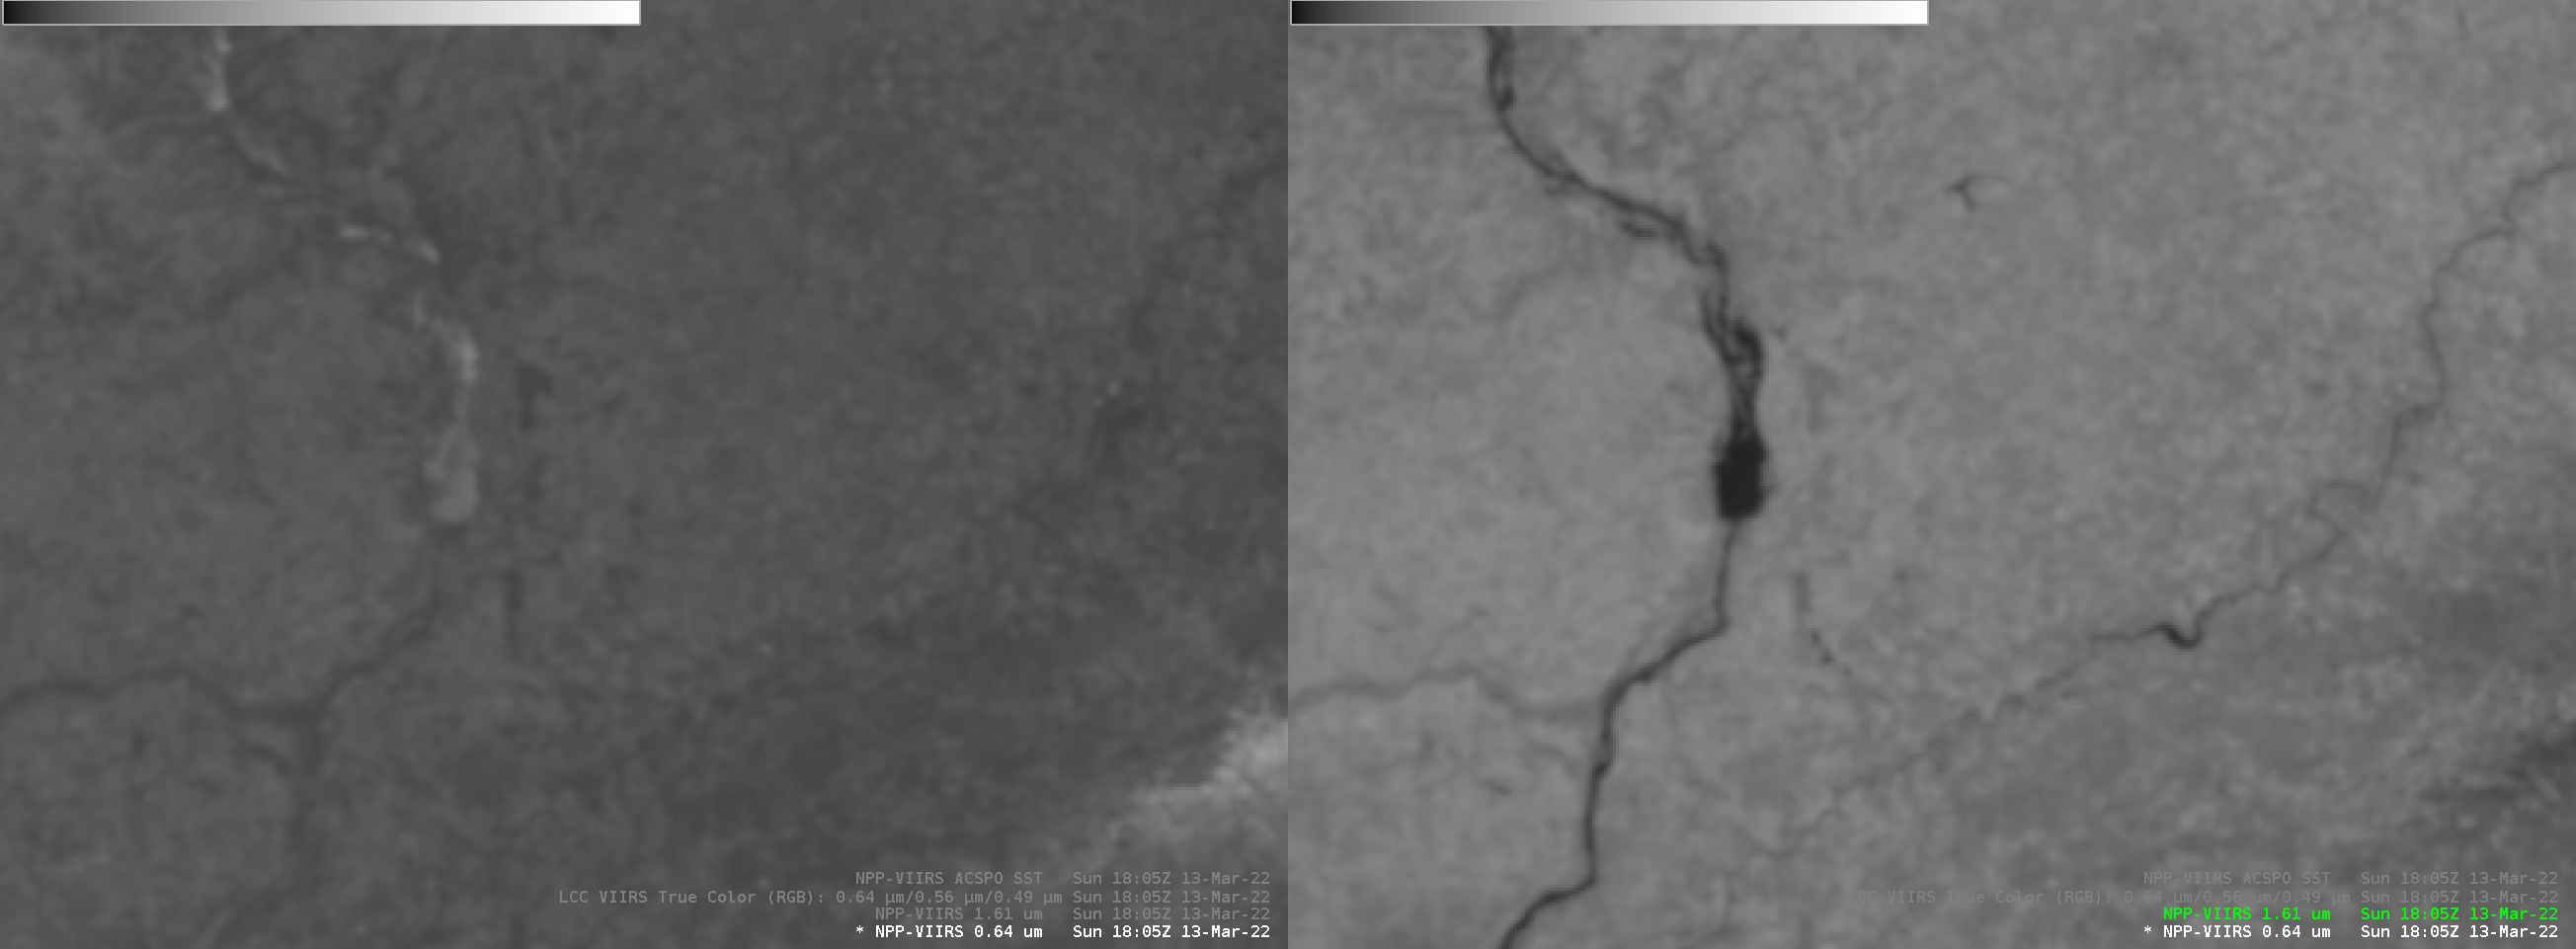
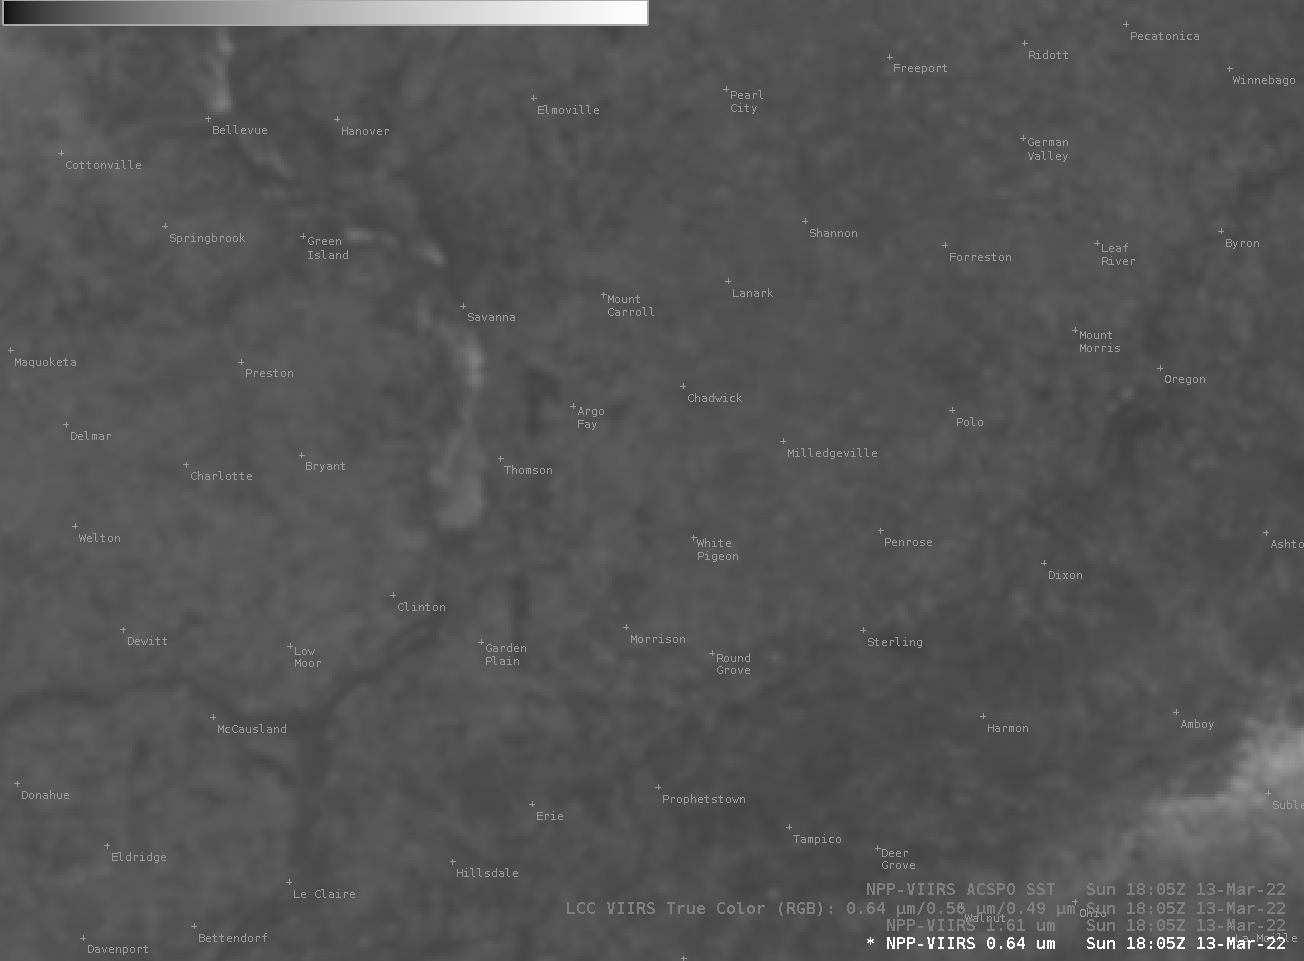
These images can be used to deduce where the Mississippi River is ice-free. The zoomed-in images below (0.64 µm on the left, 1.61 µm on the right), shows ice (mostly white in the visible, dark in the near-infrared 1.61 µm) north of Lock #13 at Fulton (Click here to see the visible image with city names). The river south of the Lock and Dam is dark in the near-infrared because of strong absorption of radiation by water (land is more reflective of 1.61 µm radiation than of 0.64 µm radiation, so there is greater contrast between land and water). The smaller reflectivity south of the Dam in the visible suggests open water.
I01 (0.64 µm, left) and I03 (1.61 µm, right) VIIRS bands, 1805 UTC on 13 March 2022 (Click to enlarge)
Clear skies also allowed for an accurate estimate of lake-surface temperatures of Lake Michigan, shown in a toggle below with true-color imagery. The warmest surface temperature: 39o F.
VIIRS True-Color imagery, and ACSPO SSTs, 1805 UTC on 13 March 2022 (Click to enlarge)
VIIRS imagery and products are available from CIMSS via an LDM feed.


