
1-minute Mesoscale Domain Sector GOES-16 (GOES-East) True Color RGB images from the CSPP GeoSphere site (above) showed blowing dust (shades of tan) along and in the wake of a strong cold front that was moving southward across the High Plains on 02 December 2022.A Suomi-NPP VIIRS True Color RGB image valid at 1905... Read More
GOES-16 True Color RGB images [click to play MP4 animation]
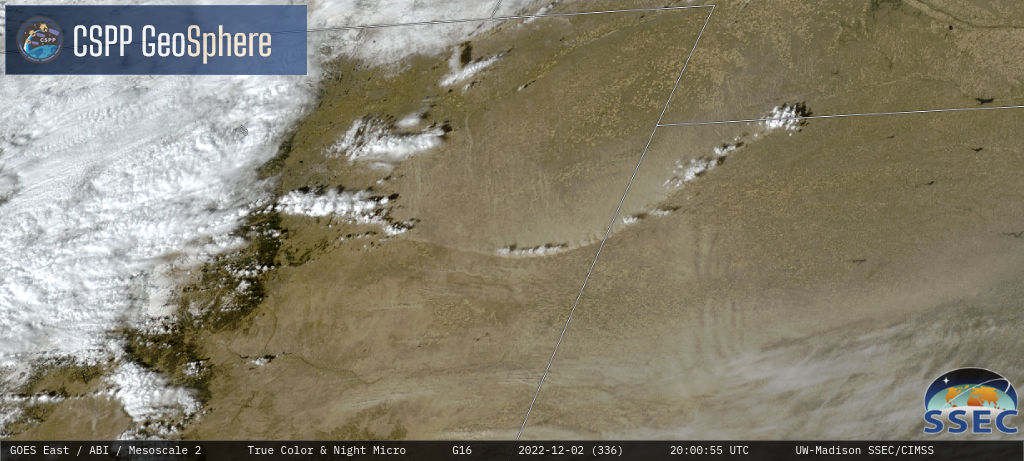
1-minute Mesoscale Domain Sector GOES-16
(GOES-East) True Color RGB images from the
CSPP GeoSphere site
(above) showed blowing dust (shades of tan) along and in the wake of a strong cold front that was moving southward across the High Plains on
02 December 2022.
Suomi-NPP VIIRS True Color RGB image, valid at 1905 UTC [click to enlarge]
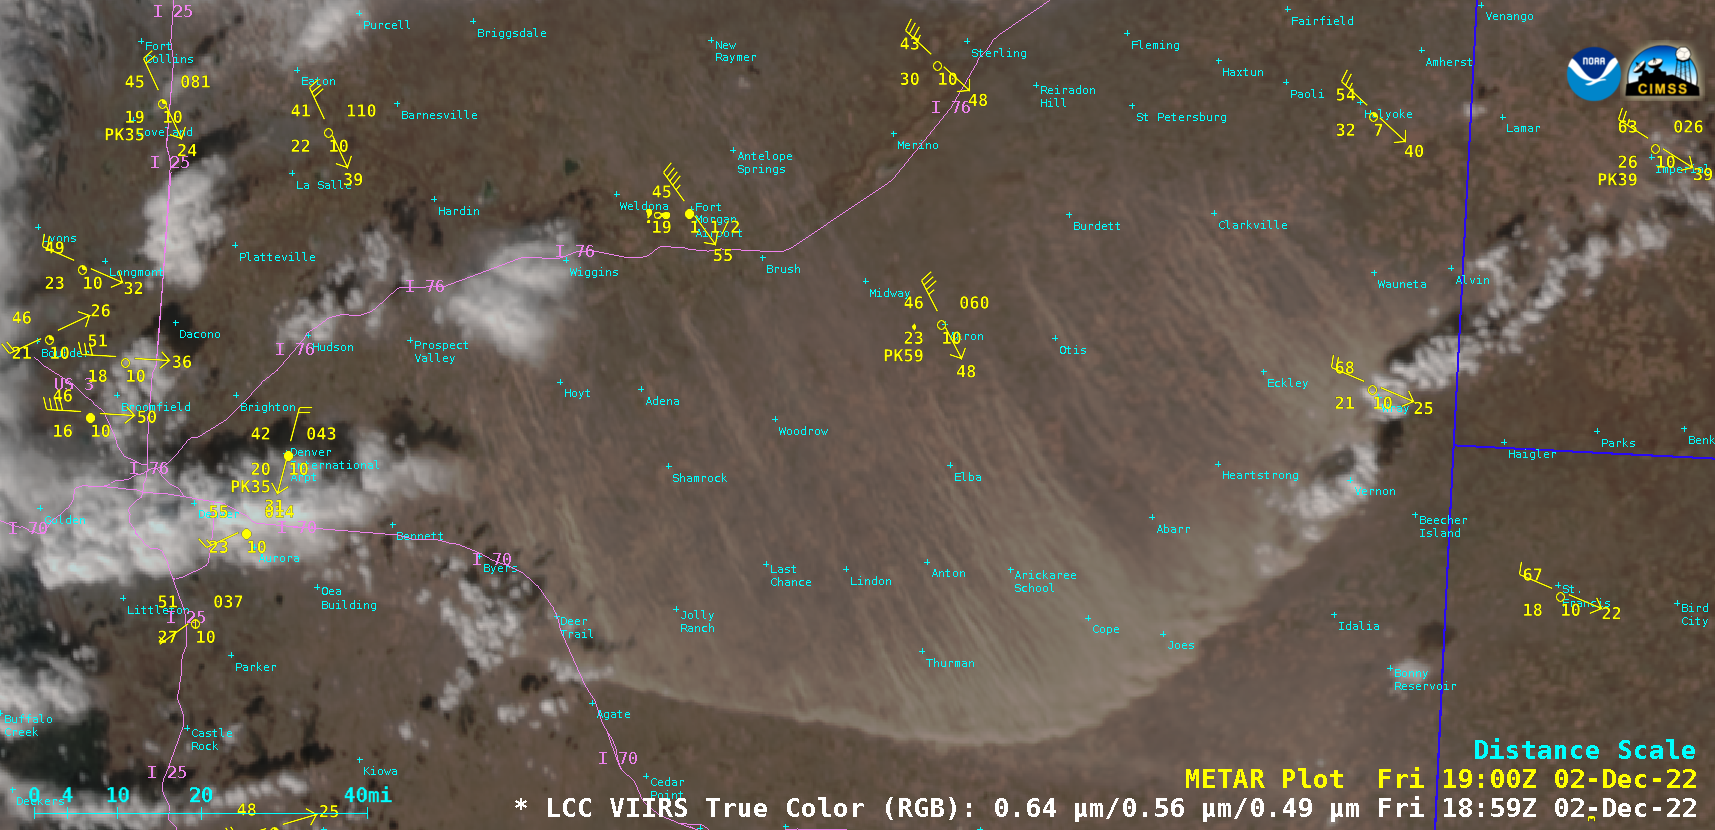
A Suomi-NPP VIIRS True Color RGB image valid at 1905 UTC
(above) provided a higher-resolution view of the blowing dust. About an hour prior to this image time, the peak wind gust at Akron, Colorado was 59 knots (68 mph). A larger-scale view of 3 consecutive VIIRS True Color RGB images from Suomi-NPP and NOAA-20 is shown below. The data used to create these VIIRS images were downloaded and processed using the SSEC/CIMSS Direct Broadcast ground station.
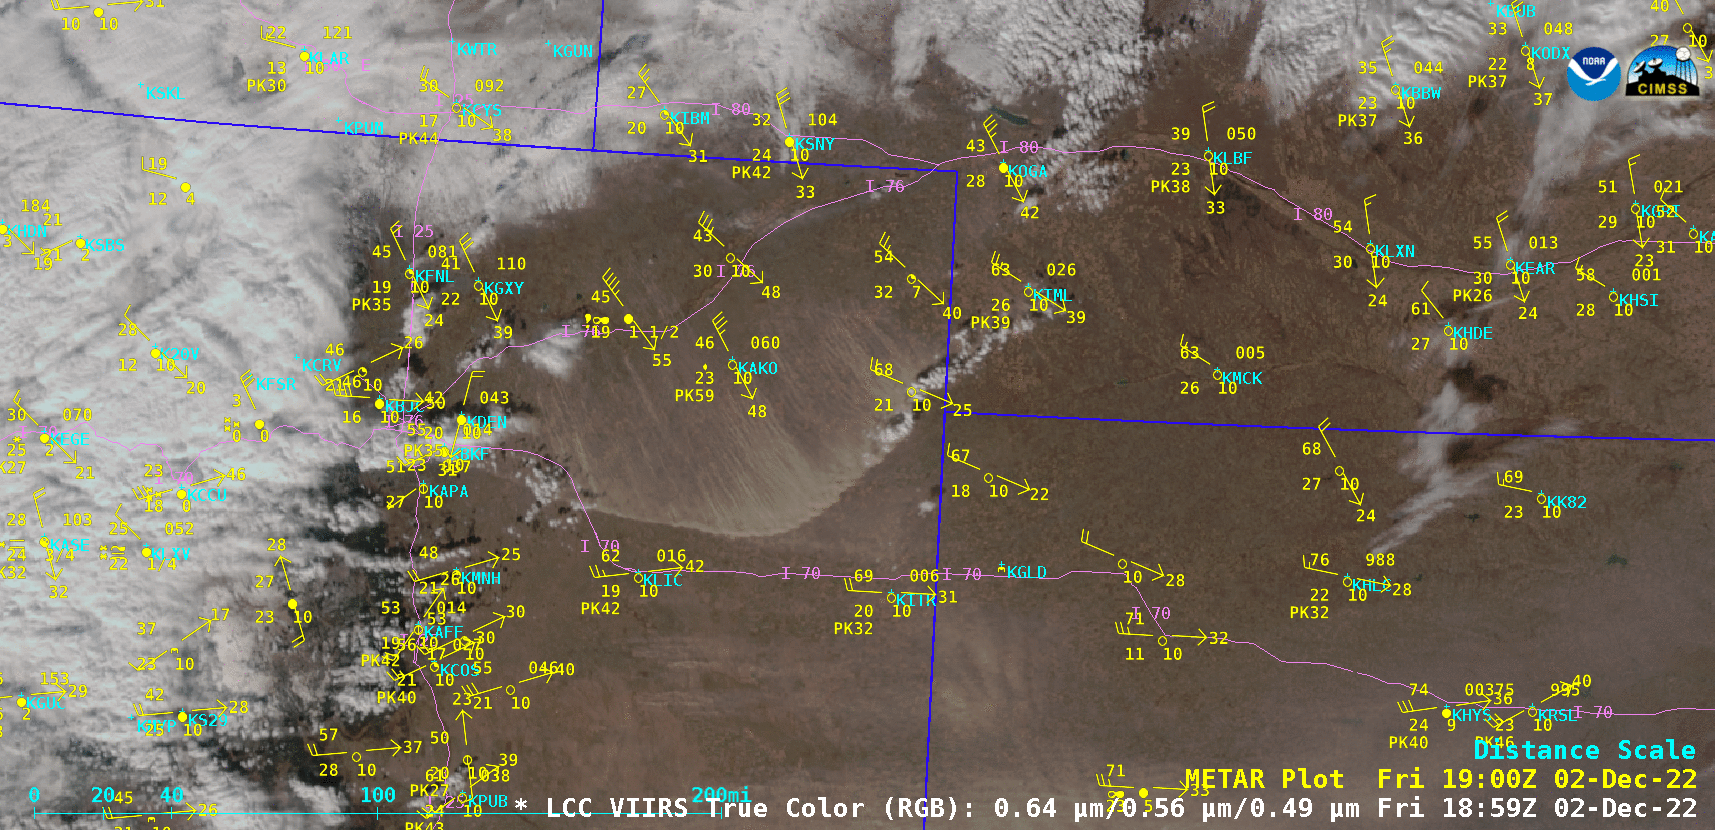
Sequence of VIIRS True Color RGB images from Suomi-NPP and NOAA-20 [click to enlarge]
1-minute GOES-16
Dust RGB images
(below) include plots of GOES-16
Derived Motion Winds (DMW) within the 775-900 hPa layer — these DMWs indicated that the airborne dust (brighter shades of pink in the RGB images) was moving southeastward at speeds of 40-52 knots (46-60 mph), in general agreement with the surface wind speeds. This blowing dust reduced the surface visibility to 1-2 miles at some locations. Peak wind gusts across northeastern Colorado are listed
here.
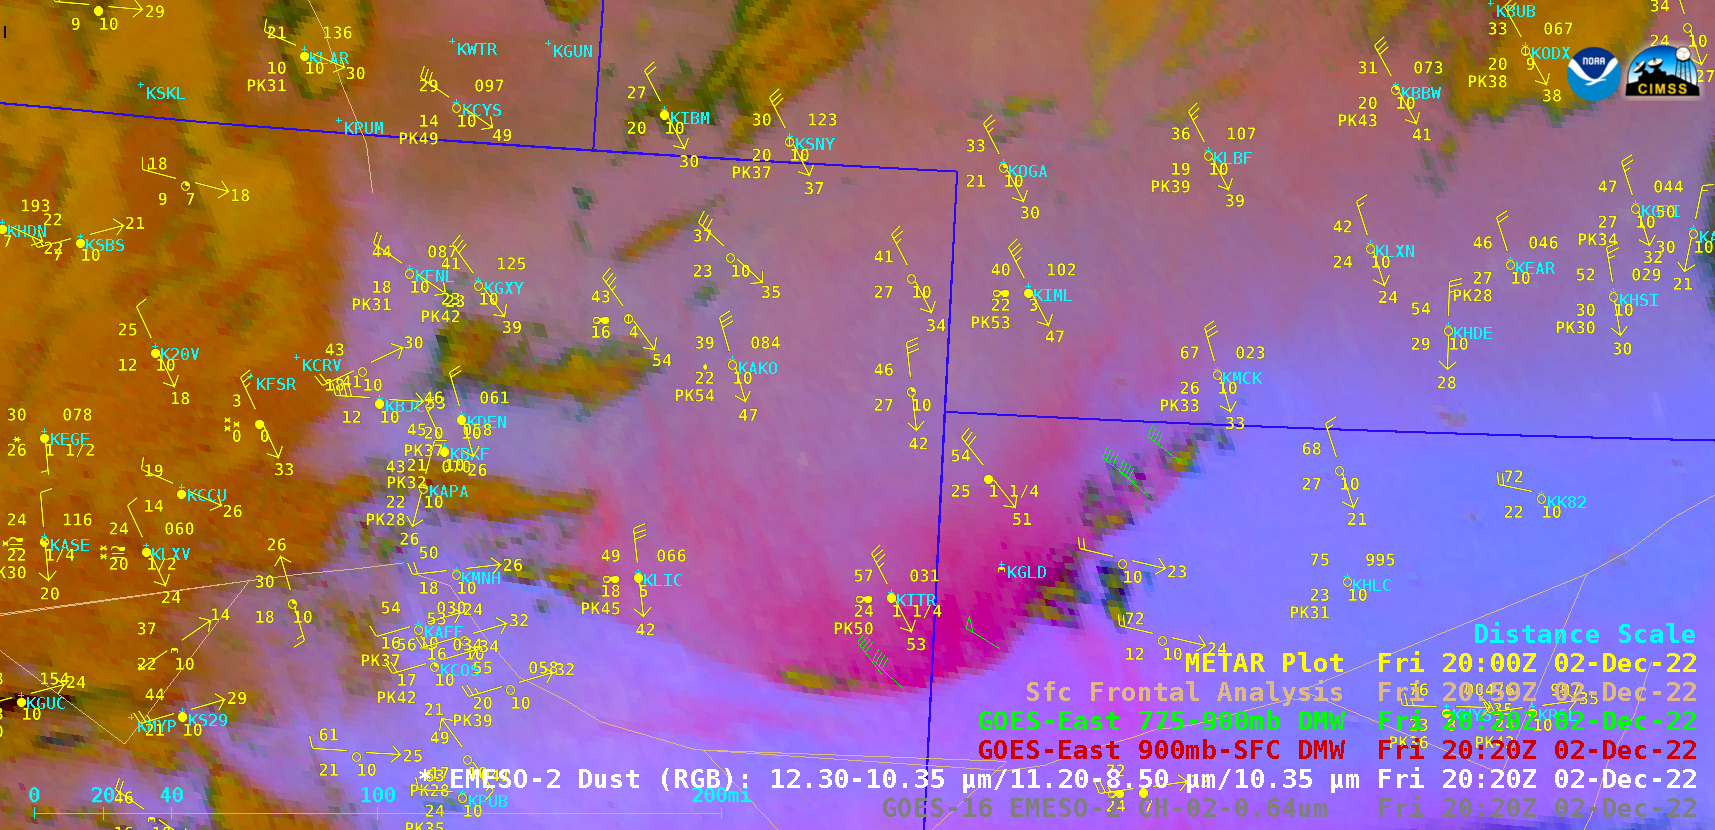
GOES-16 Dust RGB images, with GOES-16 Derived Motion Winds plotted in green and hourly surface reports plotted in yellow [click to play animated GIF | MP4]
Of note was a second post-frontal pulse of blowing dust, which began in far northeastern Colorado after 21 UTC — this pulse of blowing dust was accompanied by a short-lived drop in dew point concurrent with an increase in wind speed, as observed at Sterling (KSTK, located about 40 miles north-northwest of Akron KAKO), Akron (KAKO) and Burlington (KITR)
(below).
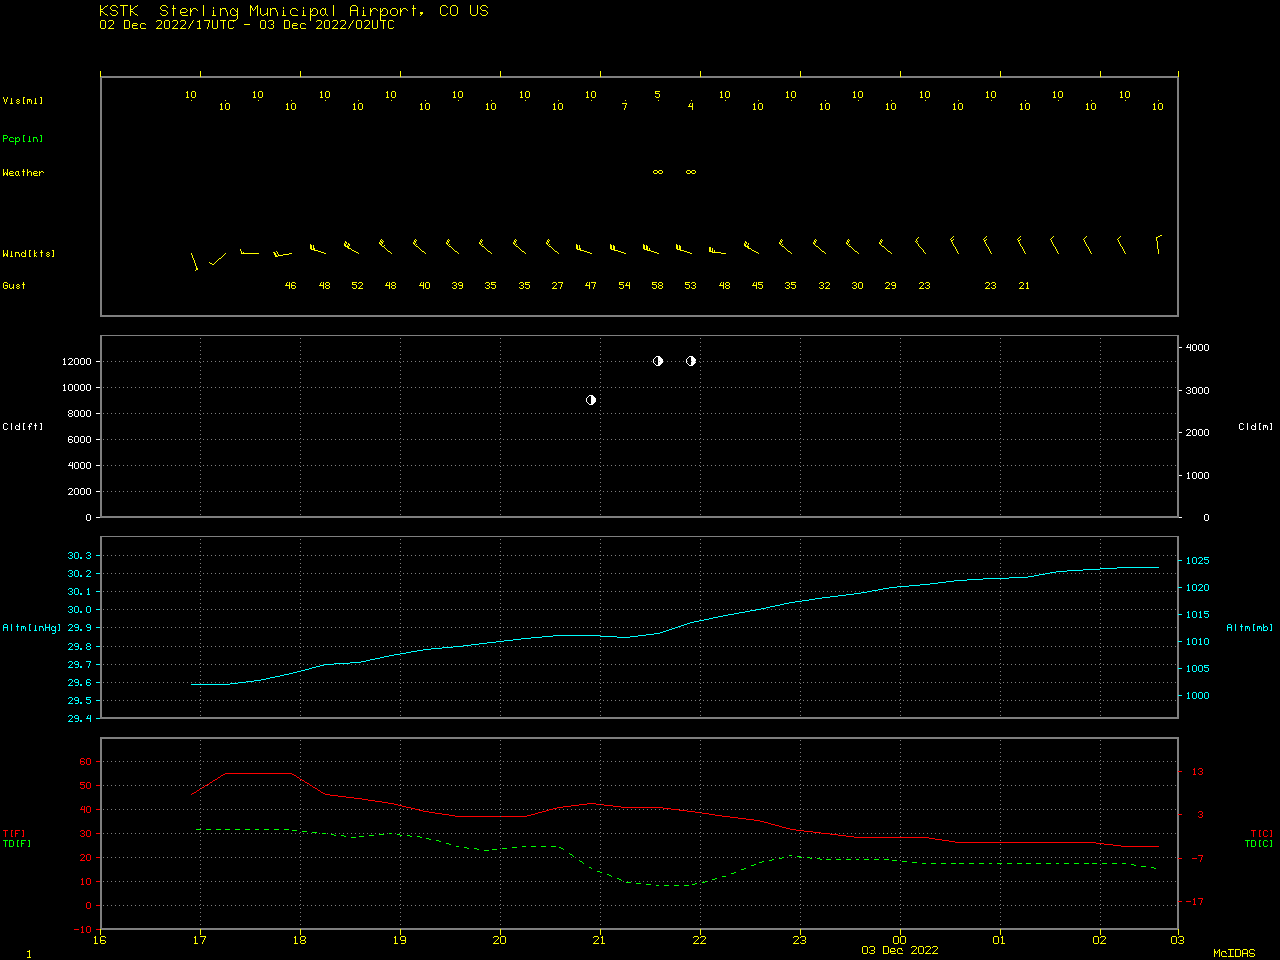
Plot of surface report data at Sterling, Colorado [click to enlarge]
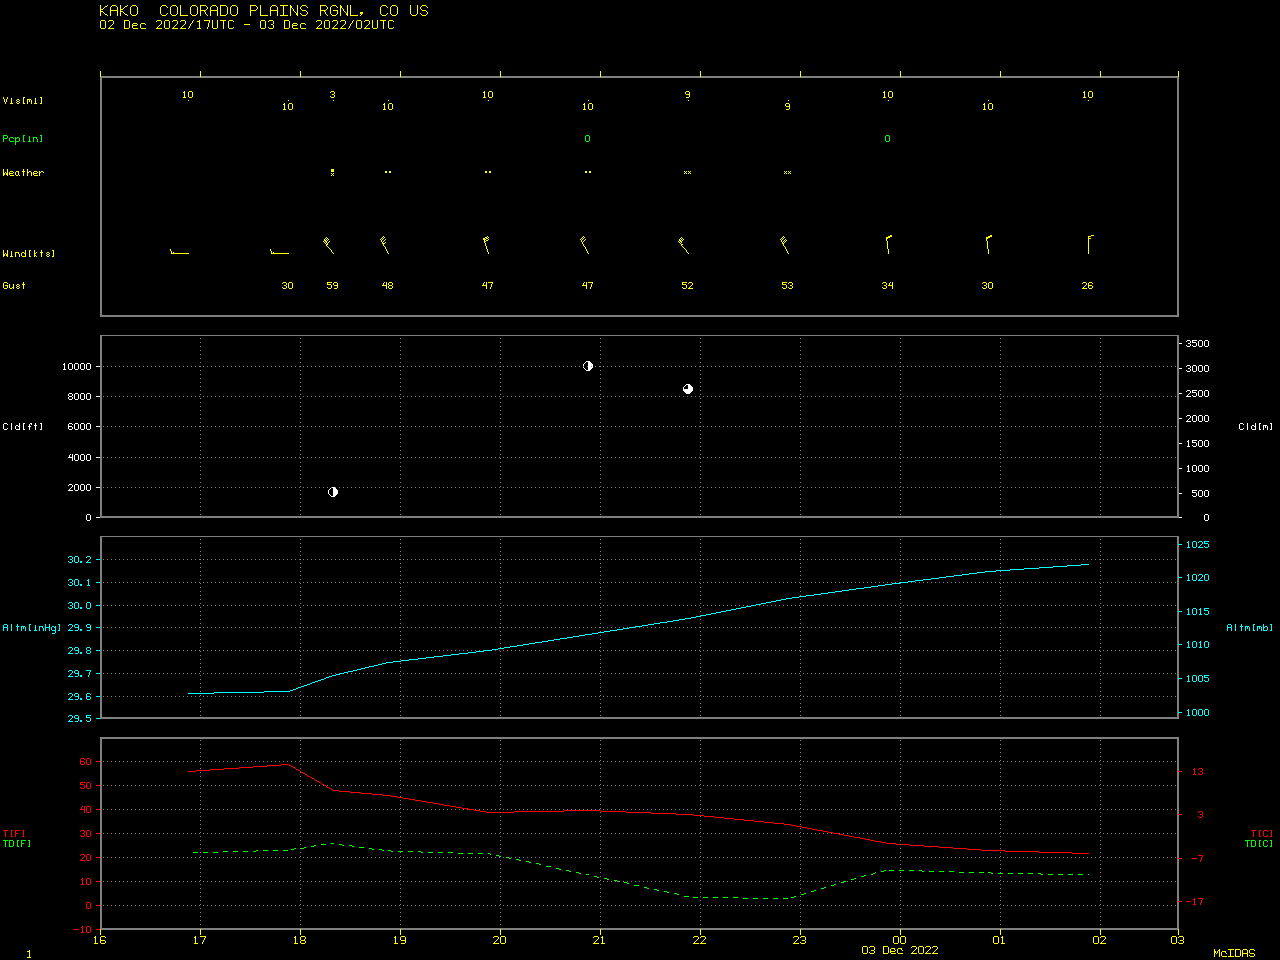
Plot of surface report data at Akron, Colorado [click to enlarge]
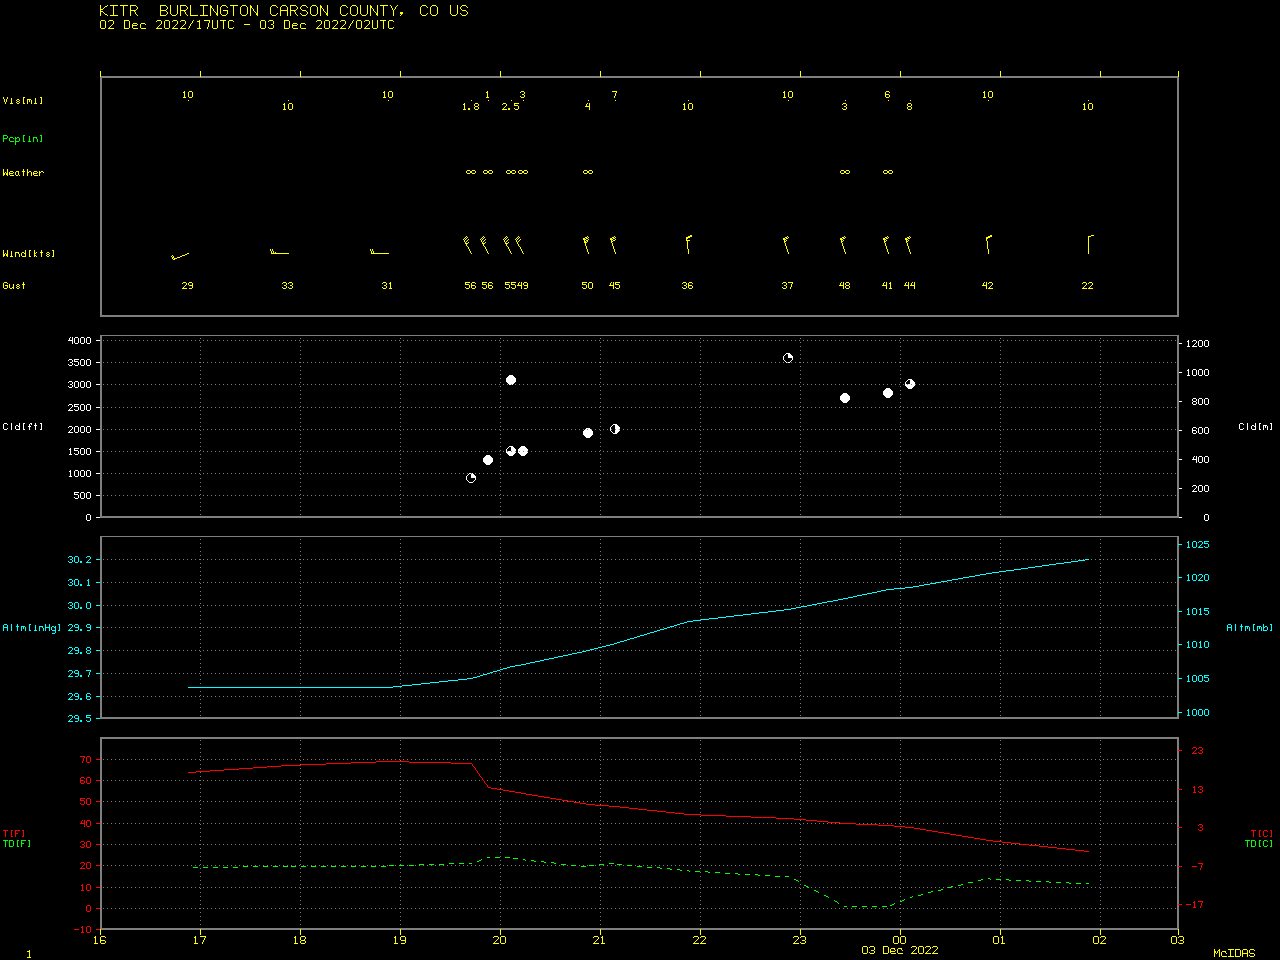
Plot of surface report data at Burlington, Colorado [click to enlarge]
View only this post
Read Less


