This website works best with a newer web browser such as Chrome, Firefox, Safari or Microsoft
Edge. Internet Explorer is not supported by this website.
This post features 2022 highlights from a polar-orbiting perspective, with a focus on U.S. scenes, most acquired by the Visible Infrared Imaging Radiometer Suite (VIIRS) flying on the Suomi-NPP and NOAA-20 satellites. Also in 2022: NOAA’s Joint Polar Satellite System (JPSS) launched the JPSS-2 satellite, renamed NOAA-21. First light imagery... Read More
This post features 2022 highlights from a polar-orbiting perspective, with a focus on U.S. scenes, most acquired by the Visible Infrared Imaging Radiometer Suite (VIIRS) flying on the Suomi-NPP and NOAA-20 satellites. Also in 2022: NOAA’sJoint Polar Satellite System (JPSS) launched the JPSS-2 satellite, renamed NOAA-21. First light imagery from this exciting fleet addition is featured in November.
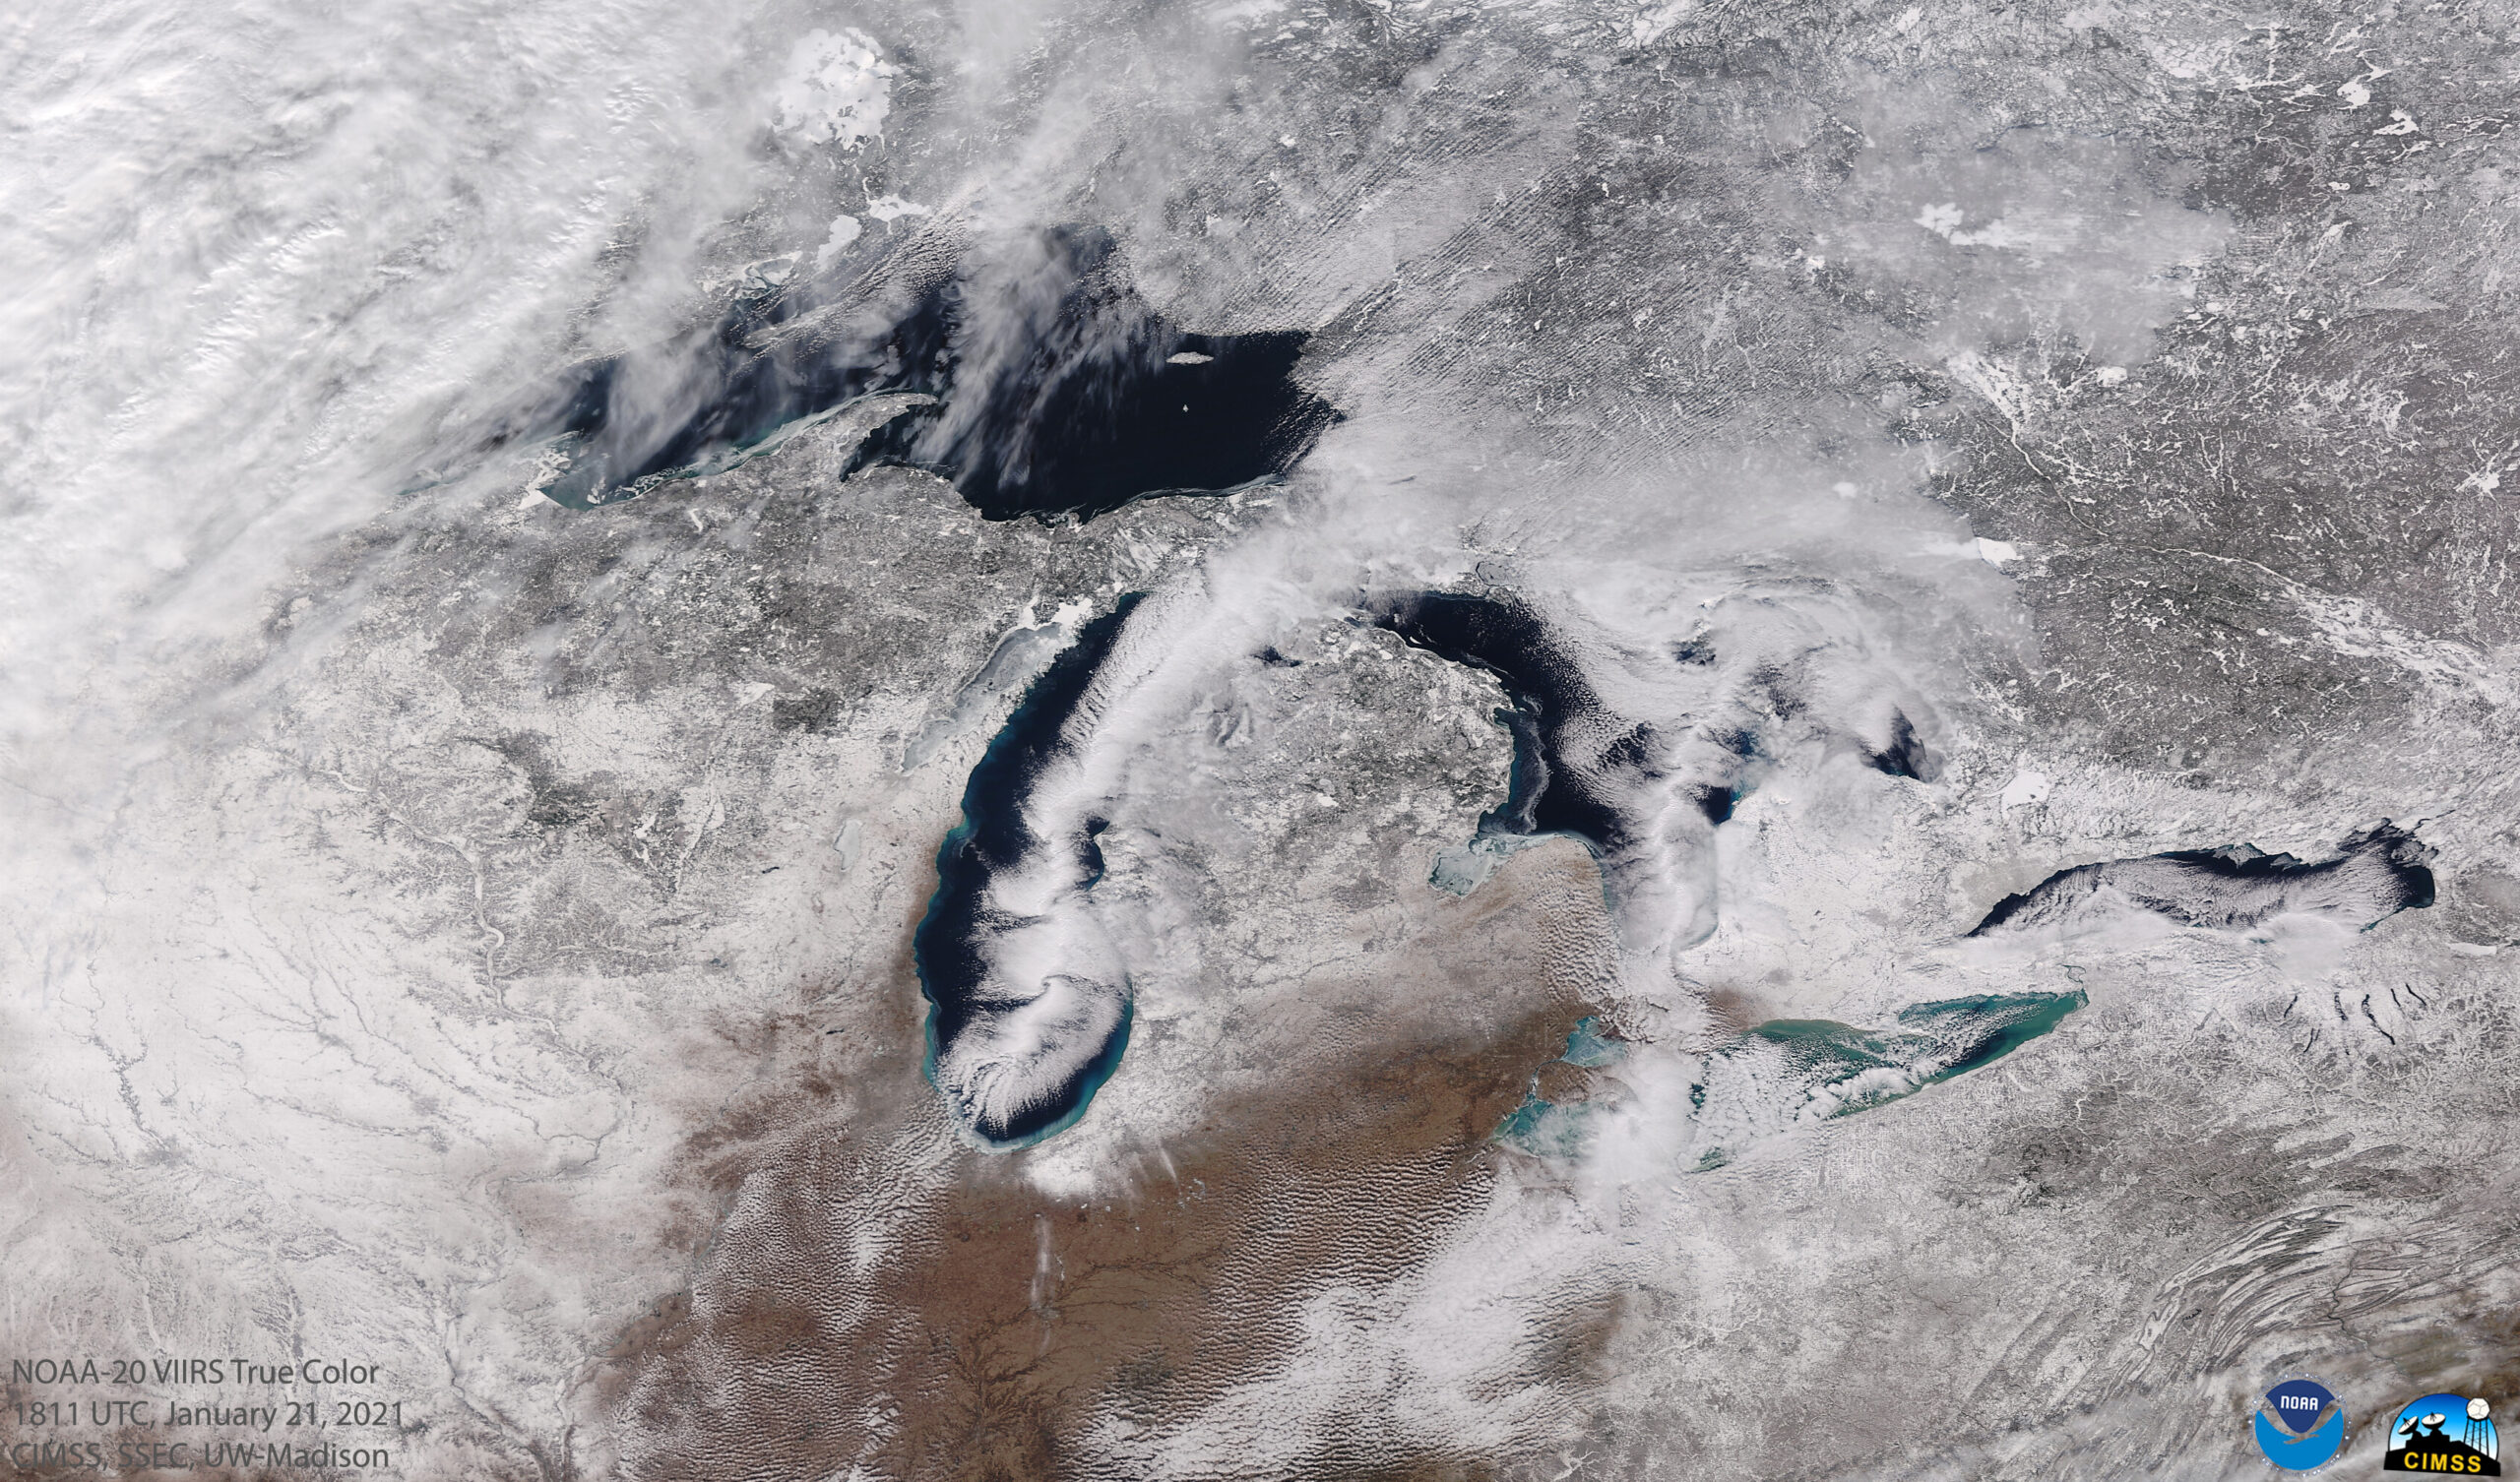
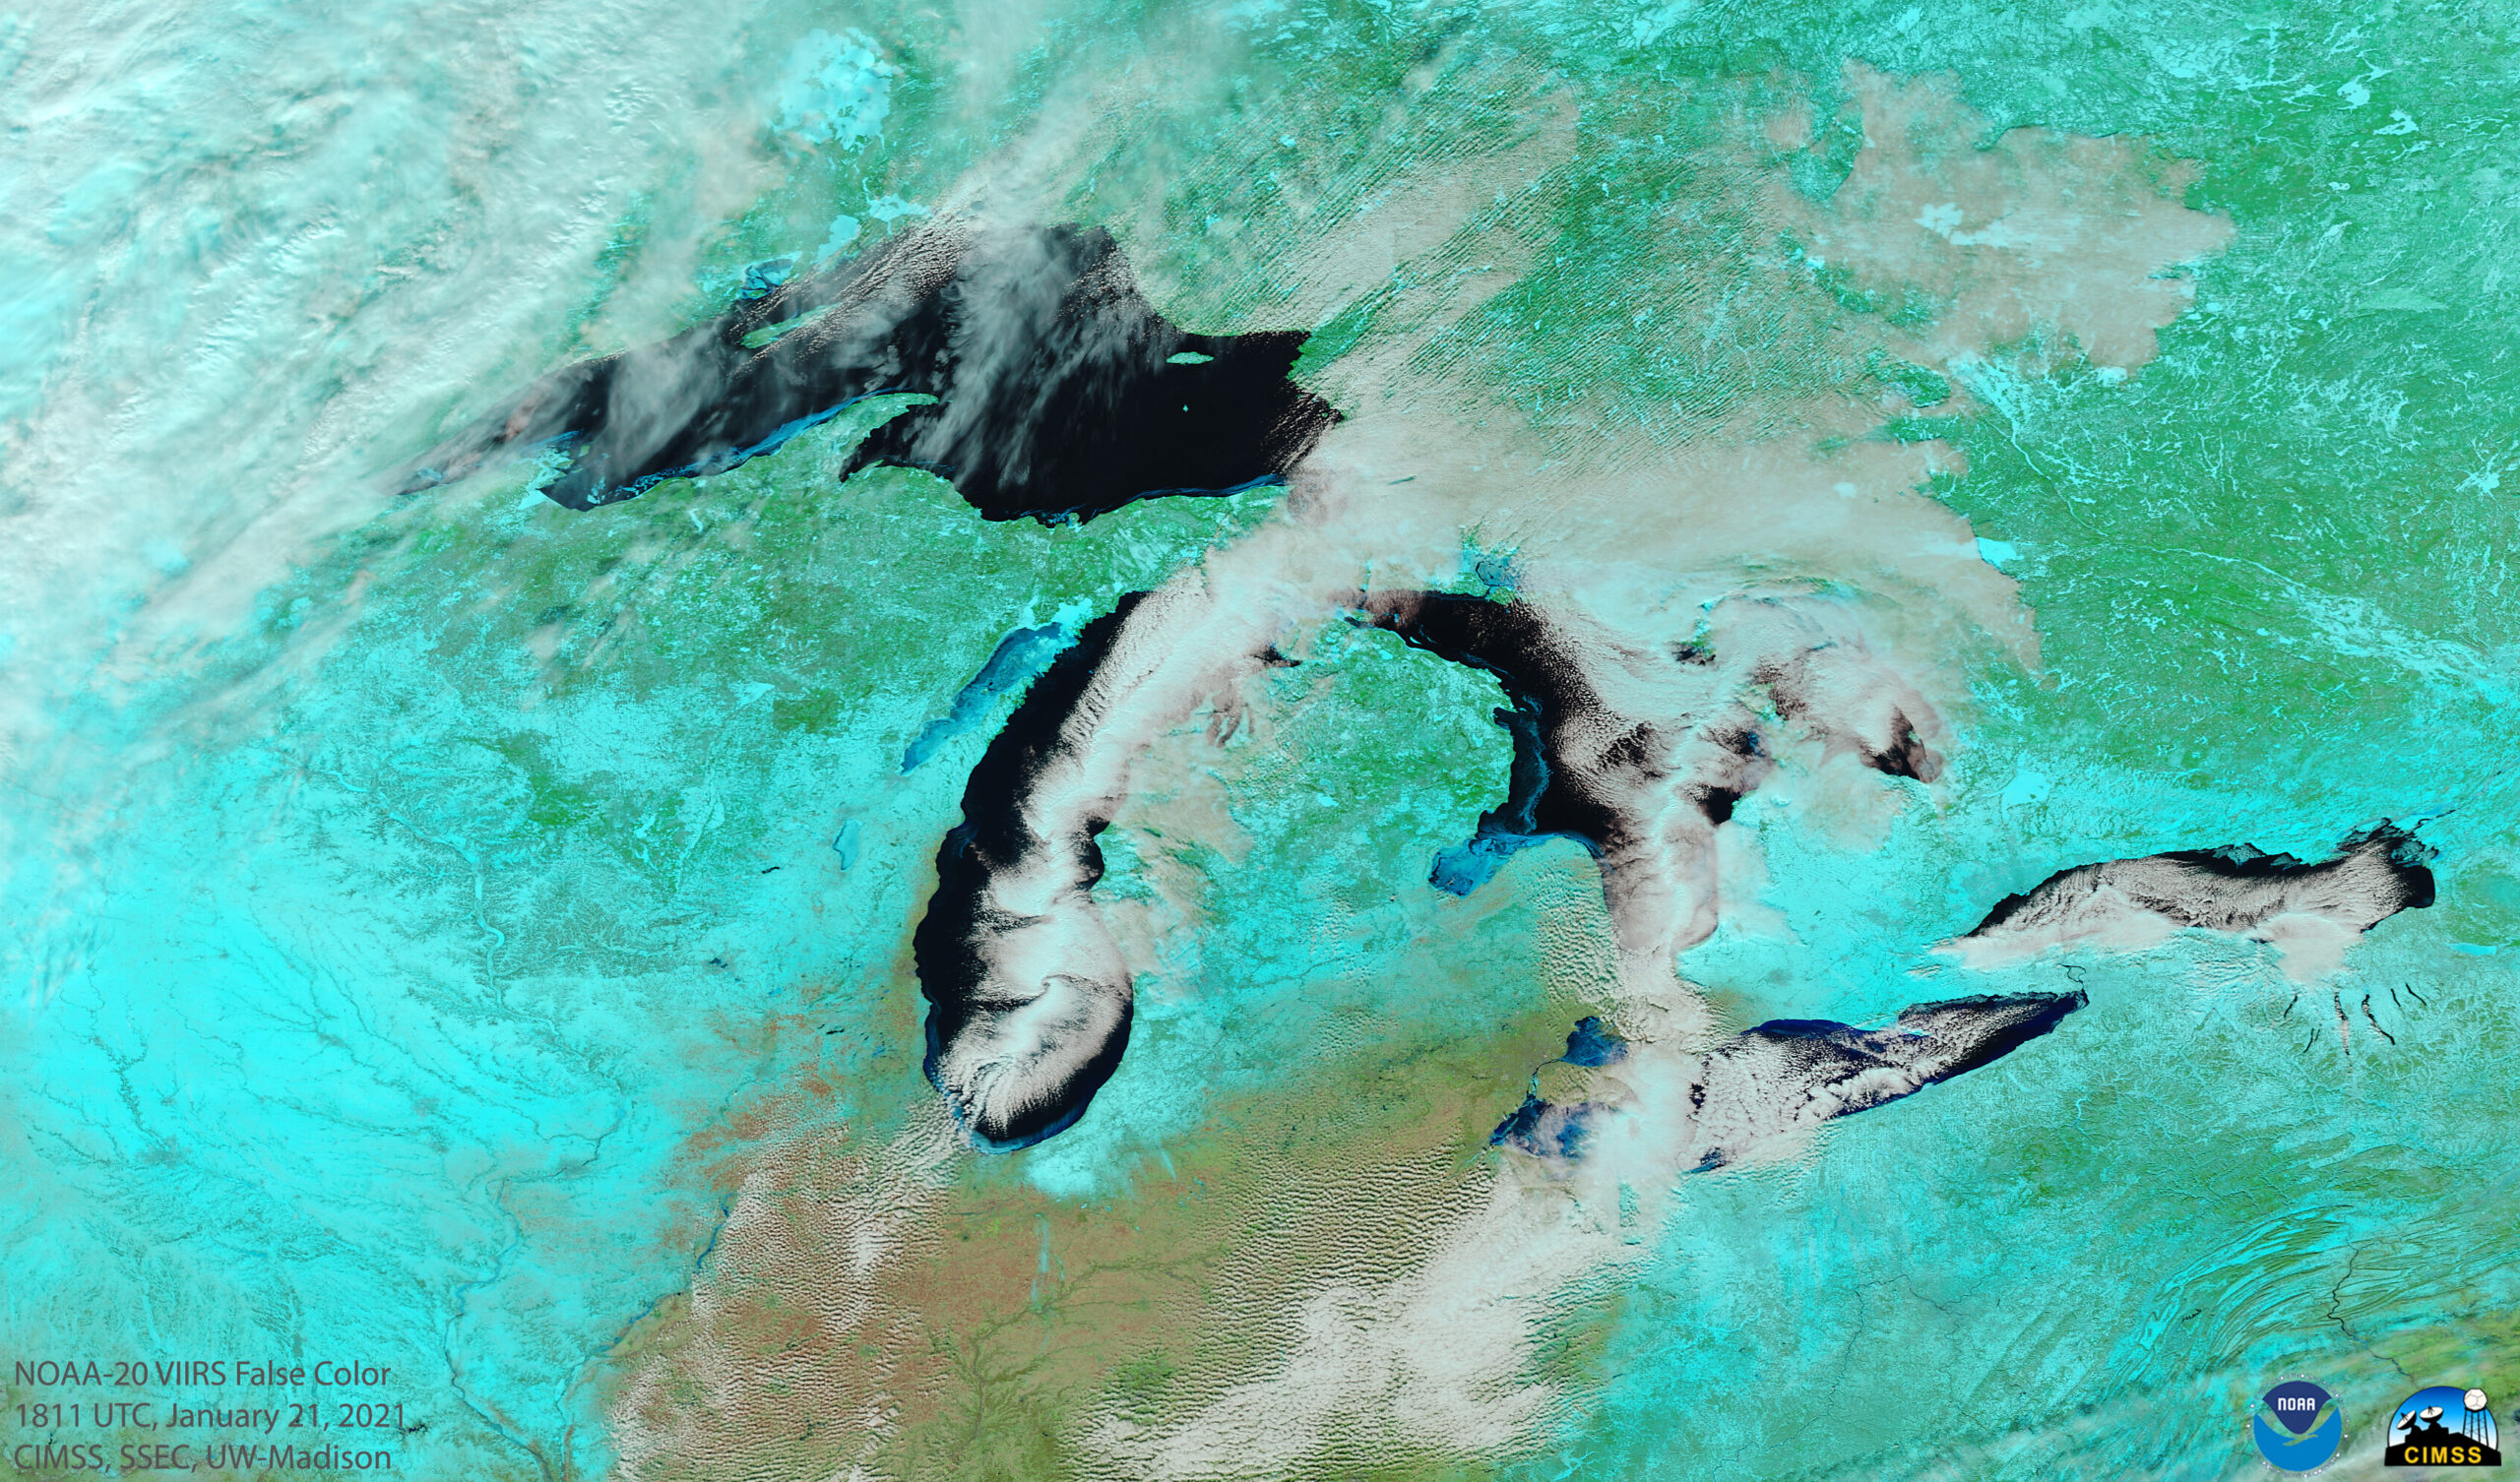
The top two images from January capture mesovortices on Lake Michigan, with False Color helping reveal snow cover and lake ice.
January 2022 – VIIRS True Color view of the Great Lakes Region
January 2022 – VIIRS False Color view of the Great Lakes Region
But the big global event in January was the Hunga-Tonga Volcano eruption in the South Pacific, also viewed by VIIRS.
January 2022 – VIIRS IR view of cloud-top gravity waves associated with the Hunga-Tona volcano eruption on January 15th, click on the image for a Suomi-NPP/NOAA-20 toggle.
Scroll down for additional satellite imagery from each month in 2022 …
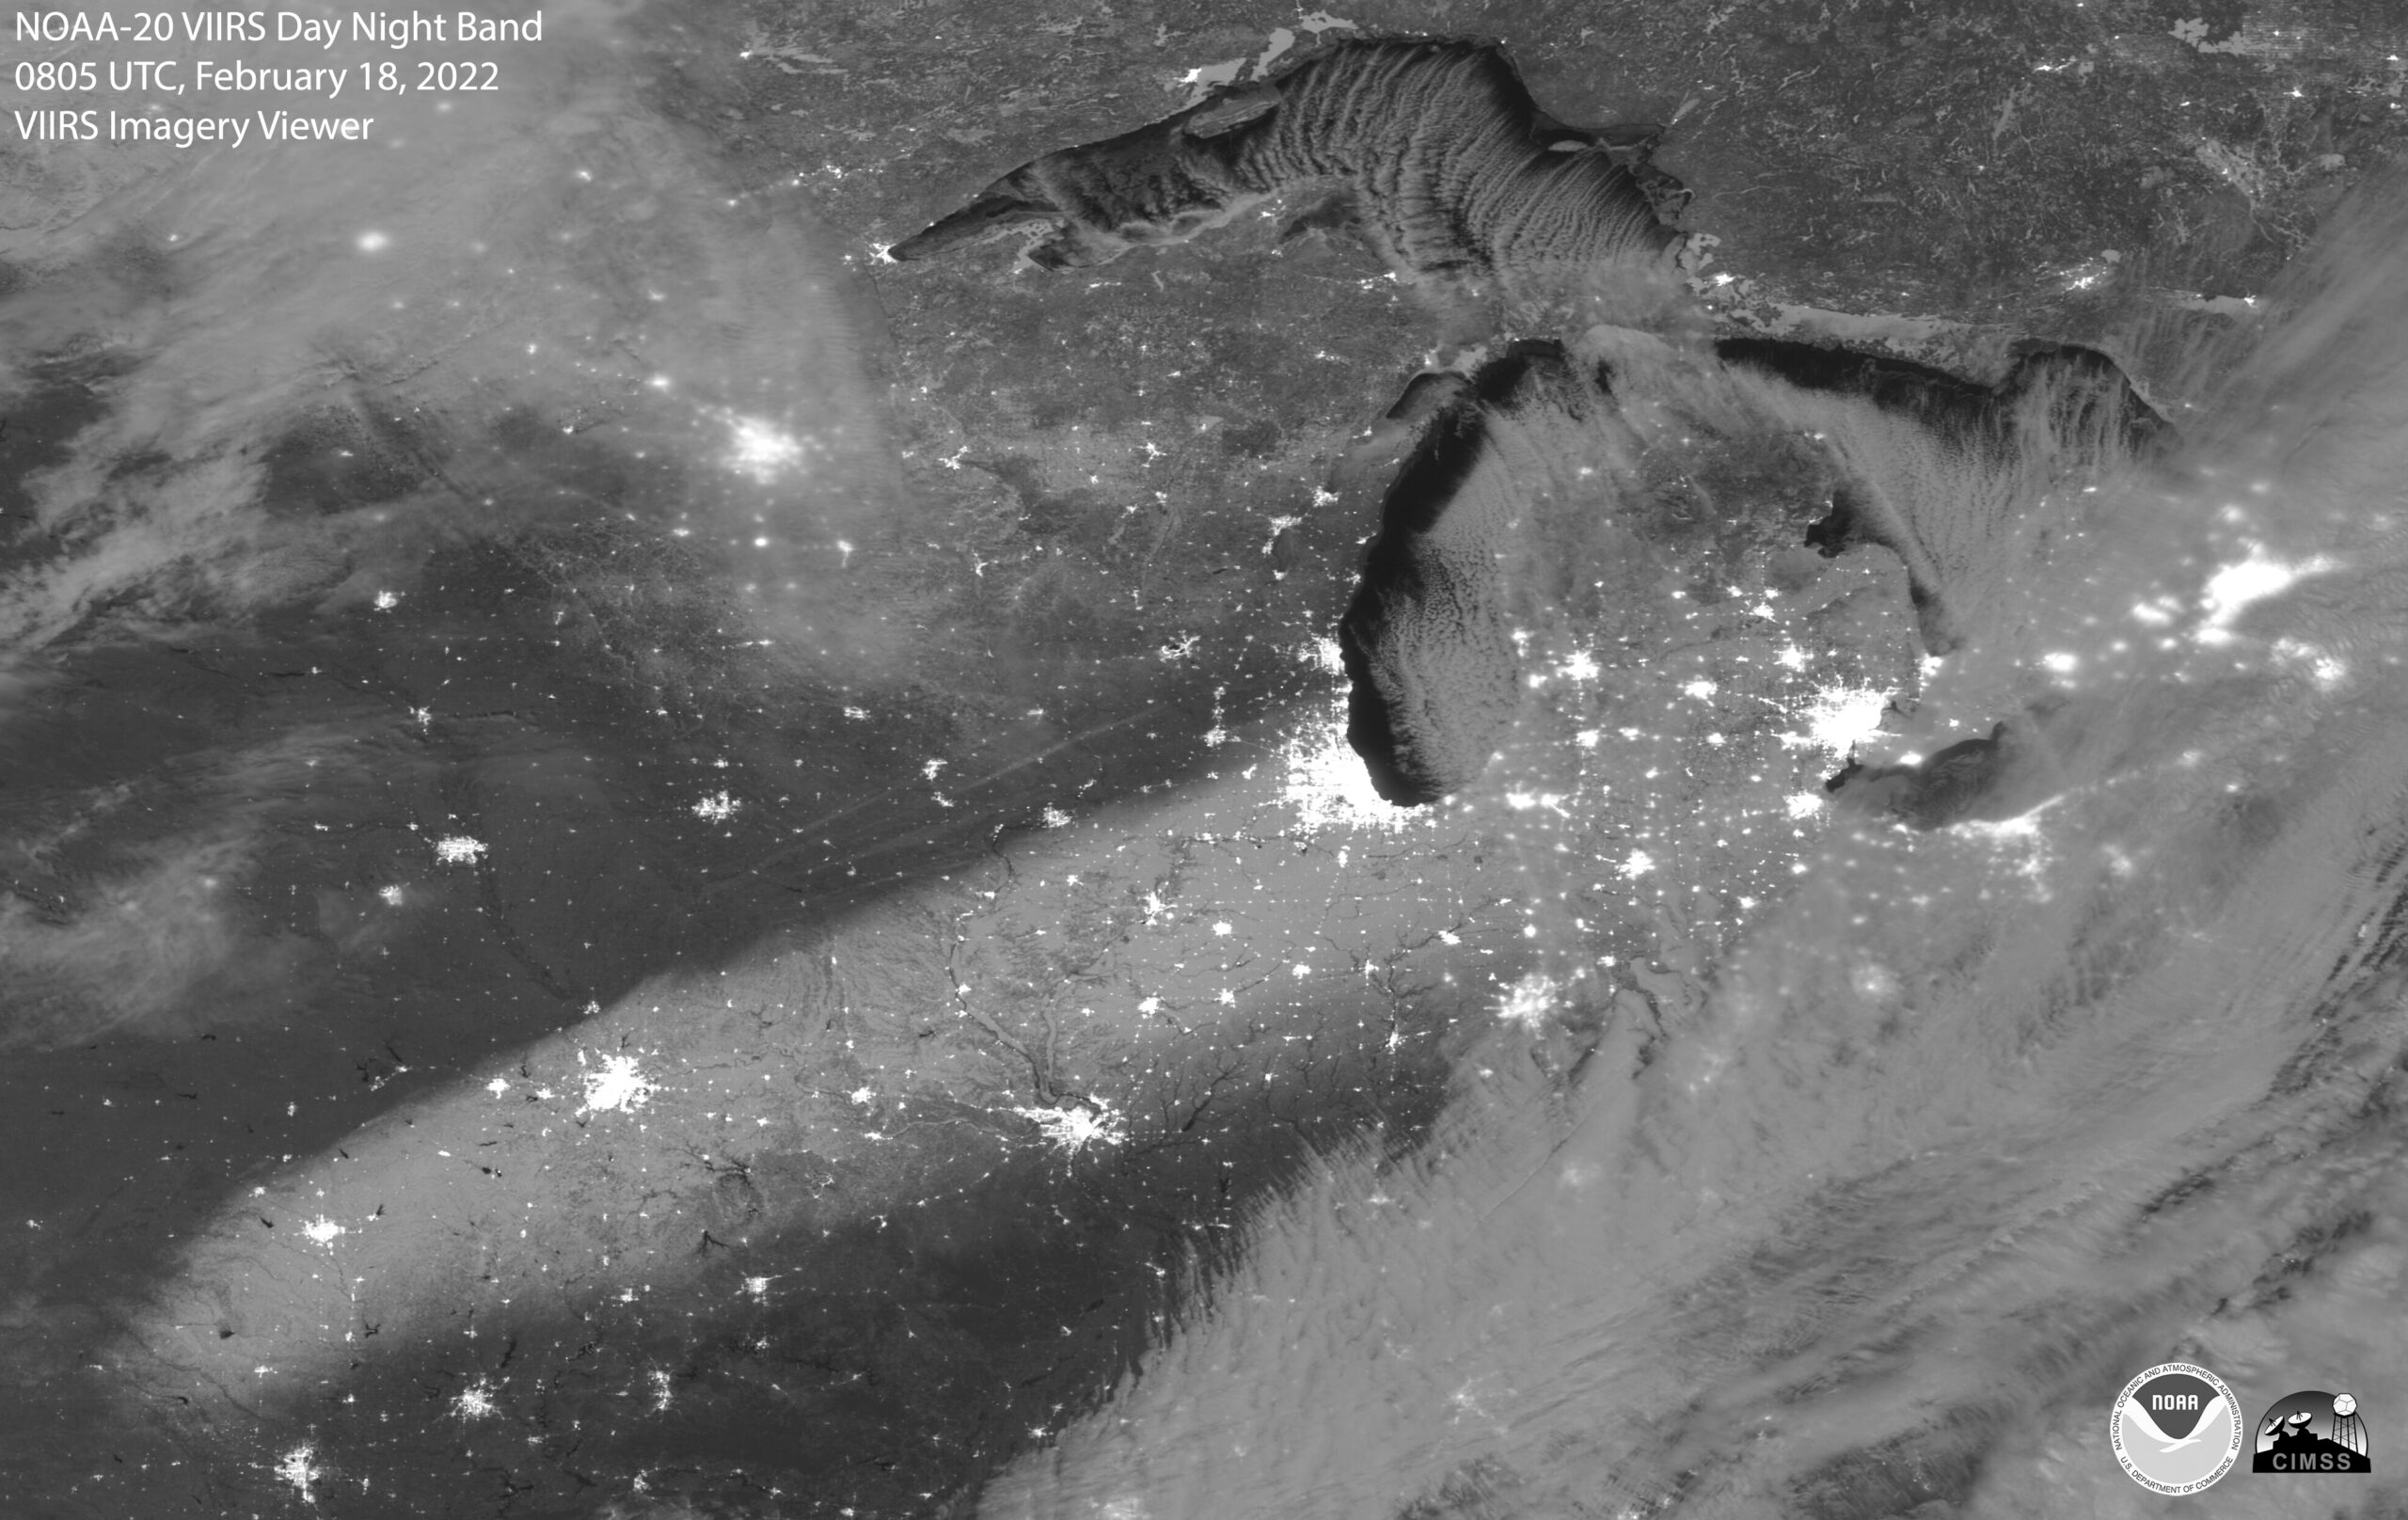
February 2022 – VIIRS Day Night Band imagery leverages moonlight to reveal a snow storm track and lake-effect clouds.
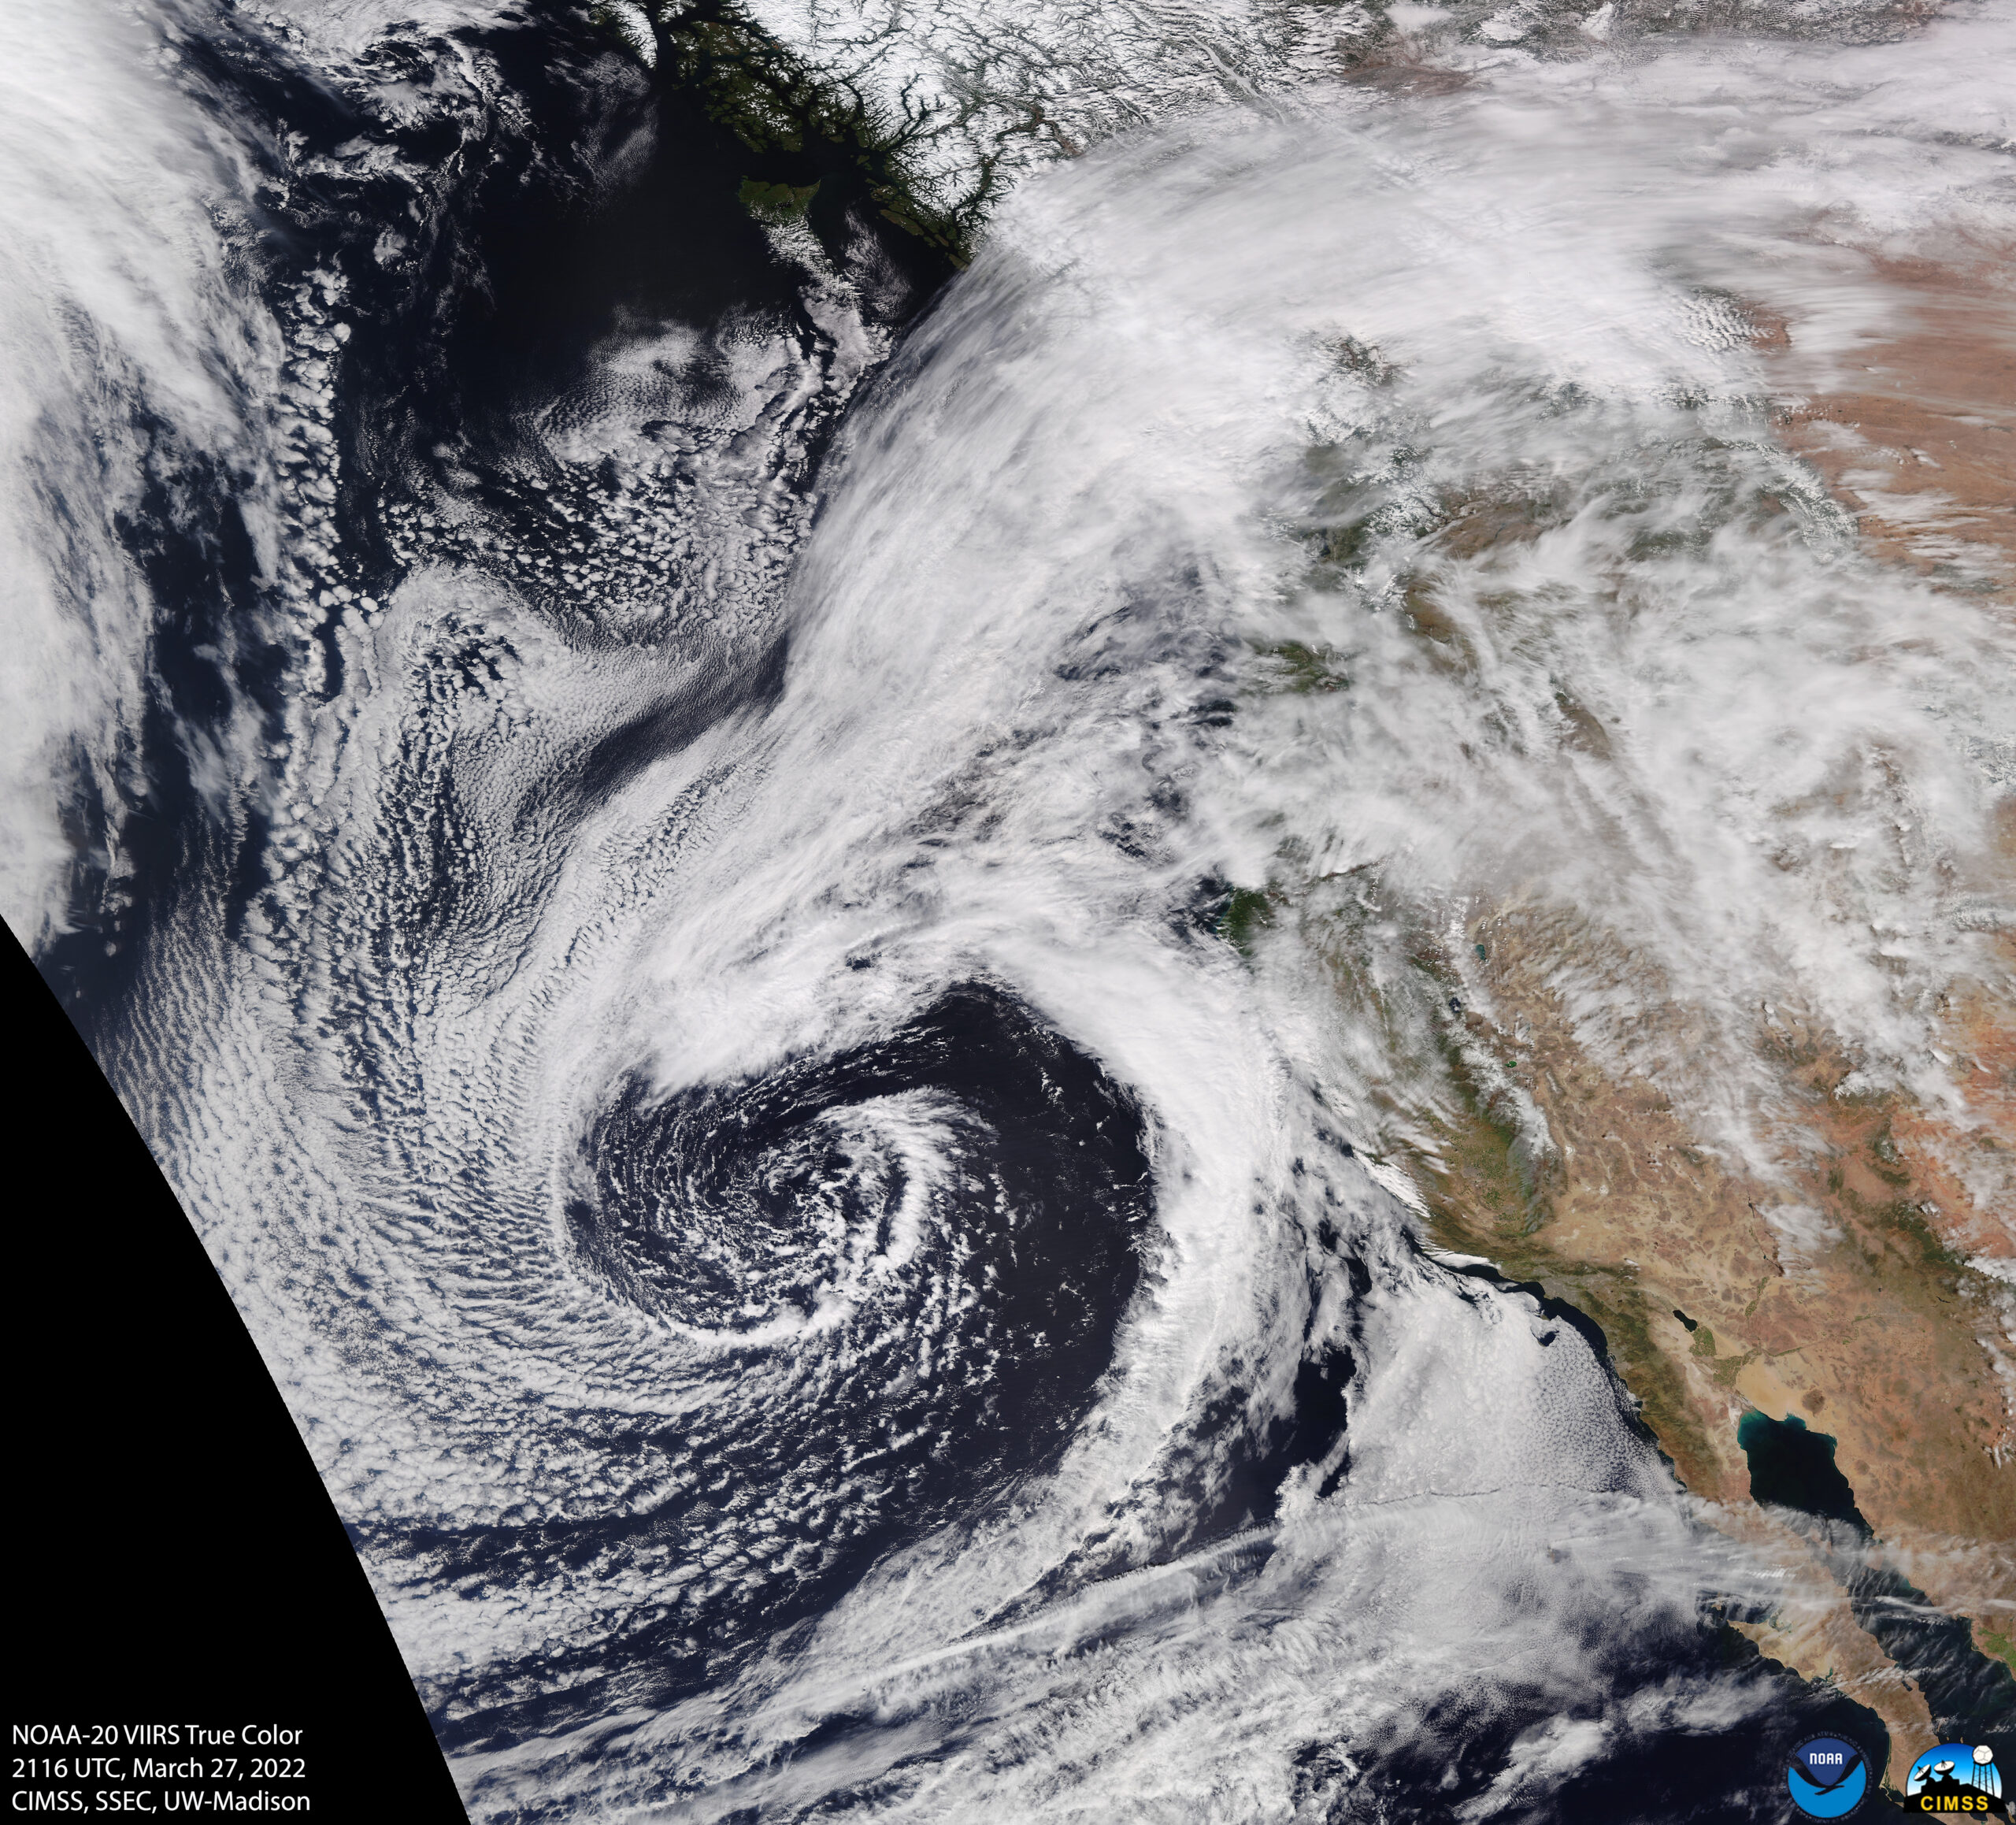
March 2022 – VIIRS True Color imagery captures a mid-latitude cyclone offshore the U.S. West Coast
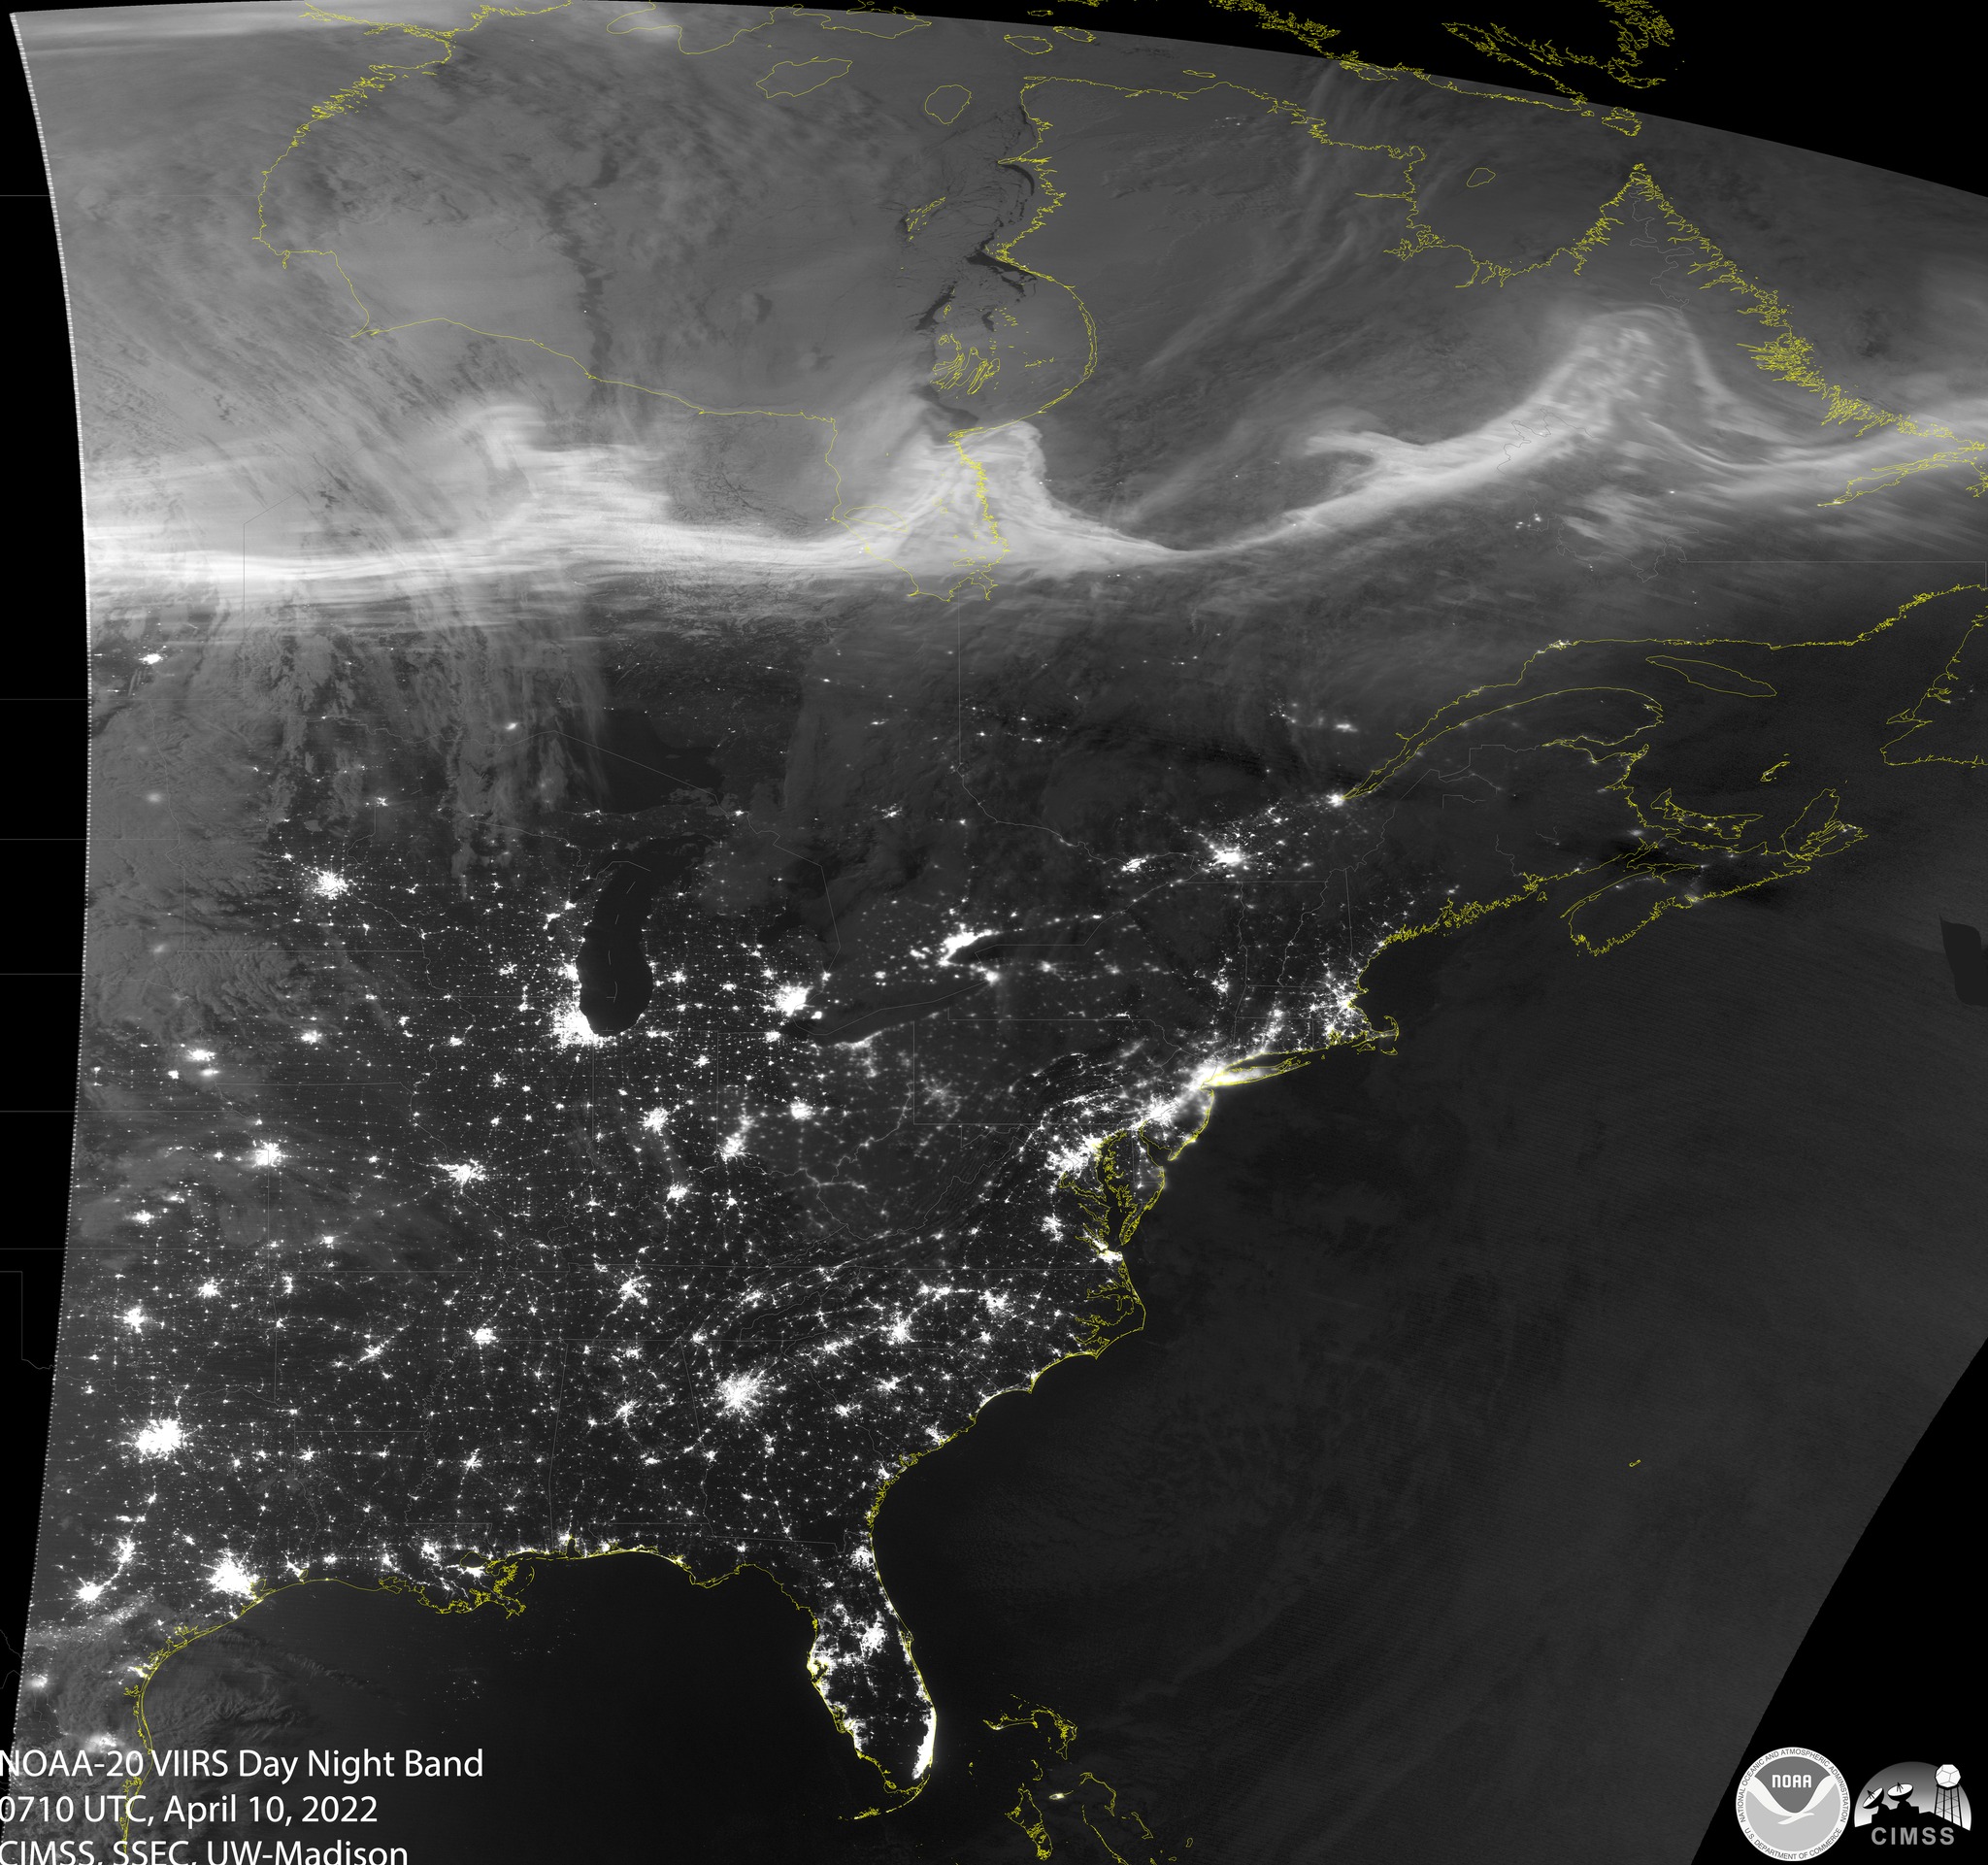
April 10 – VIIRS Day Night Band view of the Aurora Borealis from the VIIRS Imagery Viewer
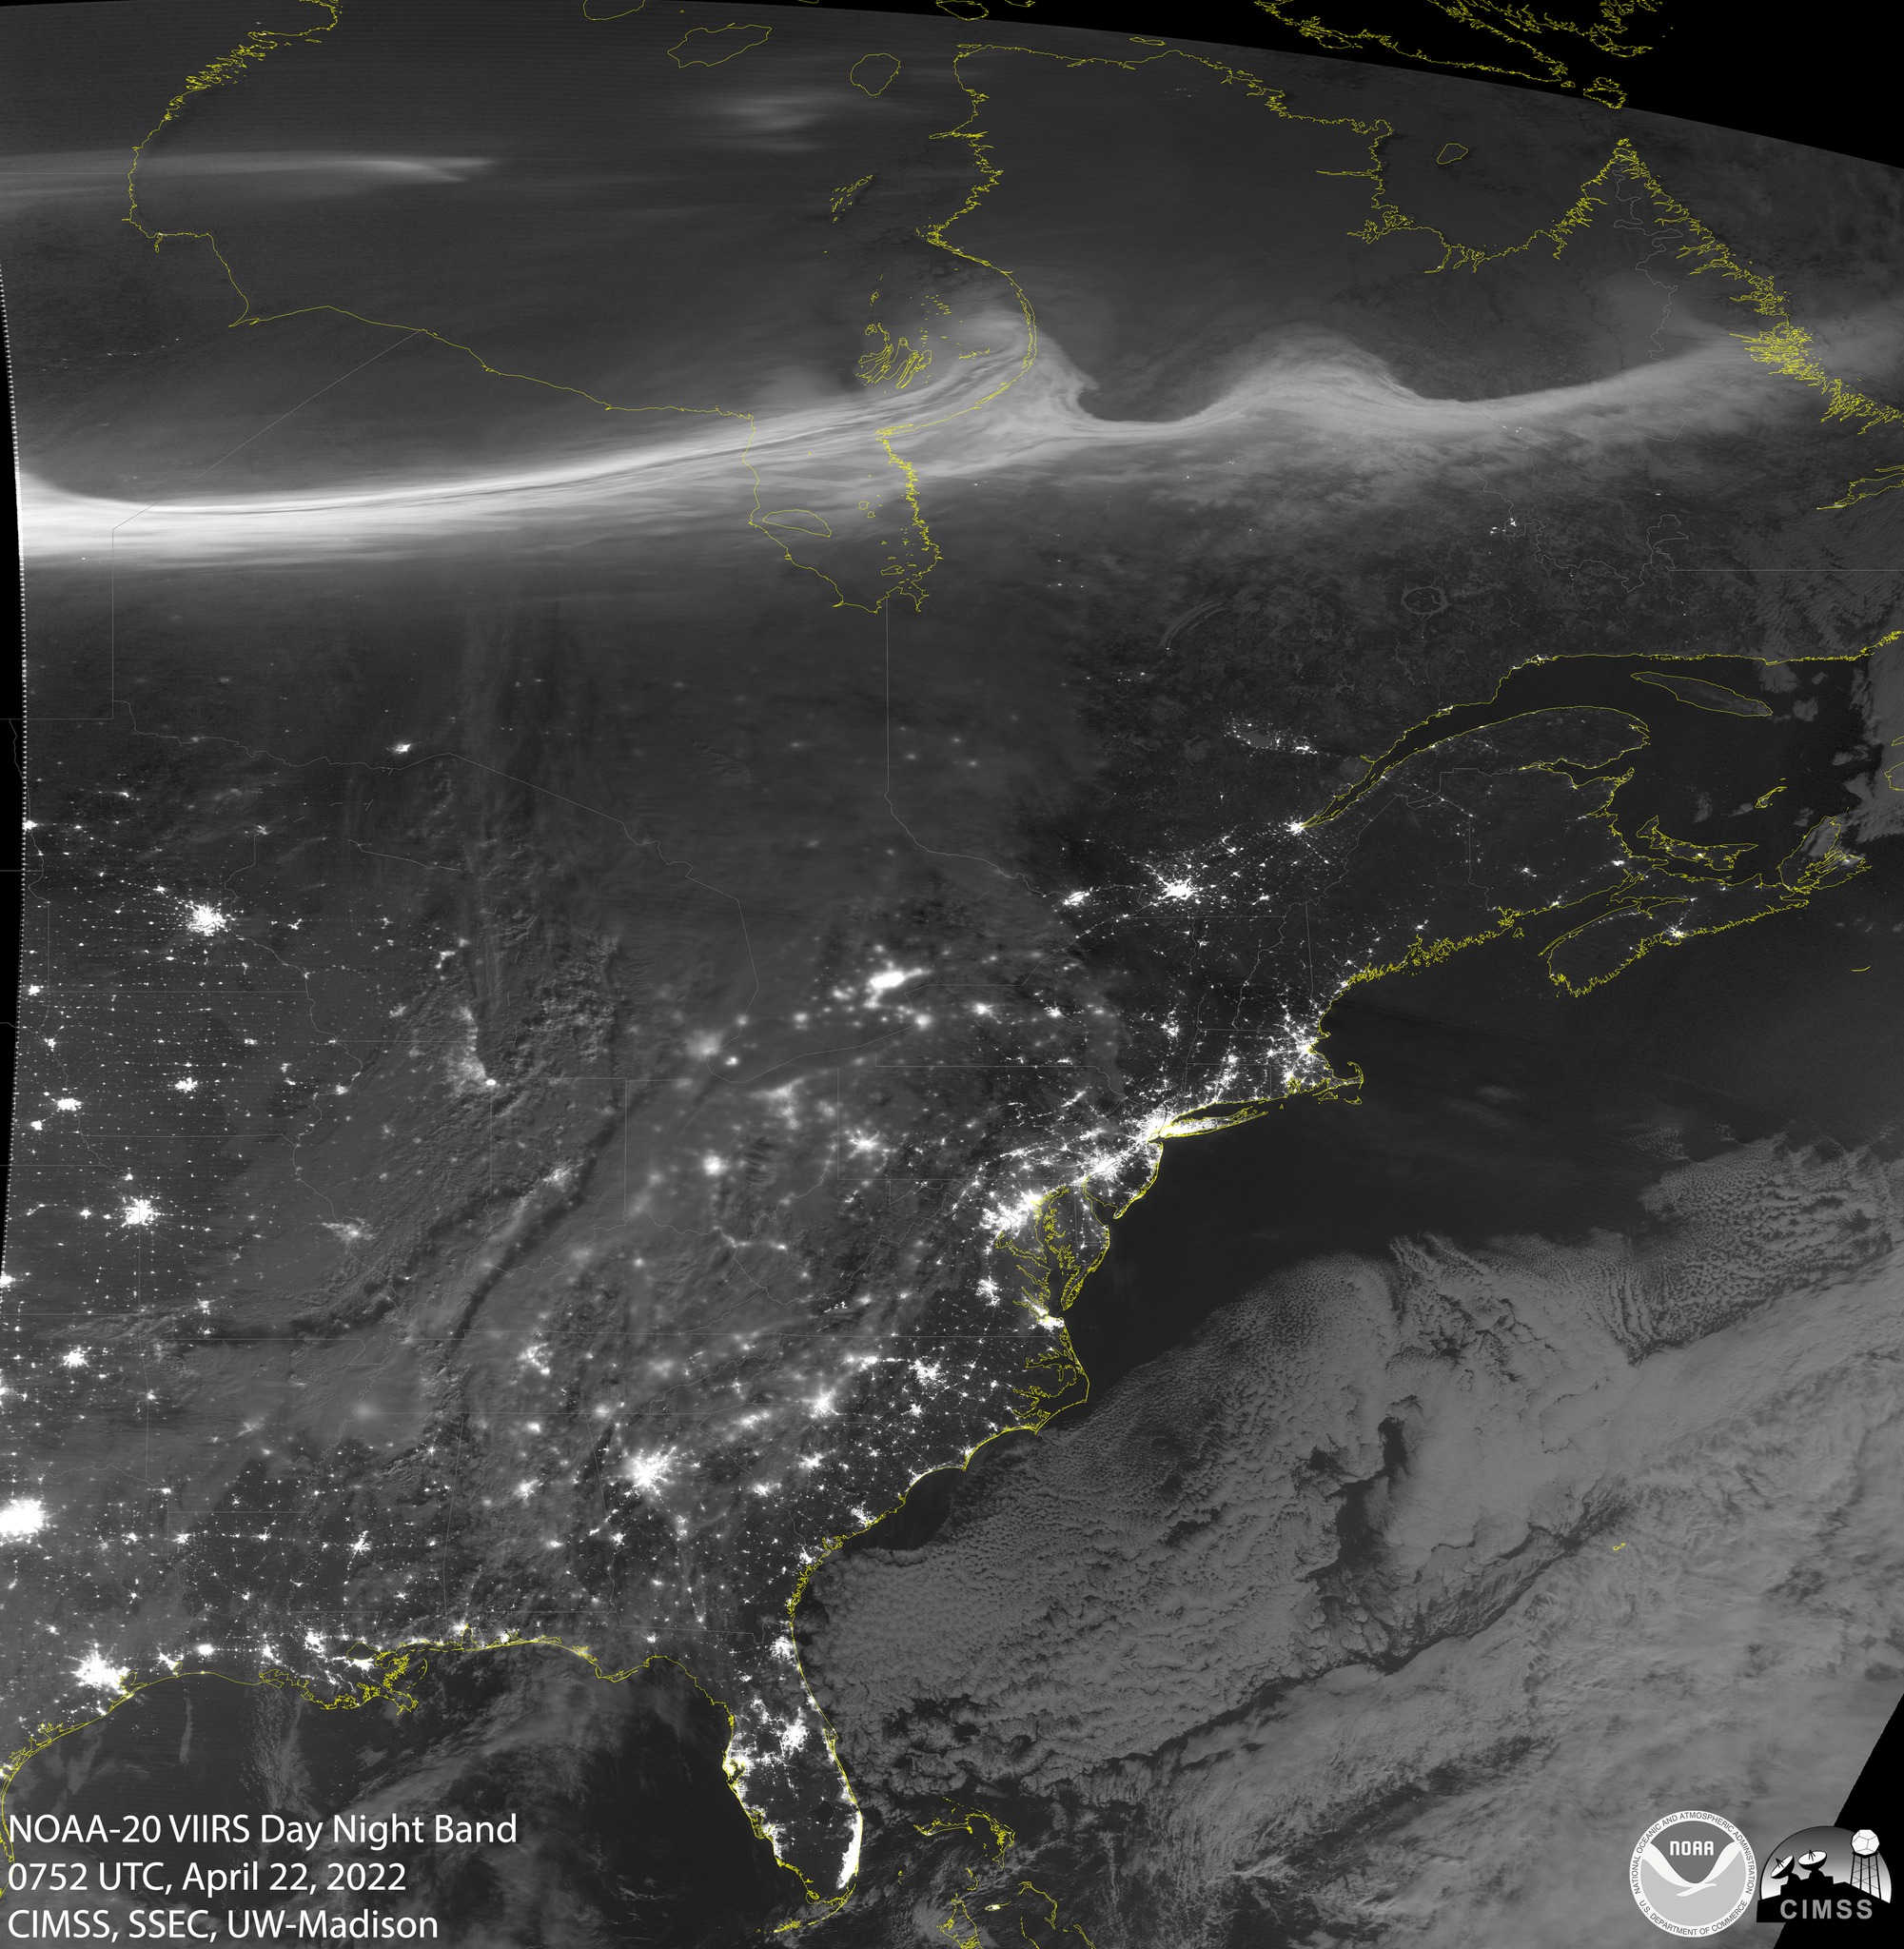
April 22 – VIIRS Day Night Band View of the Aurora Borealis from the VIIRS Imagery Viewer
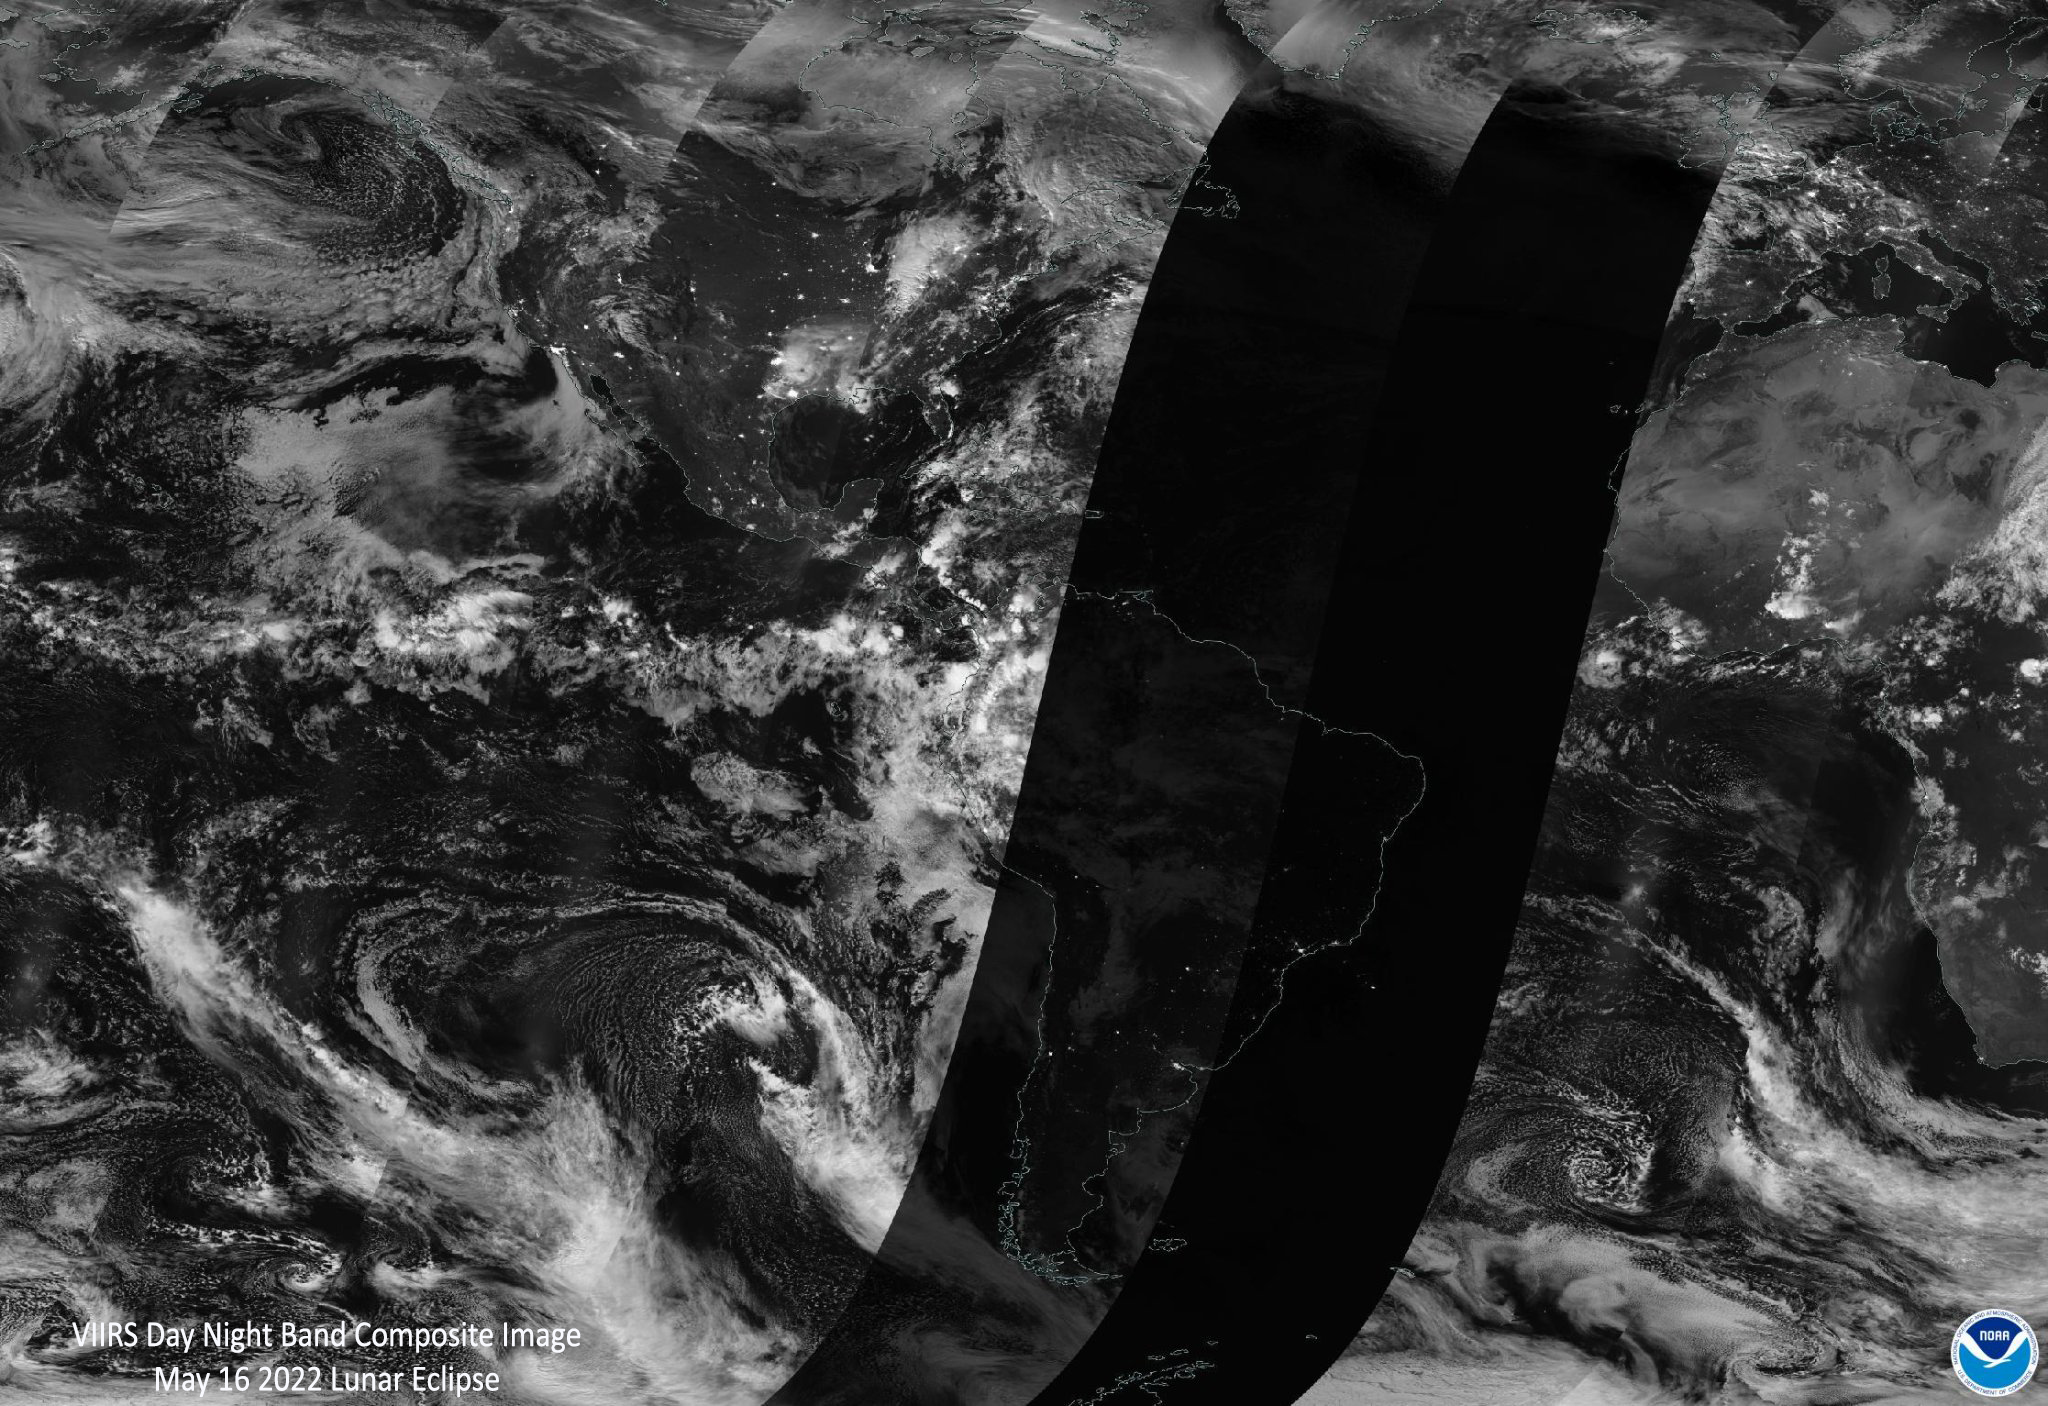
May 2022 – Lunar Eclipse composite image from NOAA. The full moon illuminates Day Night Band swaths but “blackouts” occur when Earth’s shadow blocks moonlight during Atlantic Ocean and South America overpasses for the May 16th total lunar eclipse.
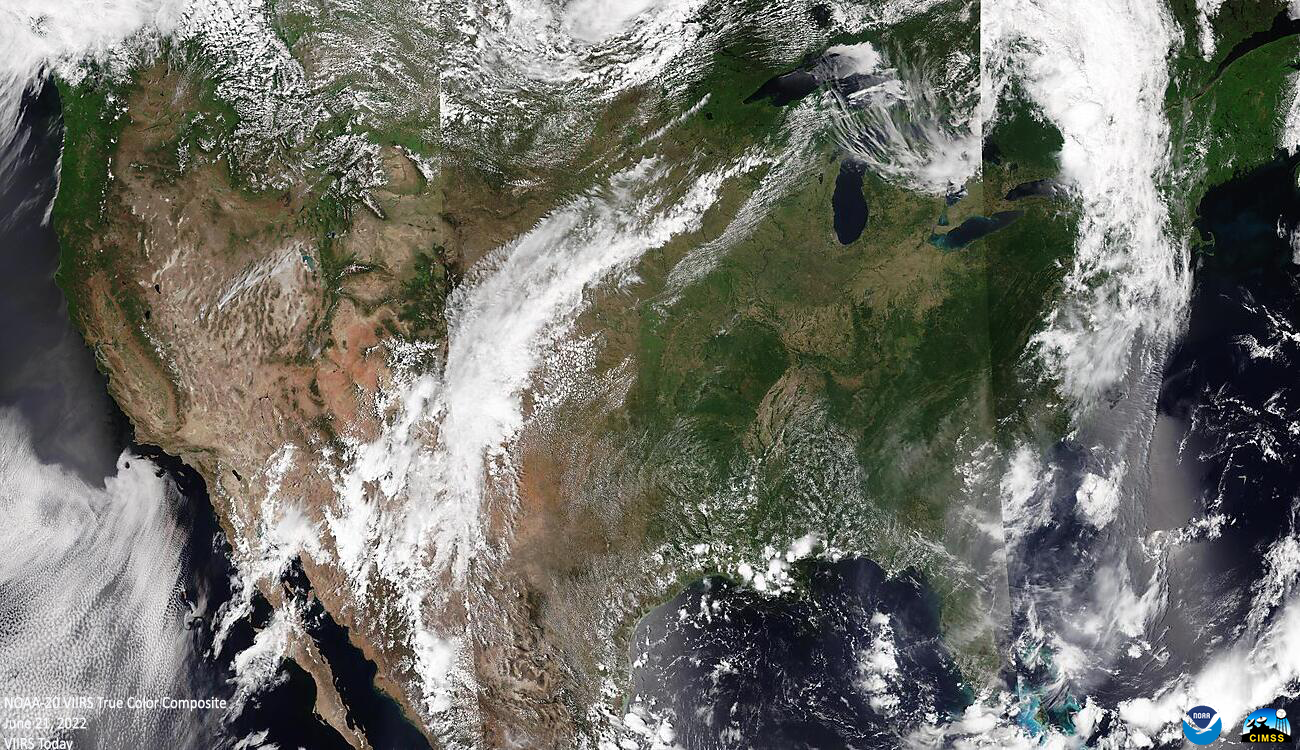
June 2022 – This True Color USA composite on the summer solstice from VIIRS Today shows tranquil summer weather and persistent High pressure over the southwest.
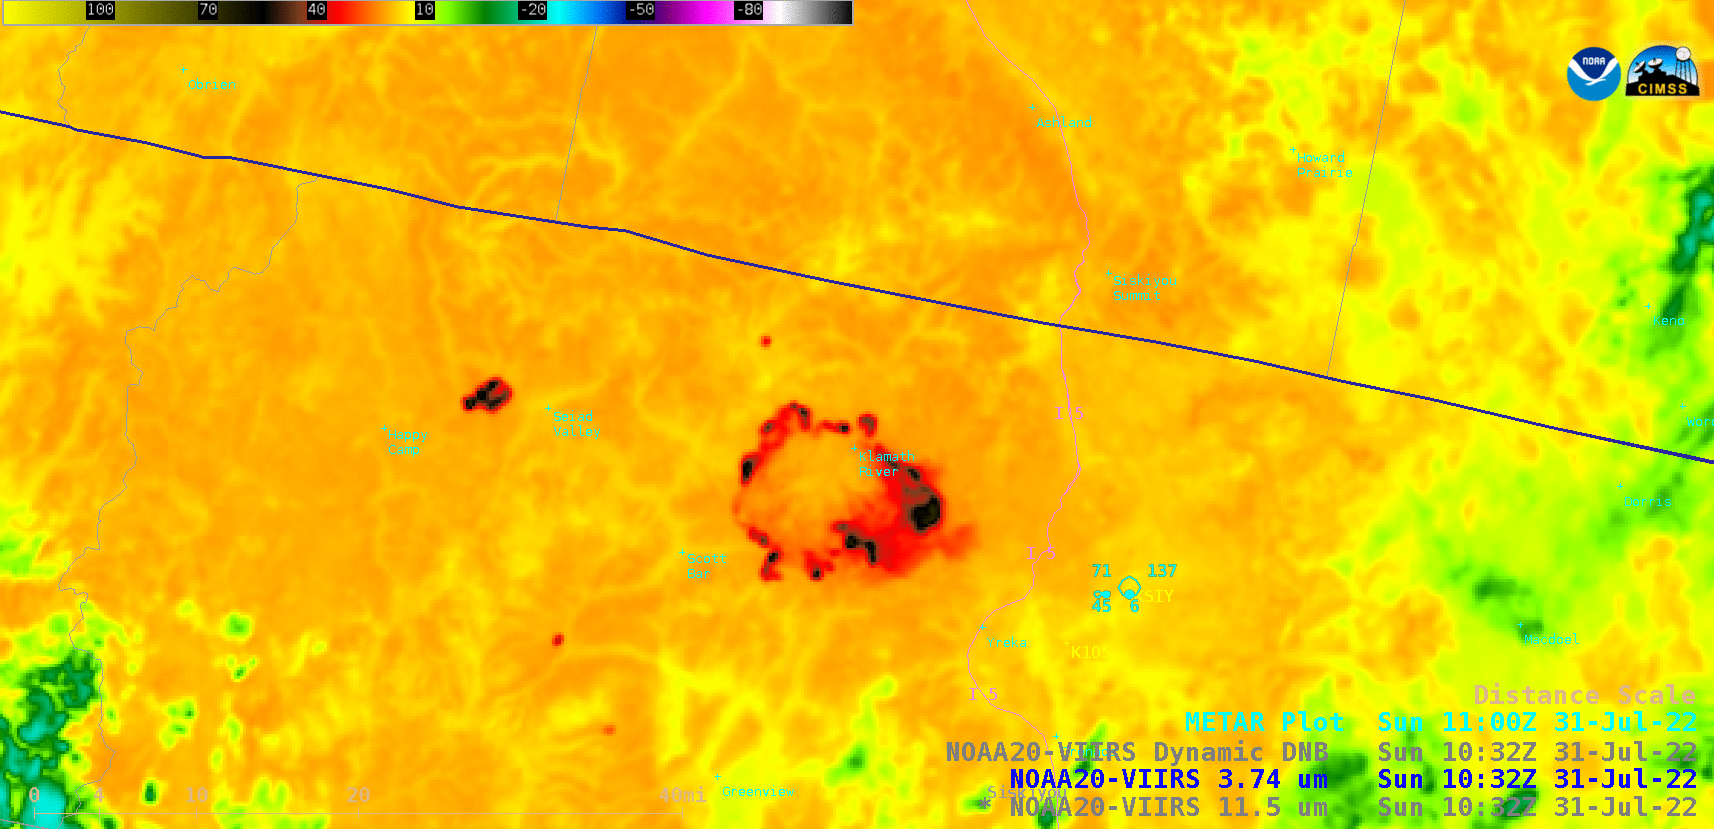
July 2022 – VIIRS Shortwave IR (3.74 µm) showed the hot thermal signature of the McKinney Fire in California on July 31st
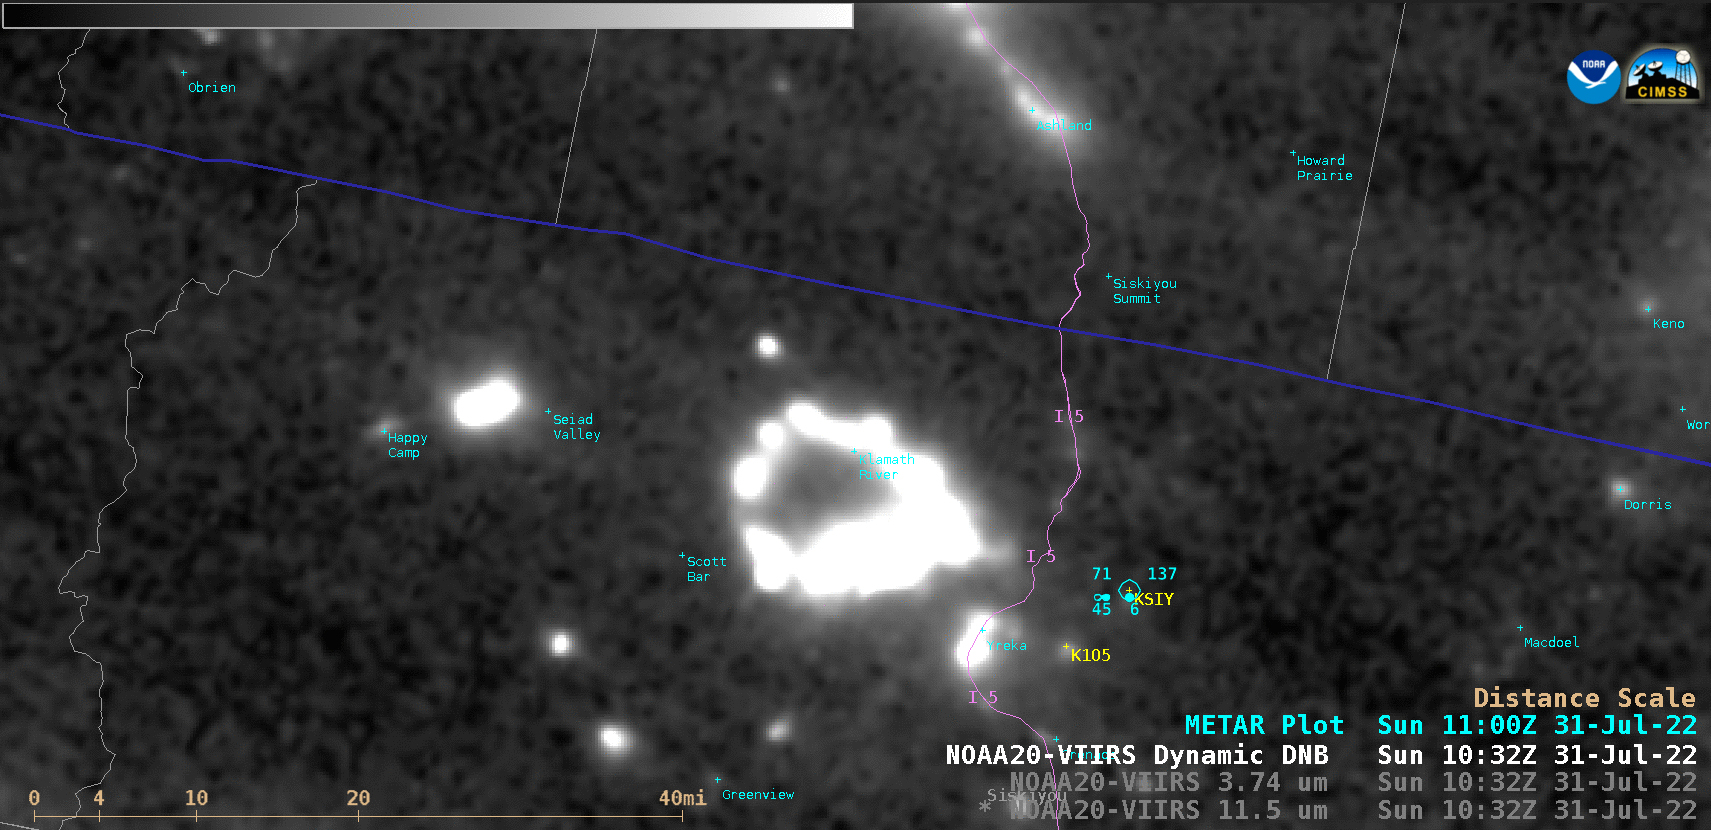
July 2022 – VIIRS Day Night Band showed the bright glow of flames associated with the McKinney Fire in California on July 31st
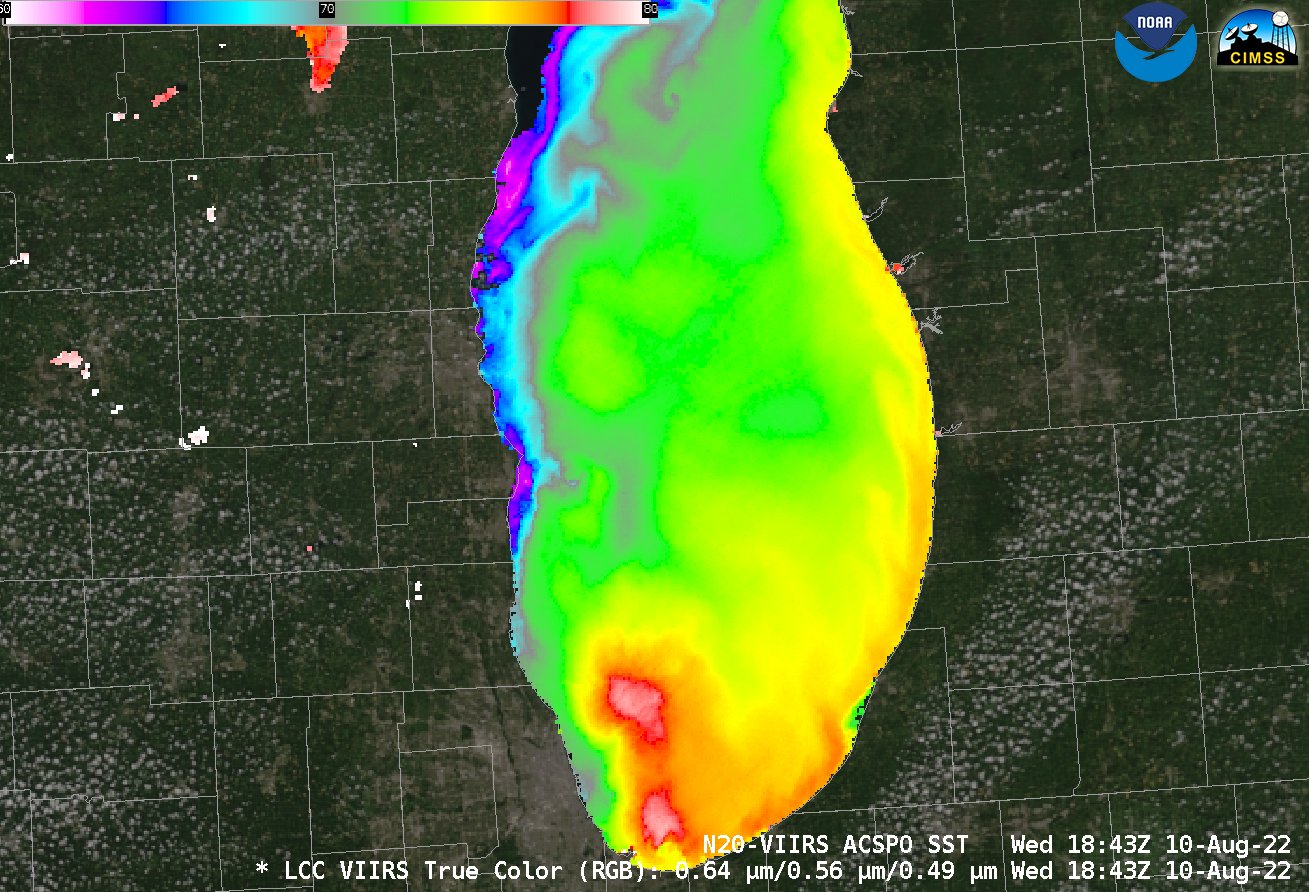
August 2022 – VIIRS lake surface temperatures depicted an upwelling event of cold waters on the western side of Lake Michigan on August 10th.
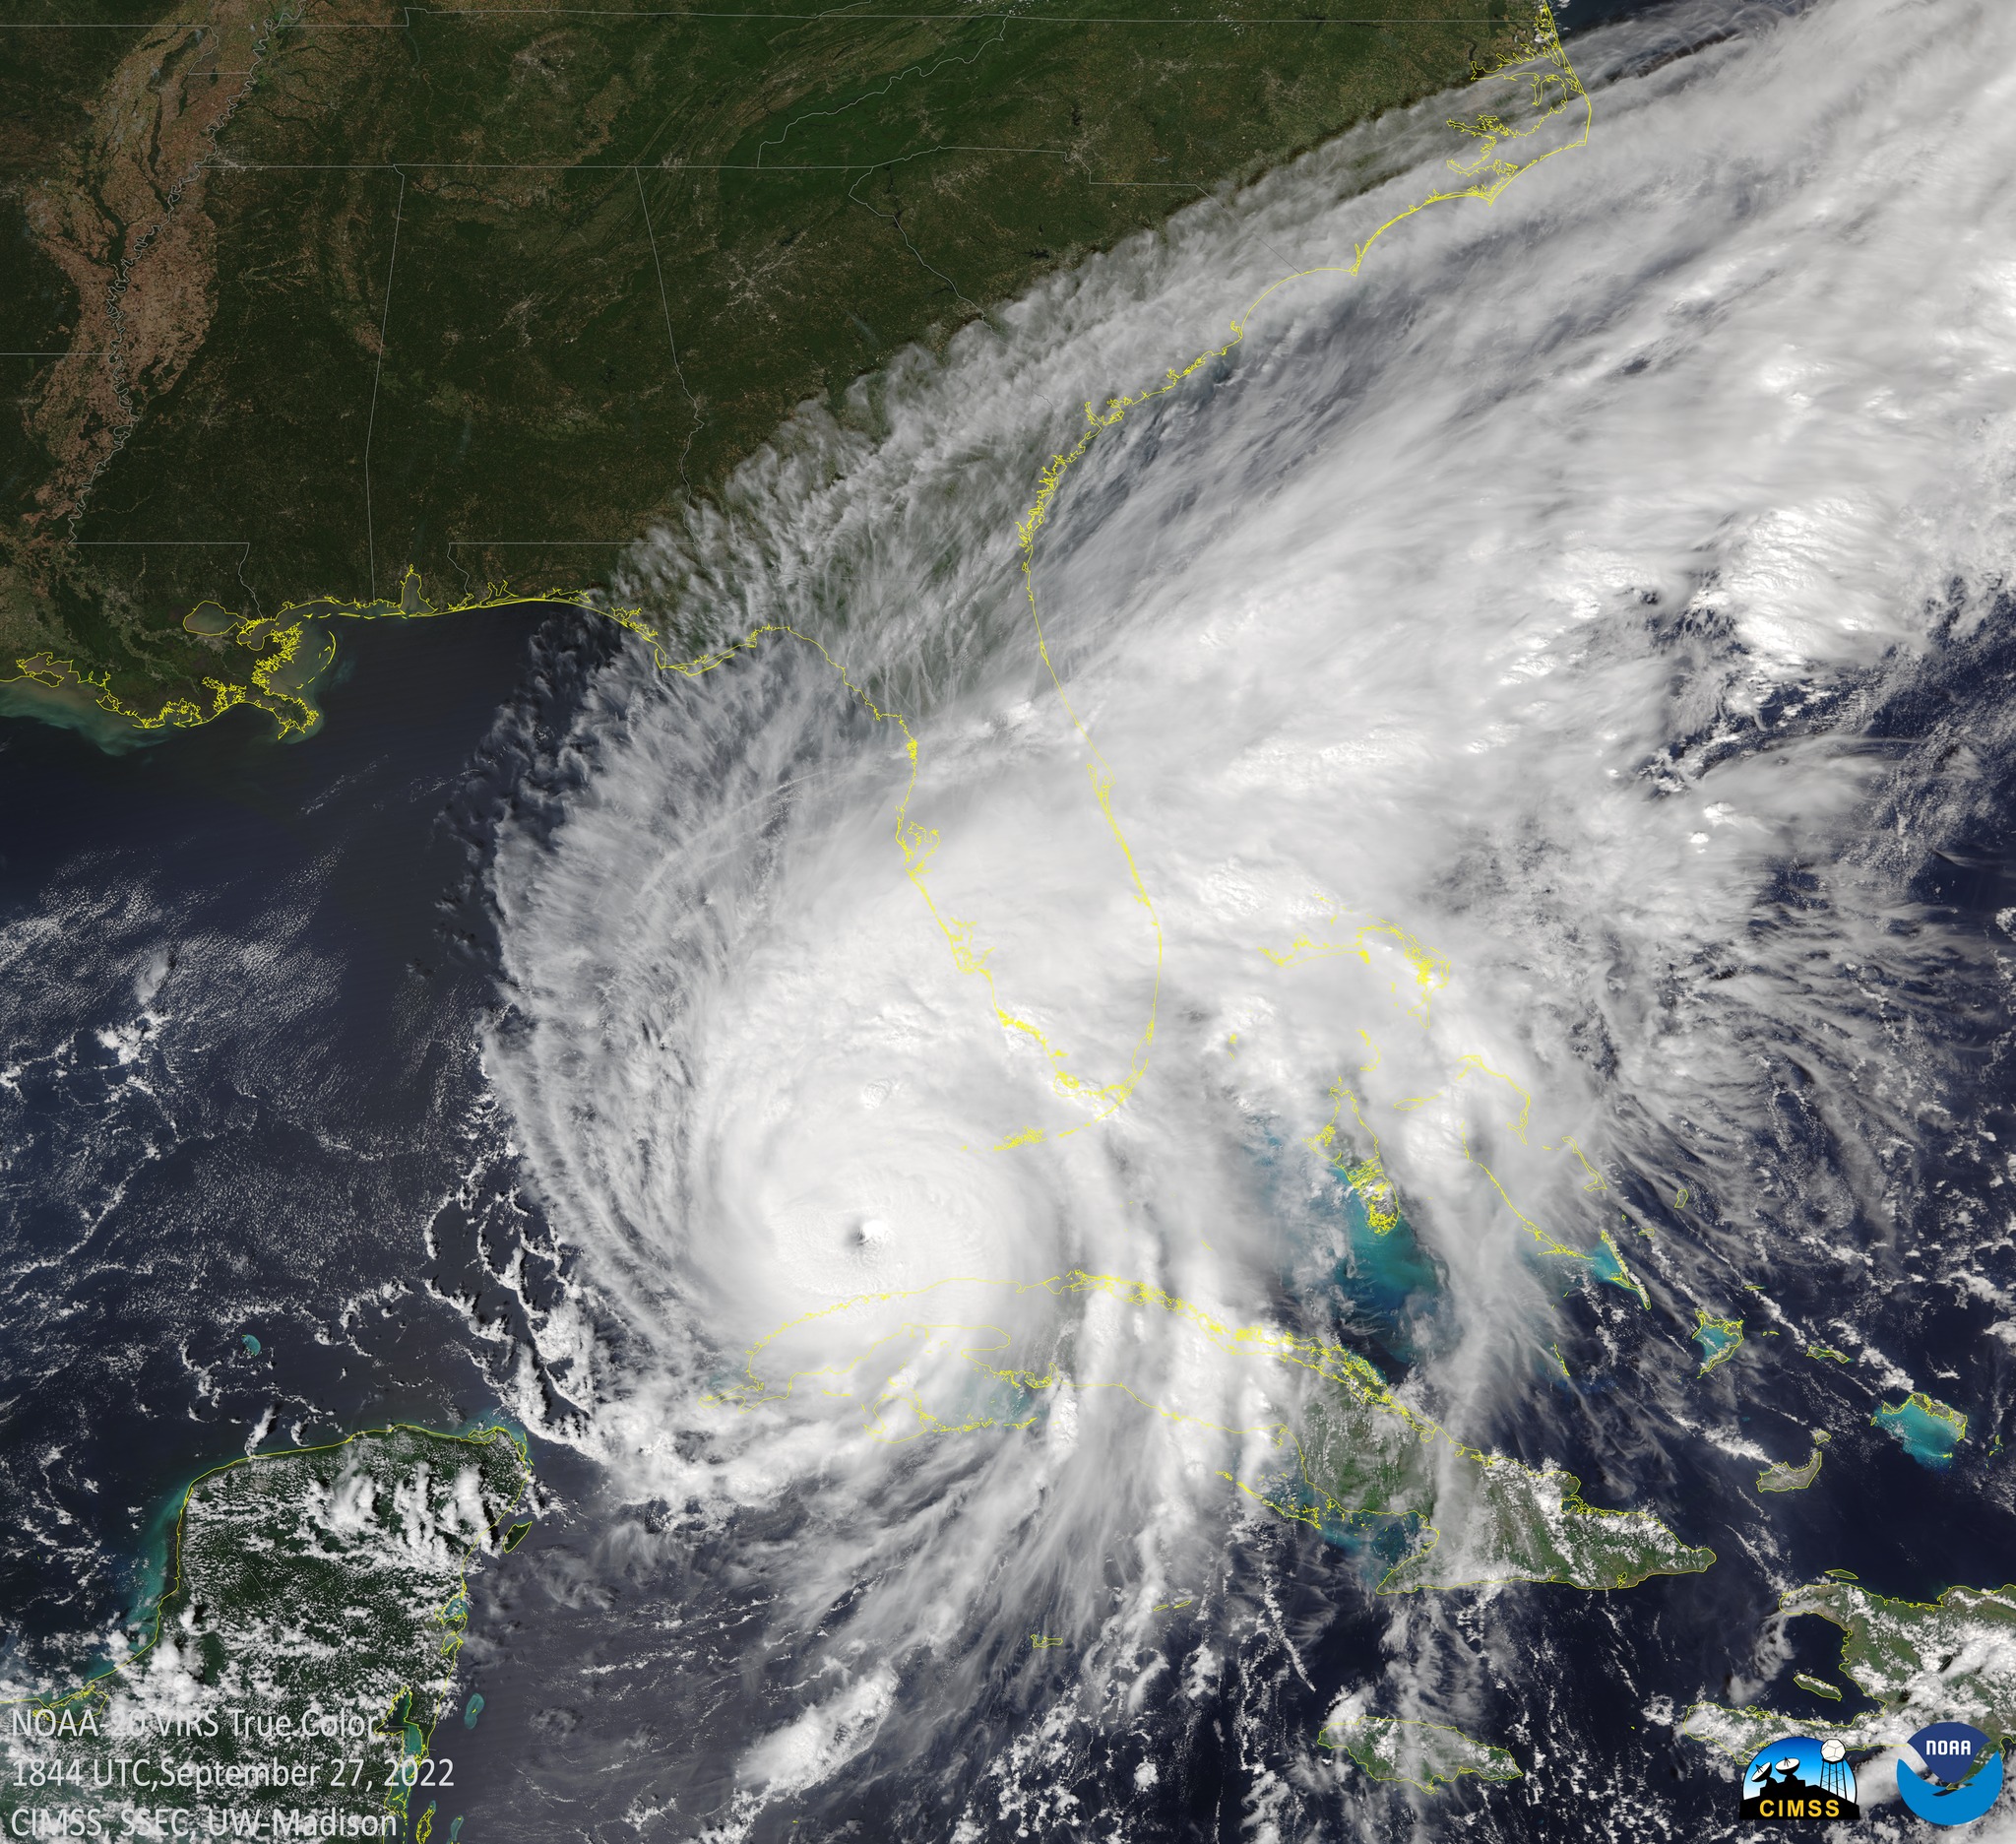
September 2022 – Category 4 Hurricane Ian headed toward Florida on September 27th via VIIRS True Color.
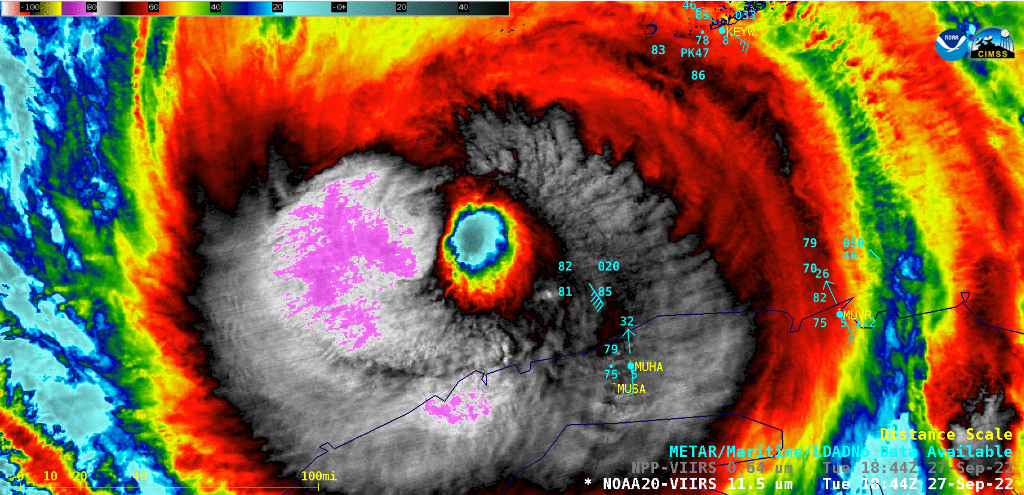
September 2022 – VIIRS IR reveals cold cloud-top temperatures near -83ºC (shades of purple) with Hurricane Ian on September 27th.
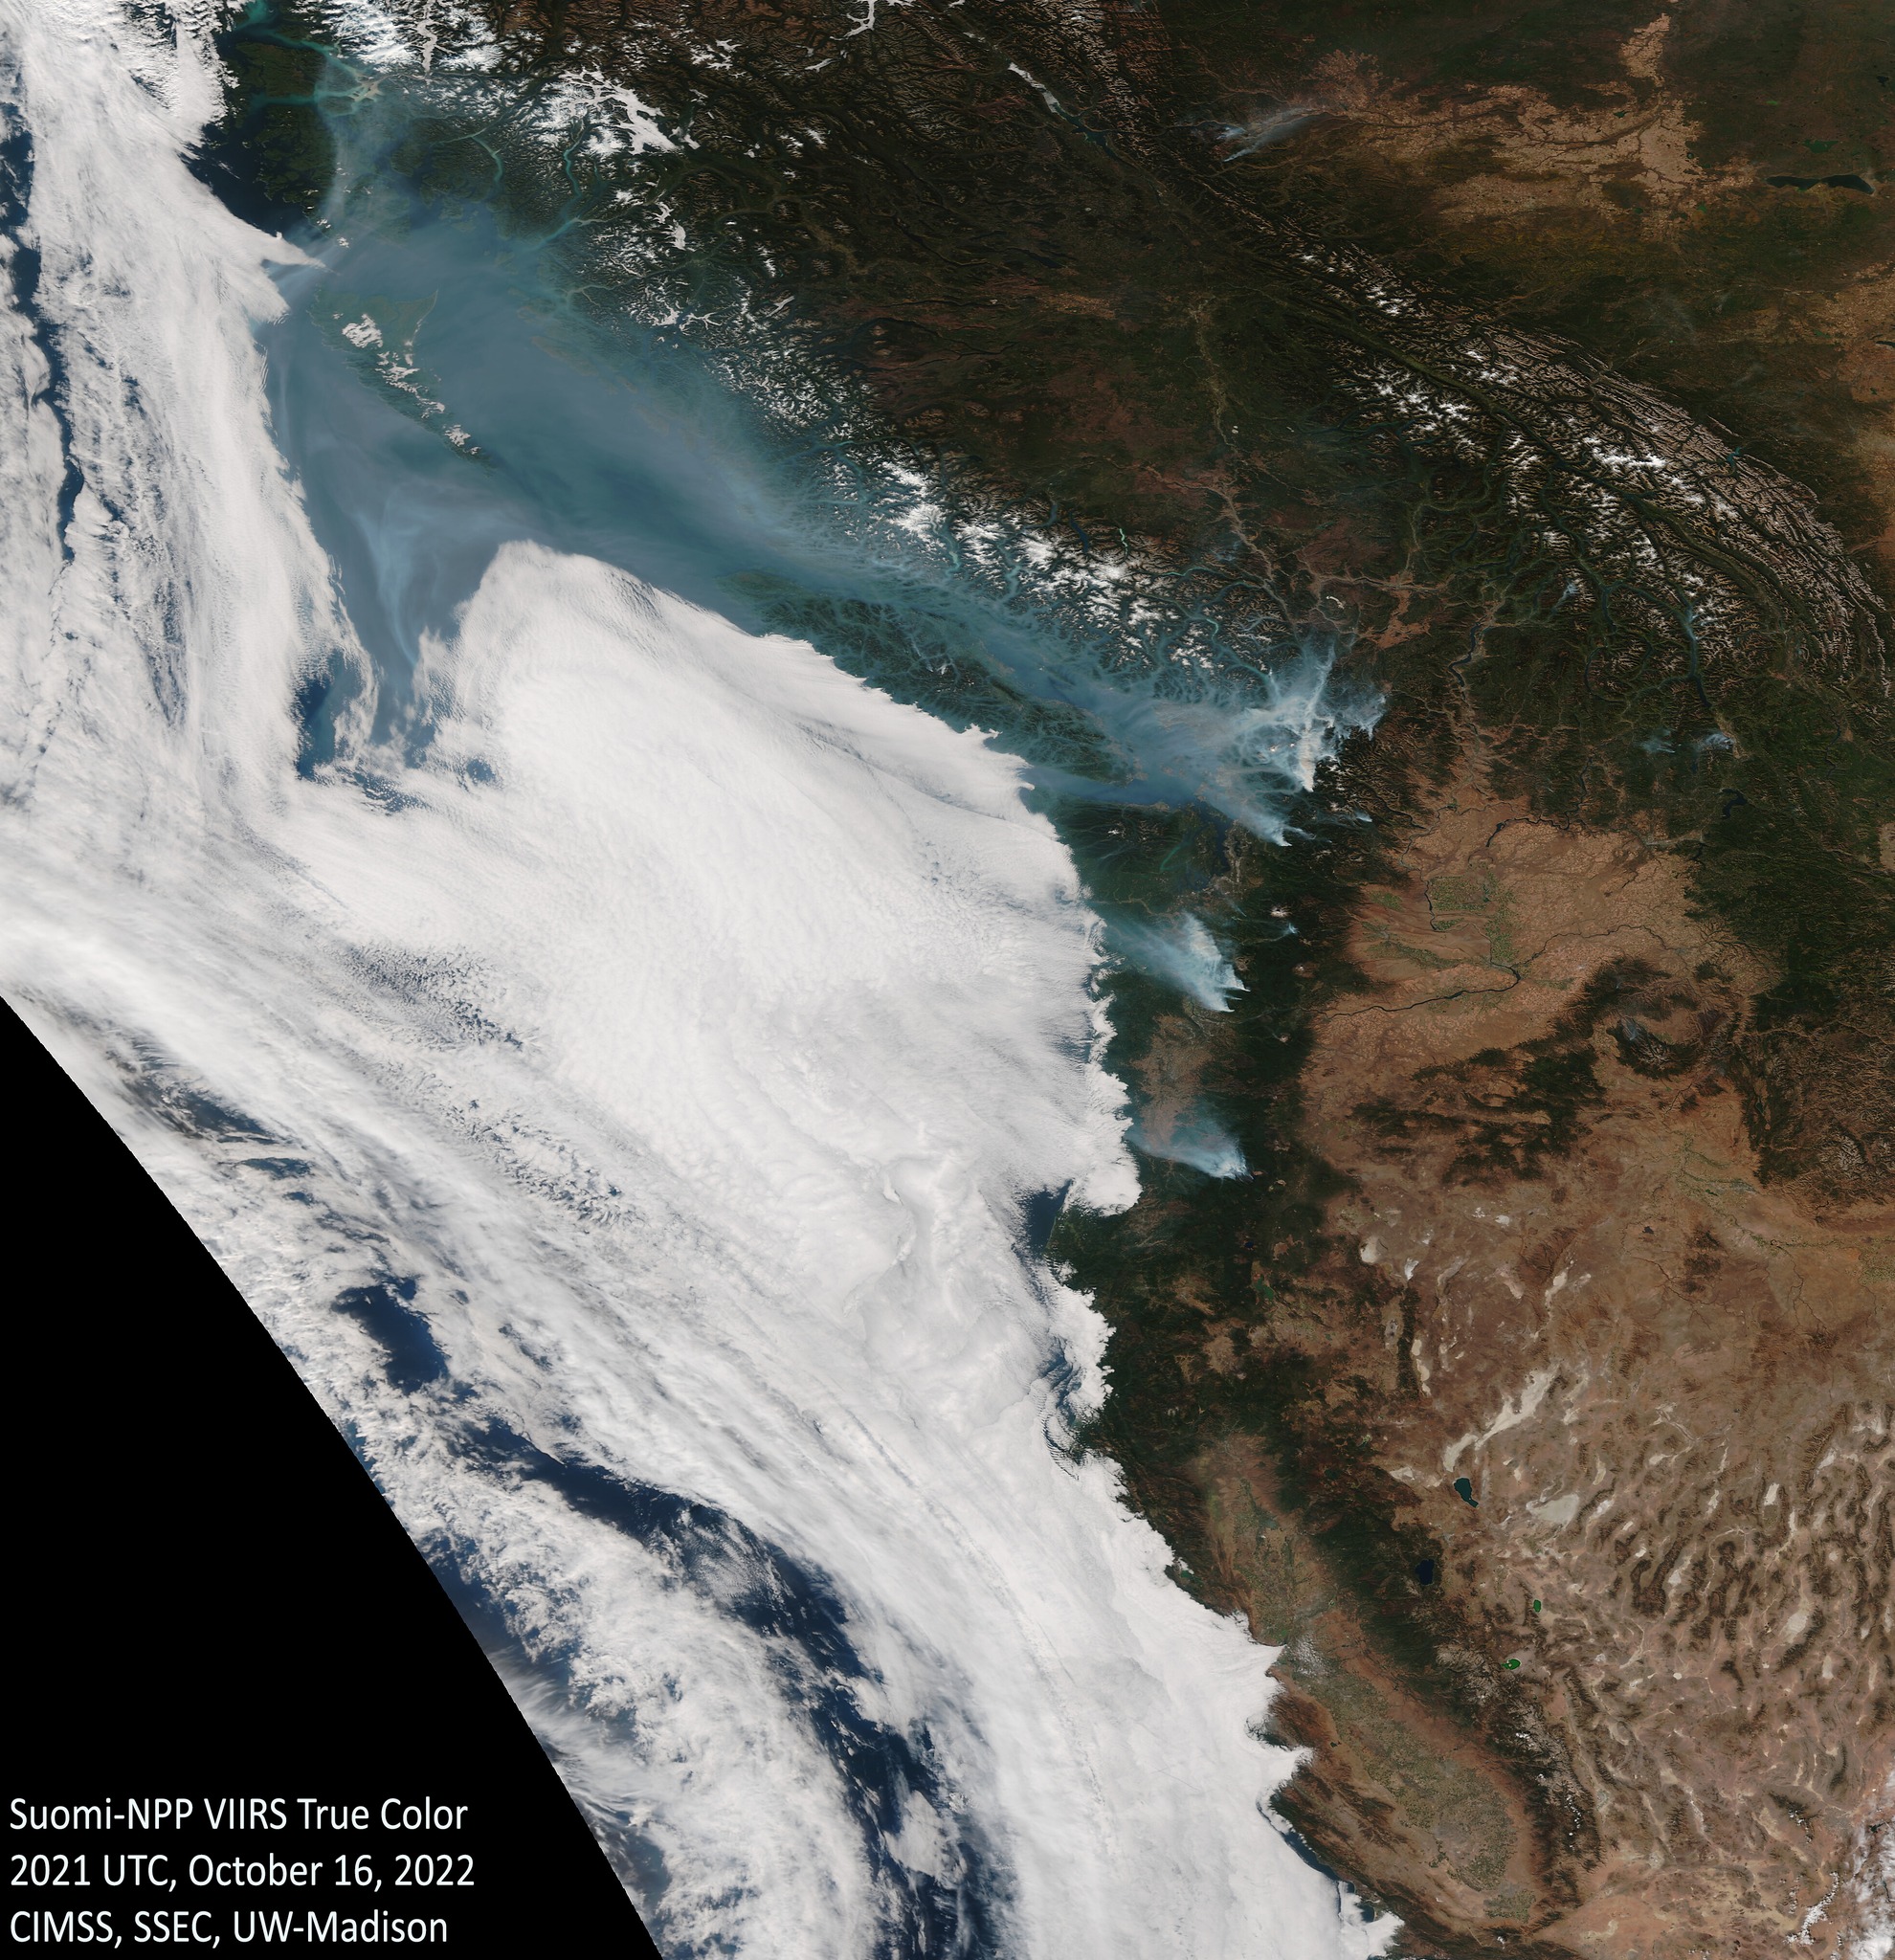
October 2022 – VIIRS True Color captured wildfires in Oregon and Washington on October 16th with smoke flowing north into Canada.
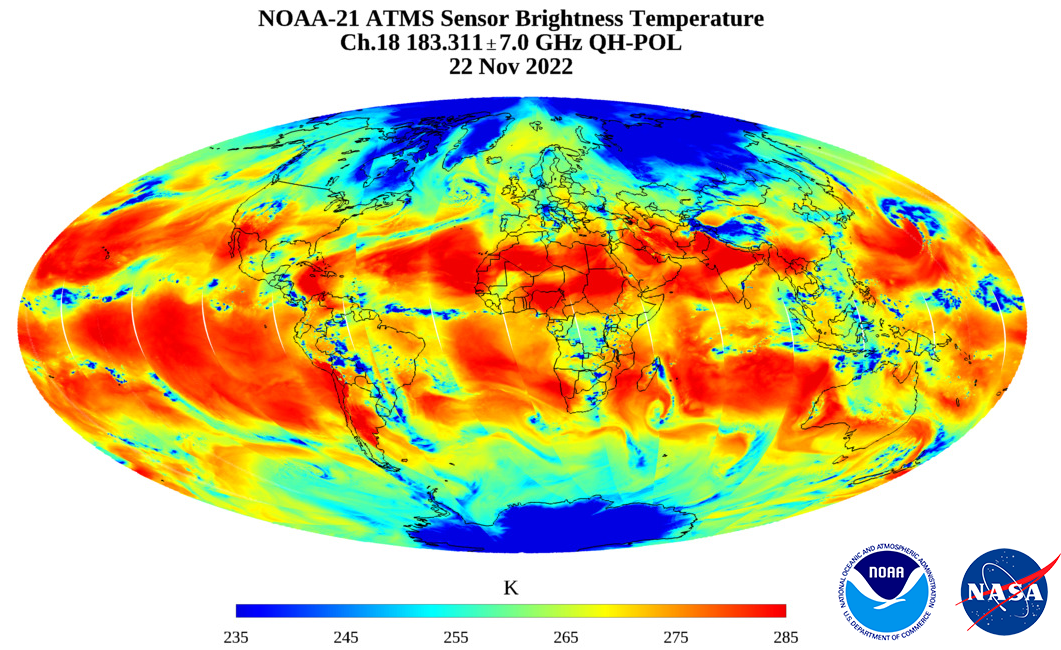
The JPSS-2 satellite launched from from California’s Vandenberg Space Force Base on November 10, 2022, just before 2am Pacific time. Once in orbit it was renamed NOAA-21, the third in a series of advanced polar-orbiting satellites. Data was being received on Earth less than 2 weeks later!
November 2022- First Light global composite from NOAA-21’s ATMS sensor released on November 22.
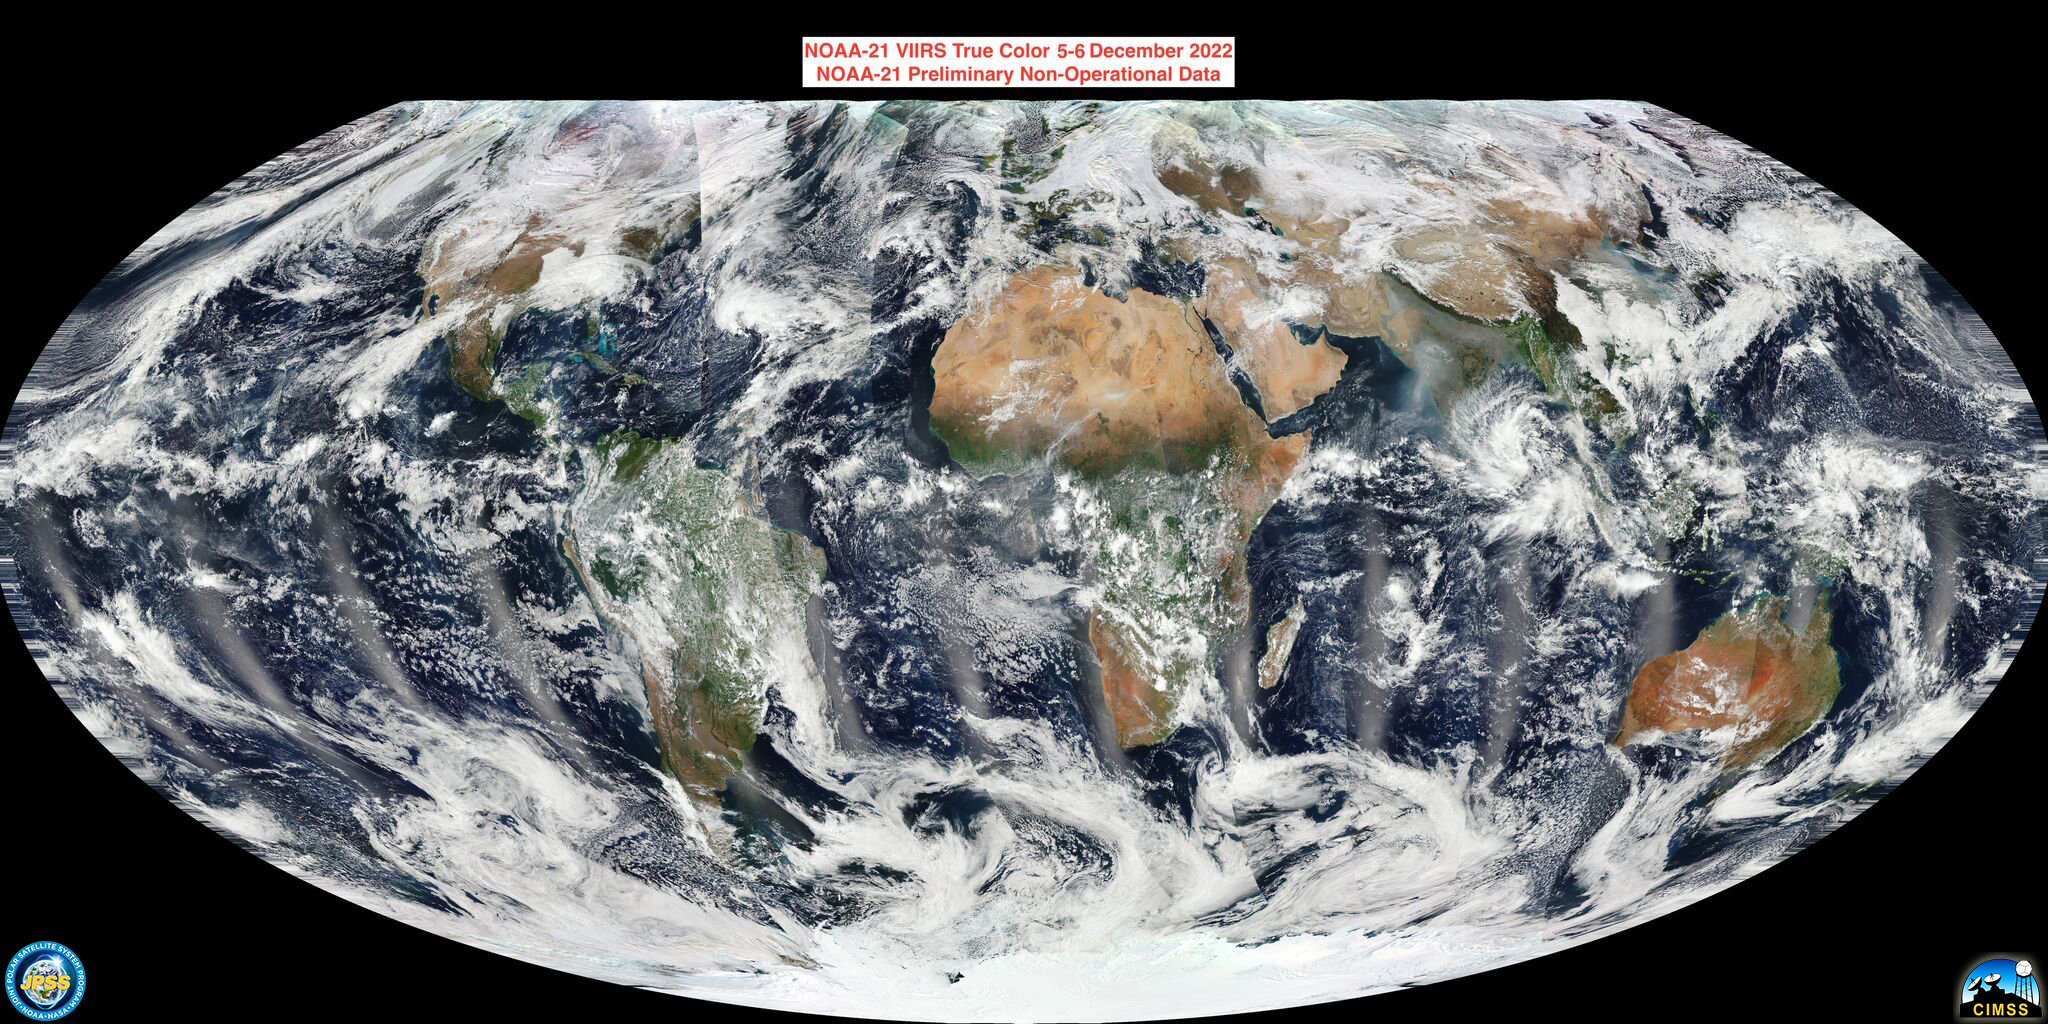
November/December 2022 – First Light VIIRS True Color global composite from NOAA-21 downloaded via CIMSS Direct Broadcast.
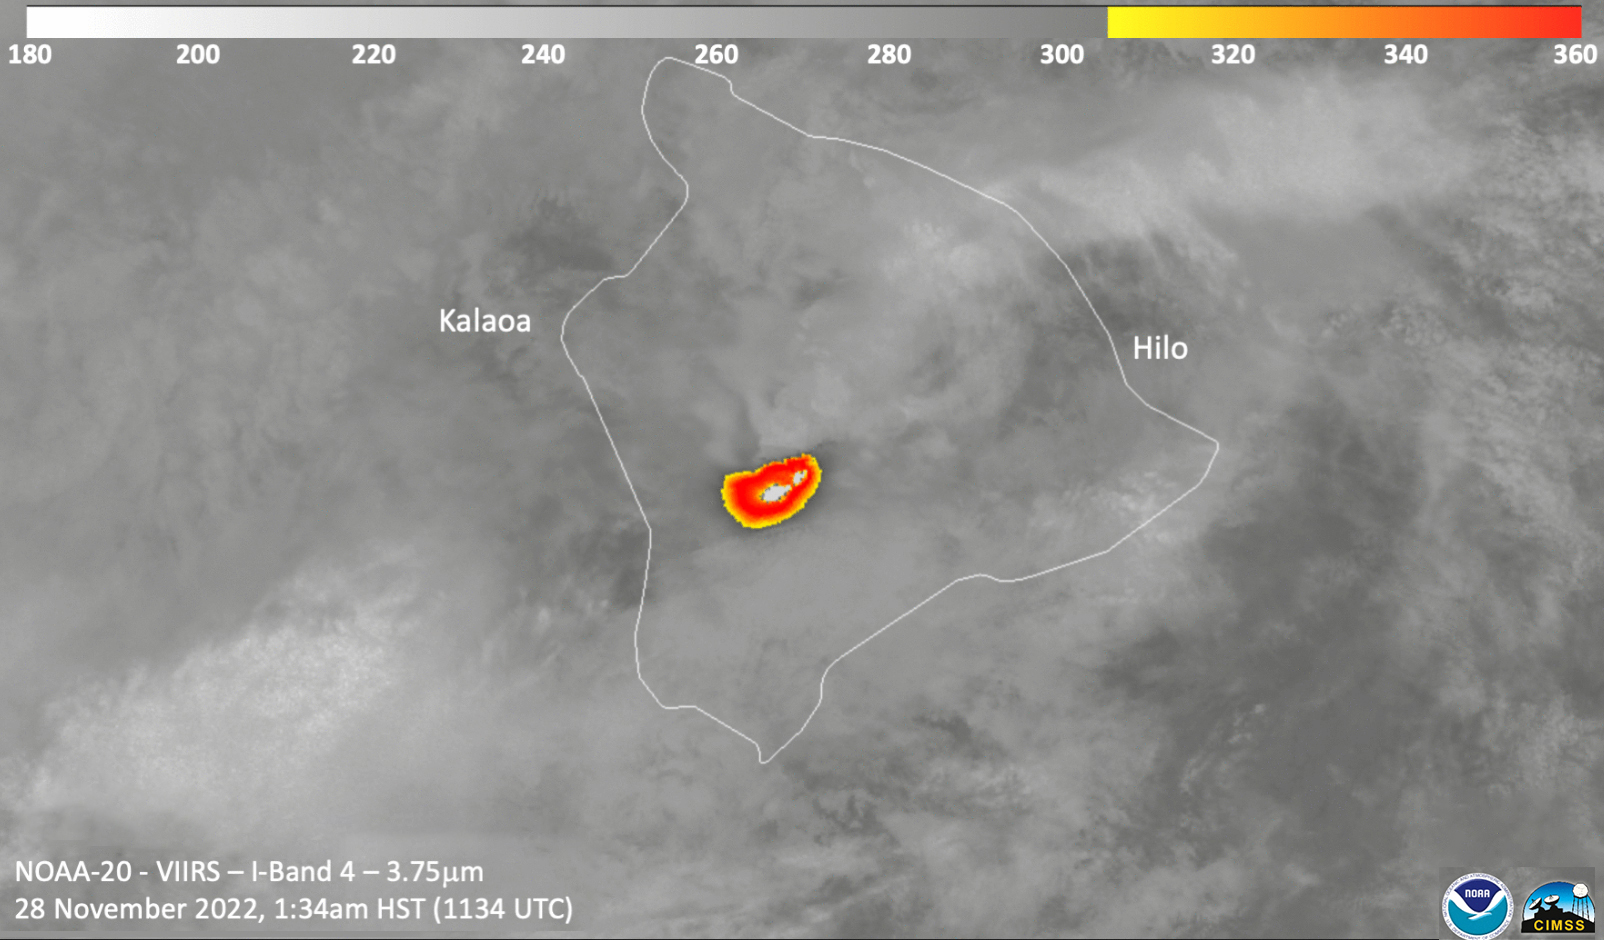
Meanwhile Mauna Loa erupted on the Big Island of Hawaii for the first time in 38 years on November 27th 2022. VIIRS provided regular insights into the extended volcanic event which lasted until December 13th.
November 2022 – NOAA-20 VIIRS IR (3.74 µm) view of the Mauna Loa eruption acquired on November 28th.
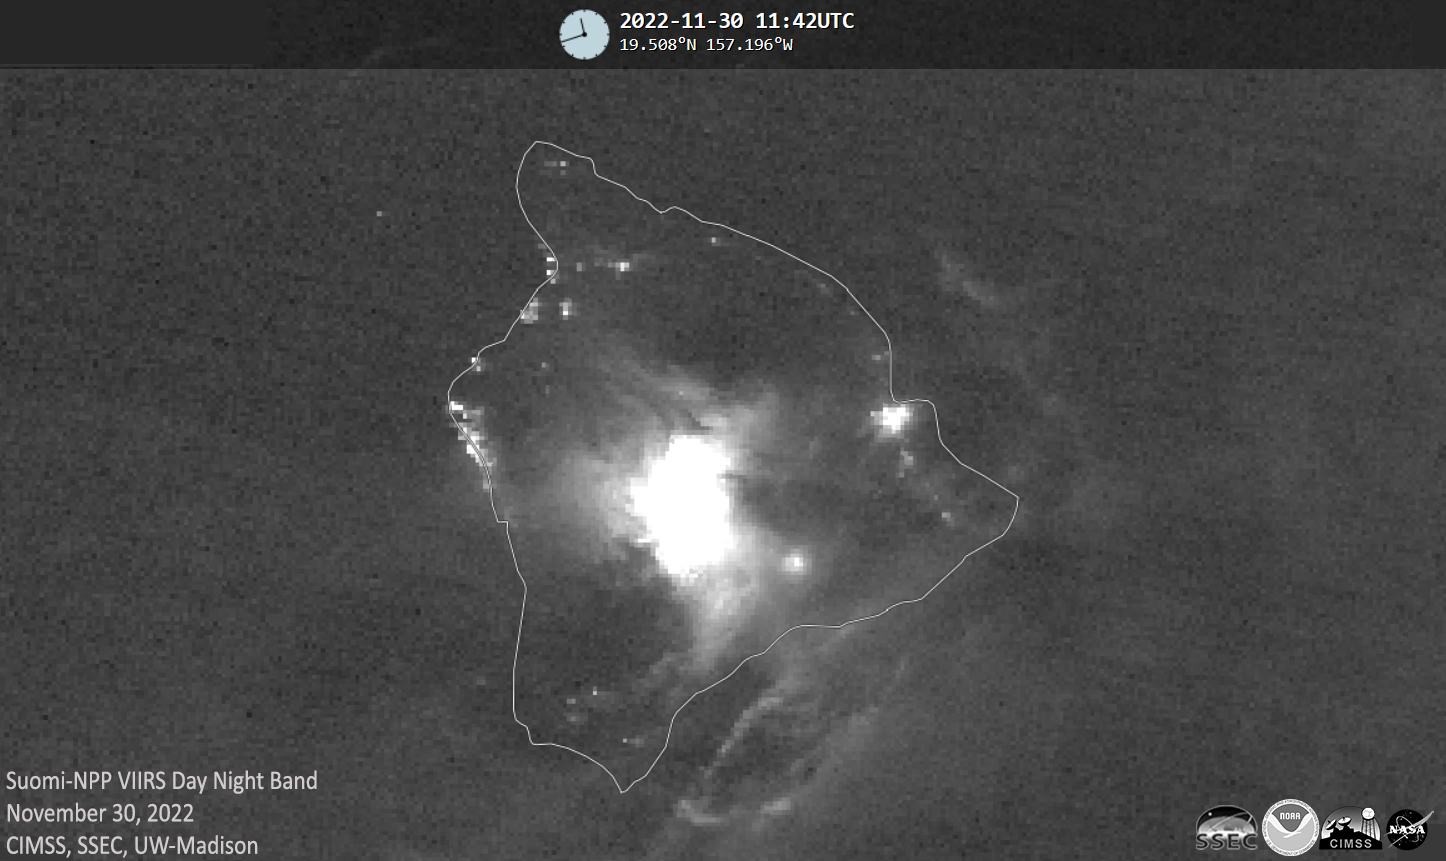
November 2022 – VIIRS Day Night Band depiction of hot lava from Mauna Loa and the smaller glow from Kilauea on November 30th.
December wrapped up the year with an Arctic Blast in the east and an Atmospheric River aimed at the west coast. Polar-orbiting satellites tracked both events.
December 2022 – An Arctic Blast during the holidays depicted by data collected by the CrIS and ATMS instruments.
December 2022 – Historic lake-effect snow associated with the Arctic Blast via VIIRS True and False Color imagery on 12/25.
This collection is merely a sampling of polar-orbiting satellite applications. Tune in to future blog posts and CIMSS social media for additional imagery from the JPSS fleet in 2023, including more NOAA-21 imagery!
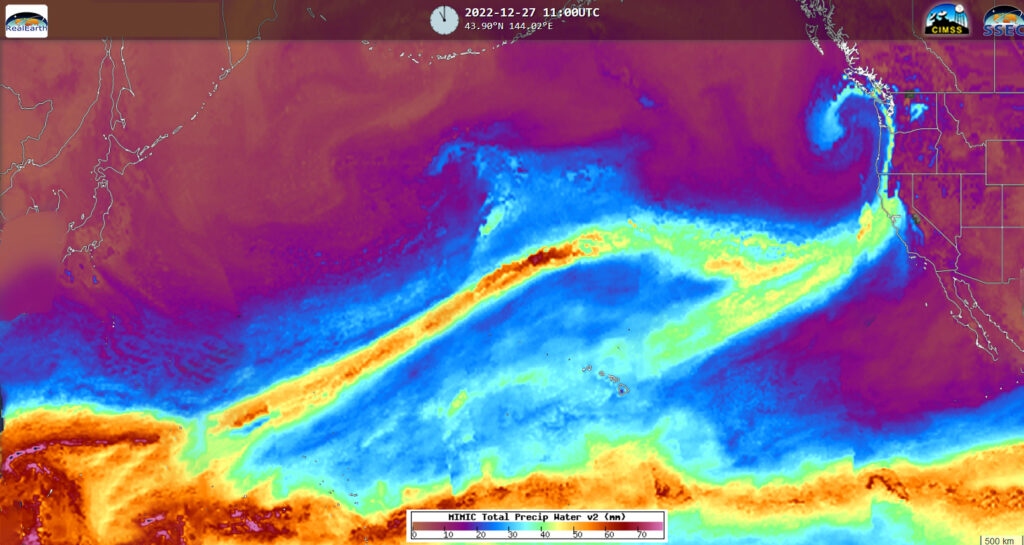
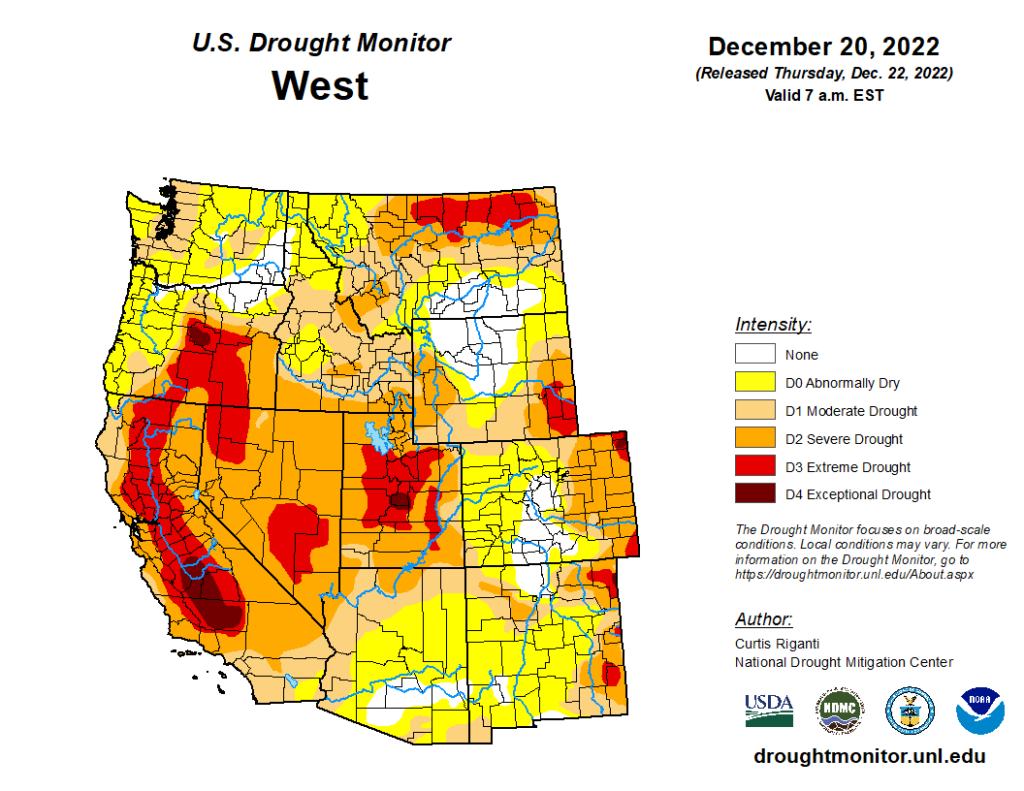
A classic winter weather pattern developed over the Pacific Ocean this week setting the stage for significant drought relief for the western U.S., along with heavy to excessive coastal rains and mountain snow measured in feet for the Sierras and Rockies. Even though this is a “classic” winter pattern, it... Read More
A classic winter weather pattern developed over the Pacific Ocean this week setting the stage for significant drought relief for the western U.S., along with heavy to excessive coastal rains and mountain snow measured in feet for the Sierras and Rockies.
Total Precipitate Water pattern (TPW) from December 27, 2022, click on the image for a 48-hour animation.
GOES West Air Mass RGB view of the trans-Pacific Atmospheric River.
Even though this is a “classic” winter pattern, it hasn’t been prevalent during the past few winters. The absence of this weather feature is part of the reason why much of the western U.S. is experiencing severe to extreme drought.
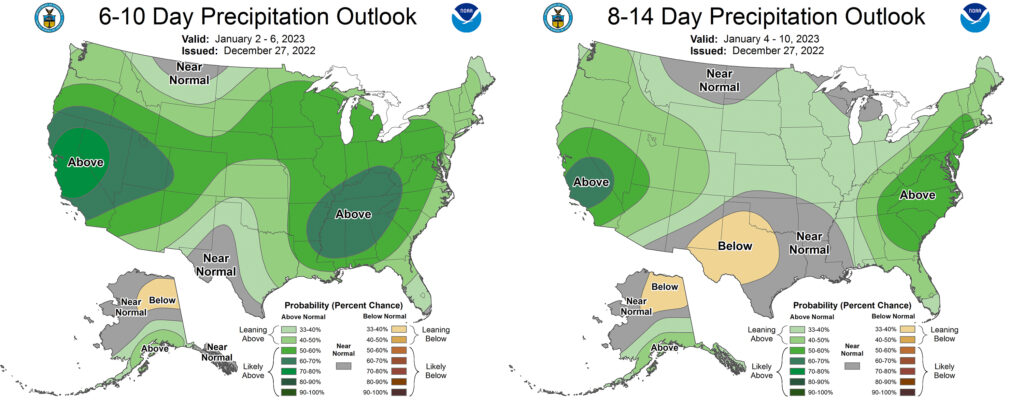
An Atmospheric River pattern is expected to persist into January 2023 with many areas becoming hydrologically sensitive to additional precipitation. Concerns for flooding and/or mudslides are heightened in western locations with burn scars from recent wildfires.
The persistent AR pattern is reflected in NOAA’s CPC Precipitation Outlooks:
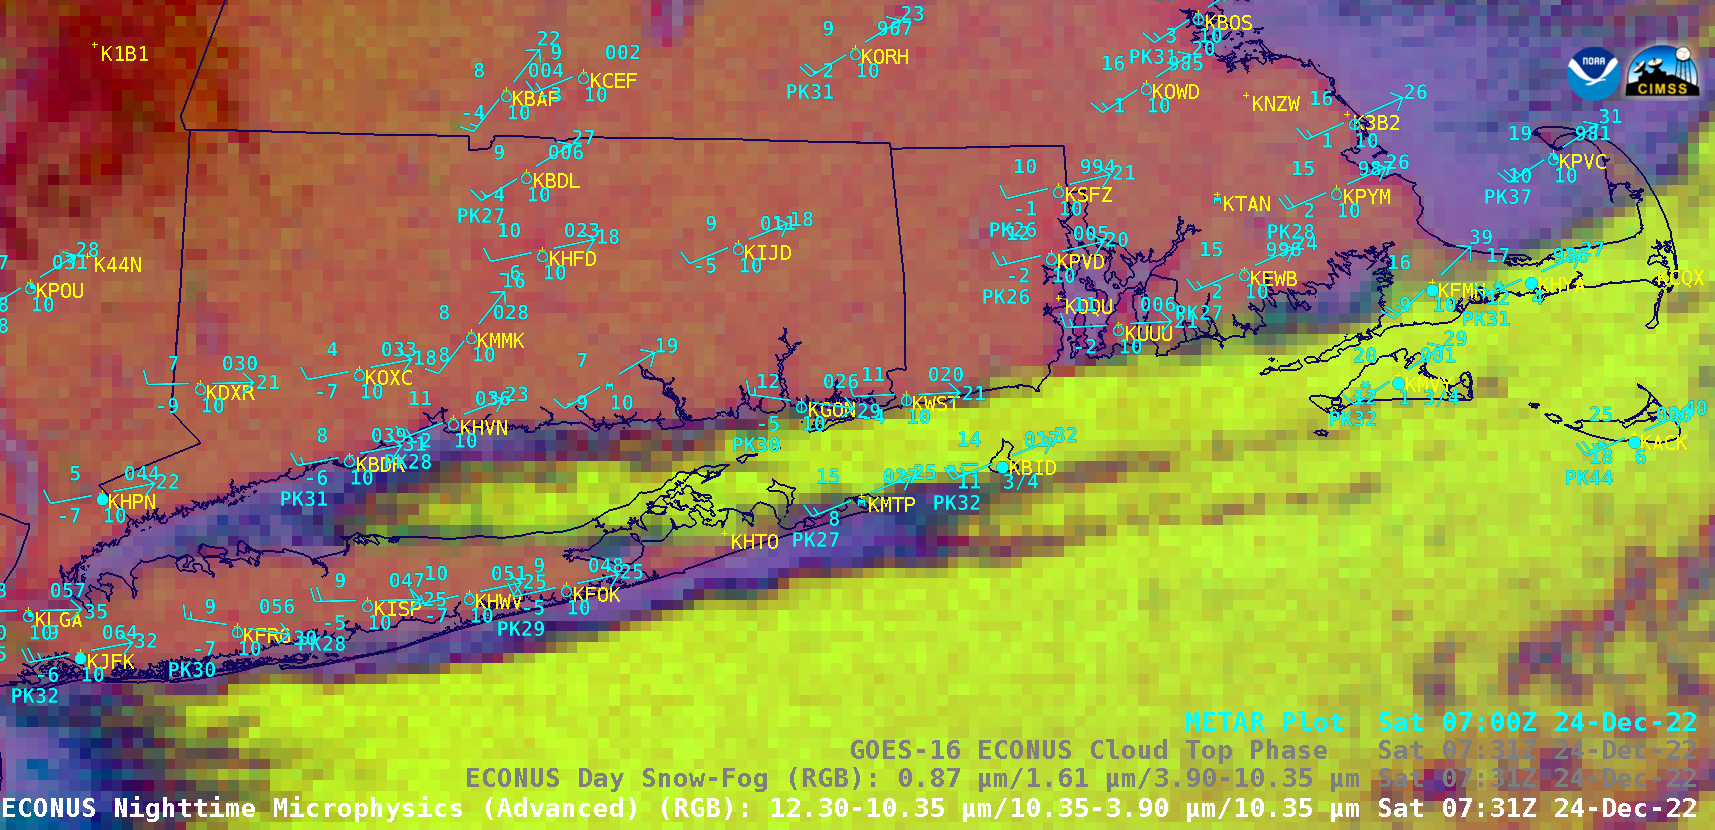
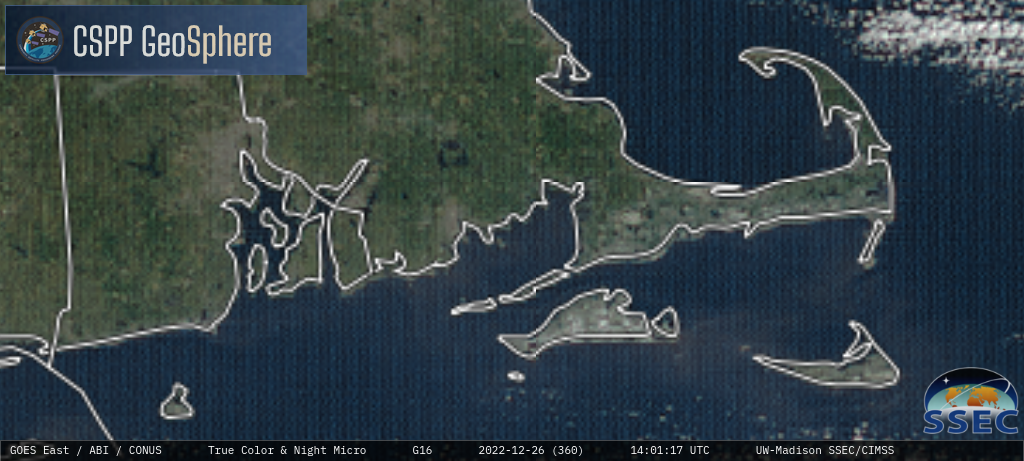
A sequence of GOES-16 (GOES-East) Nighttime Microphysics RGB and Day Snow-Fog RGB images (above) showed plumes of “ocean effect” clouds (including a “sound effect” cloud band, originating over Long Island Sound) that produced periods of snowfall from coastal Connecticut and Rhode Island (as well as Block Island) to Martha’s Vineyard, Nantucket Island and Cape... Read More
GOES-16 Nighttime Microphysics RGB and Day Snow-Fog RGB images [click to play animated GIF | MP4]
A sequence of GOES-16 (GOES-East)Nighttime Microphysics RGB and Day Snow-Fog RGB images (above) showed plumes of “ocean effect” clouds (including a “sound effect” cloud band, originating over Long Island Sound) that produced periods of snowfall from coastal Connecticut and Rhode Island (as well as Block Island) to Martha’s Vineyard, Nantucket Island and Cape Cod in Massachusetts during the 24 December – 25 December 2022 period — with notable snowfall accumulations occurring across Martha’s Vineyard (NWS Public Information Statement | NOHRSC). The northern edge of the sound effect cloud band only passed over coastal Connecticut and Rhode Island briefly, producing moderate snow at Groton CT (KGON) and light snow at Westerly RI (KWST).
As mentioned in Area Forecast Discussions from NWS Boston, this configuration of a significant Long Island Sound effect snow band was rare, with most of their ocean effect snow events occurring with northerly flow.
An extremely rare and significant snow band has been impacting
Marthas Vineyard this morning on very cold west to southwest
flow. Most of the time our ocean effect snow events are dealing
with northerly flow with a shallow inversion layer and often a
limited fetch. This results in very minor snow accumulations in
most cases. In this situation...rare arctic air invaded the
region on a 240/250 degree wind. The soundings indicate a rather
deep mixed layer up to the inversion at 4-5 thousand feet with
uniform WSW winds. Large temp differentials from the top of the
mixed layer to the SST were on the order of 22C/23C.
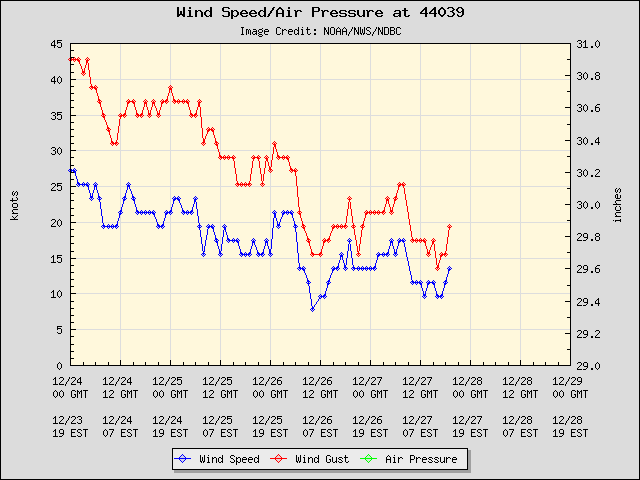
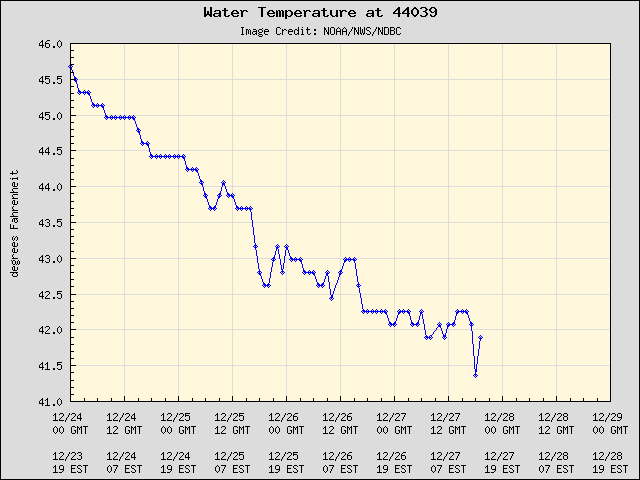
A comparison of GOES-16 Nighttime Microphysics RGB, Cloud Top Phase and Cloud Top Height images at 0001 UTC on 24 December (below) showed that the Long Island Sound effect cloud band’s top was composed of supercooled water droplets, with cloud top height values in the 5000-7000 feet range. As this cloud band was passing over Central Long Island Sound Buoy 44039 during the 24-25 December period, strong surface winds caused an upwelling of cooler sub-surface water which reduced sea surface temperatures about 3ºF.
GOES-16 Nighttime Microphysics RGB, Cloud Top Phase and Cloud Top Height images at 0001 UTC on 24 December [click to enlarge]
On 26 December, GOES-16 True Color RGB images from the CSPP GeoSphere site (below) revealed the whiter shades of snow cover across Martha’s Vineyard, Nantucket Island and southern portions of Cape Cod — with the lesser snow depths across Nantucket Island and Cape Cod beginning to melt more quickly compared to the deeper snow cover across Martha’s Vineyard.
GOES-16 True Color RGB images [click to play MP4 animation]
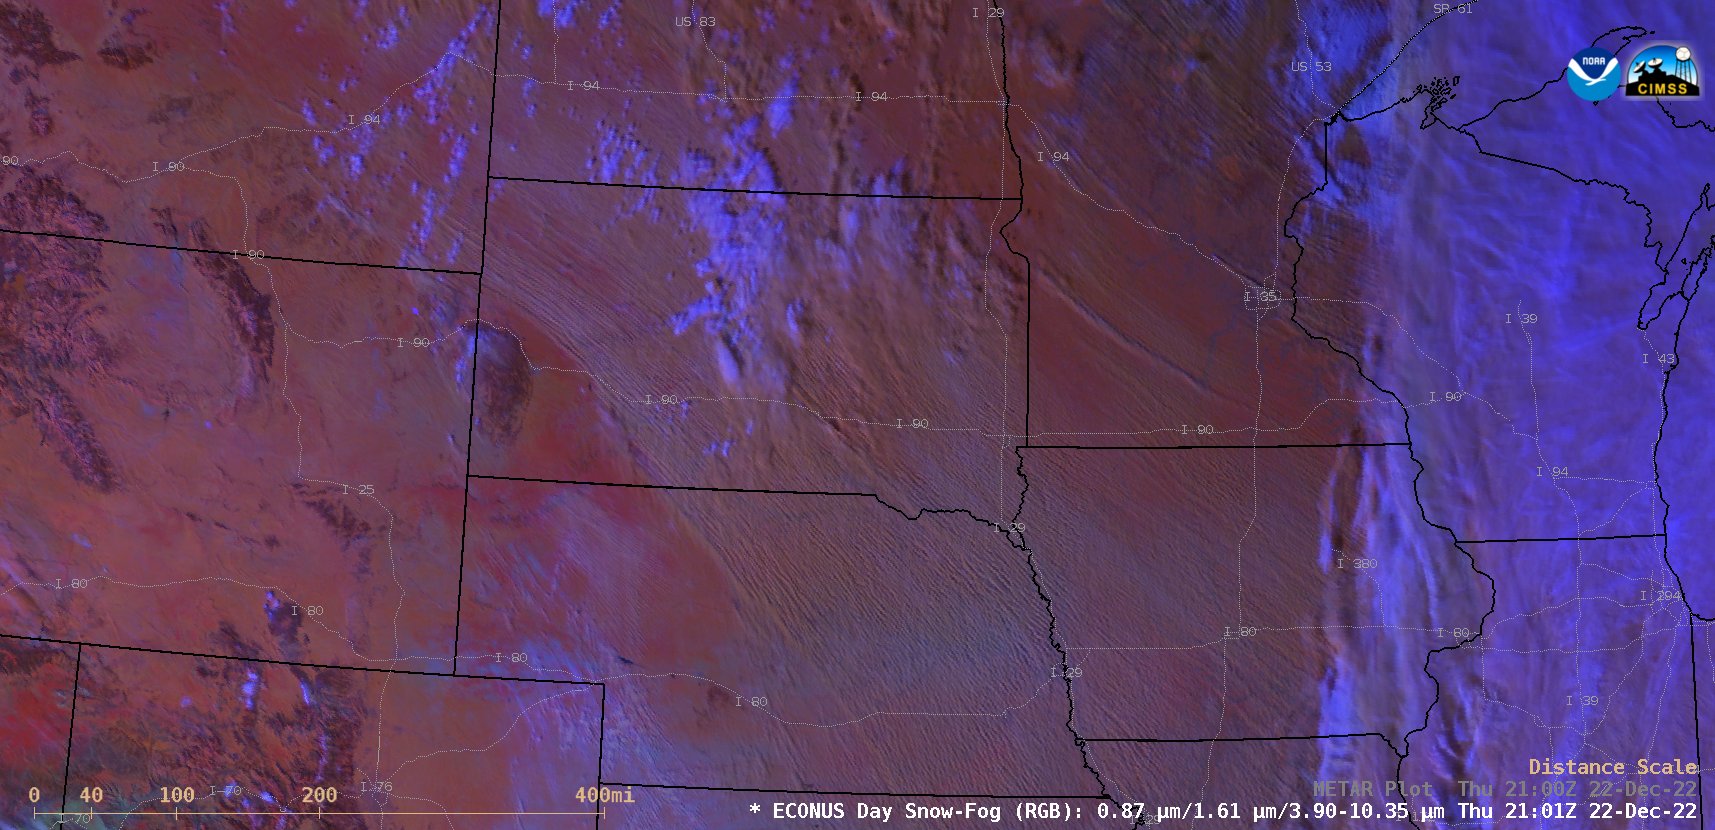
GOES-16 (GOES-East) Day Snow-Fog RGB images (above) showed widespread horizontal convective rolls (HCRs) that were streaming southeastward across much of the north-central US — in the wake of a strong arctic cold front — on 22 December 2022. This HCR signature is often accompanied by significant blowing snow; in fact, many Interstate highways were... Read More
GOES-16 Day Snow-Fog RGB images, with and without plots of hourly surface reports [click to play animated GIF | MP4]
GOES-16 (GOES-East)Day Snow-Fog RGB images (above) showed widespread horizontal convective rolls (HCRs) that were streaming southeastward across much of the north-central US — in the wake of a strong arctic cold front — on 22 December 2022. This HCR signature is often accompanied by significant blowing snow; in fact, many Interstate highways were closed on this day in portions of North Dakota, South Dakota and Iowa. Wind gusts as high as 60 mph were recorded in South Dakota.
On 23 December, GOES-16 Day Snow-Fog RGB images (below) displayed a long but narrow plume of HCRs that originated over the southern end of Lake Manitoba — which crossed the US/Canada border and streamed across far northeastern North Dakota and northwestern Minnesota. Surface visibility was reduced to 1/4 mile at some sites in Minnesota where the HCR signature was observed; wind gusts as high as 52 mph were reported across that area.
GOES-16 Day Snow-Fog RGB images, with and without plots of hourly surface reports [click to play animated GIF | MP4]
These blowing snow events occurred during a significant and widespread outbreak of arctic air across much of the Lower 48 states during the 21 December – 23 December period, as an anomalously-deep mid-tropospheric trough descended southward and southeastward from Canada — GOES-16 Air Mass RGB images (below) displayed the beige to pale orange hues that are normally associated with such arctic outbreaks (for example, in January 2019). On the morning of 22 December, two locations in western Montana reported low temperatures of –50ºF (the first occurrence of -50ºF in the Lower 48 states during the 2022-2023 winter season).
GOES-16 Air Mass RGB images [click to play animated GIF | MP4]
Additional details and imagery of this arctic outbreak and associated episodes of blowing snow can be found on the Satellite Liaison Blog.


