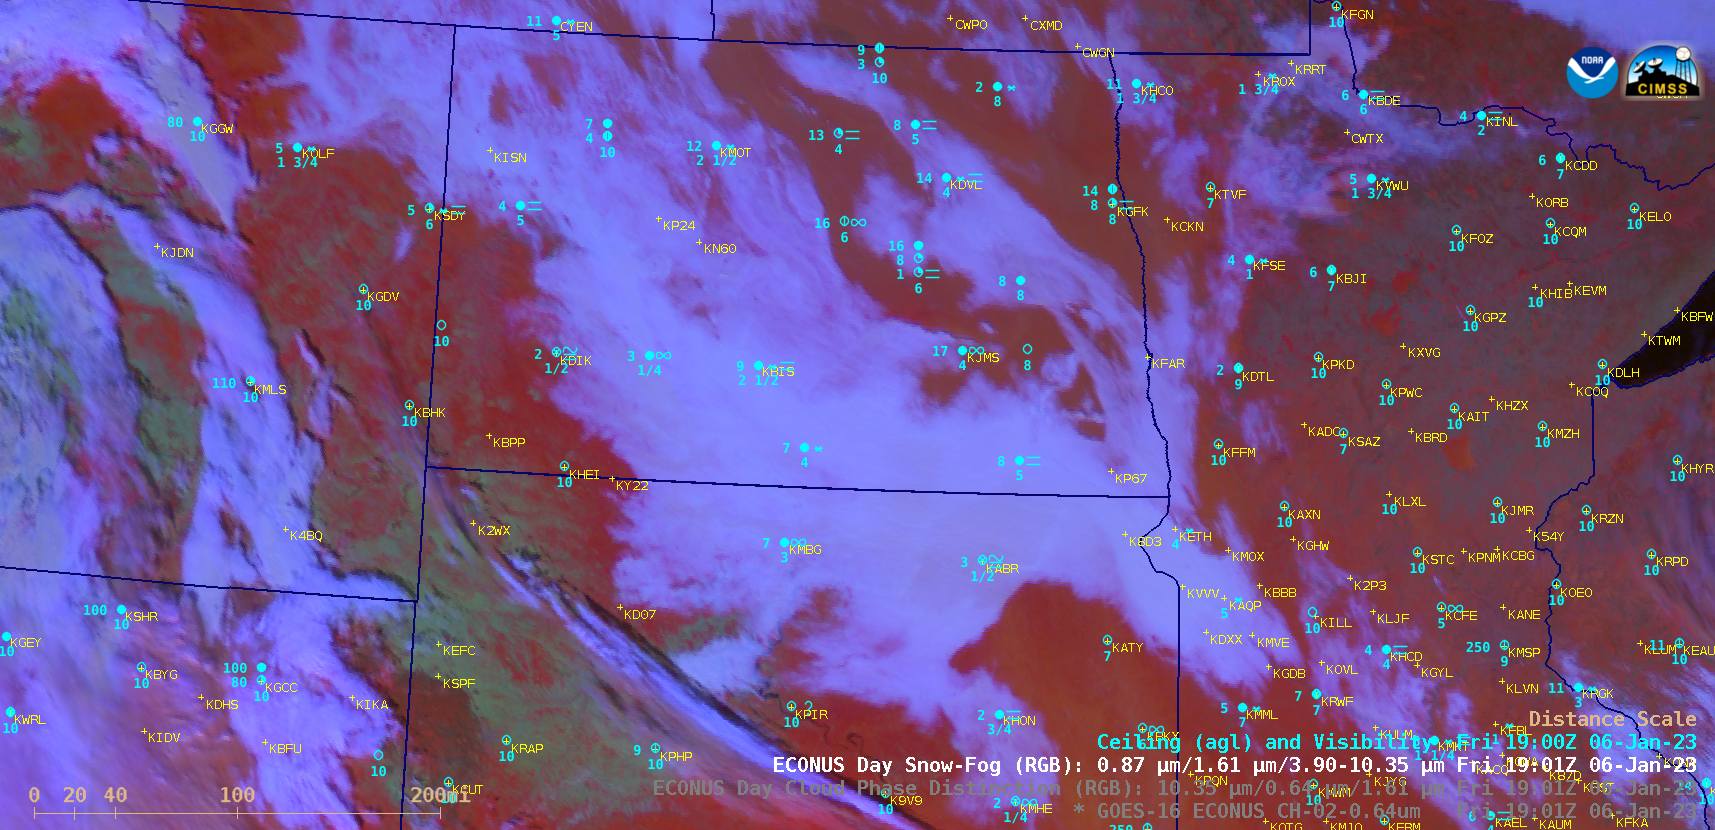
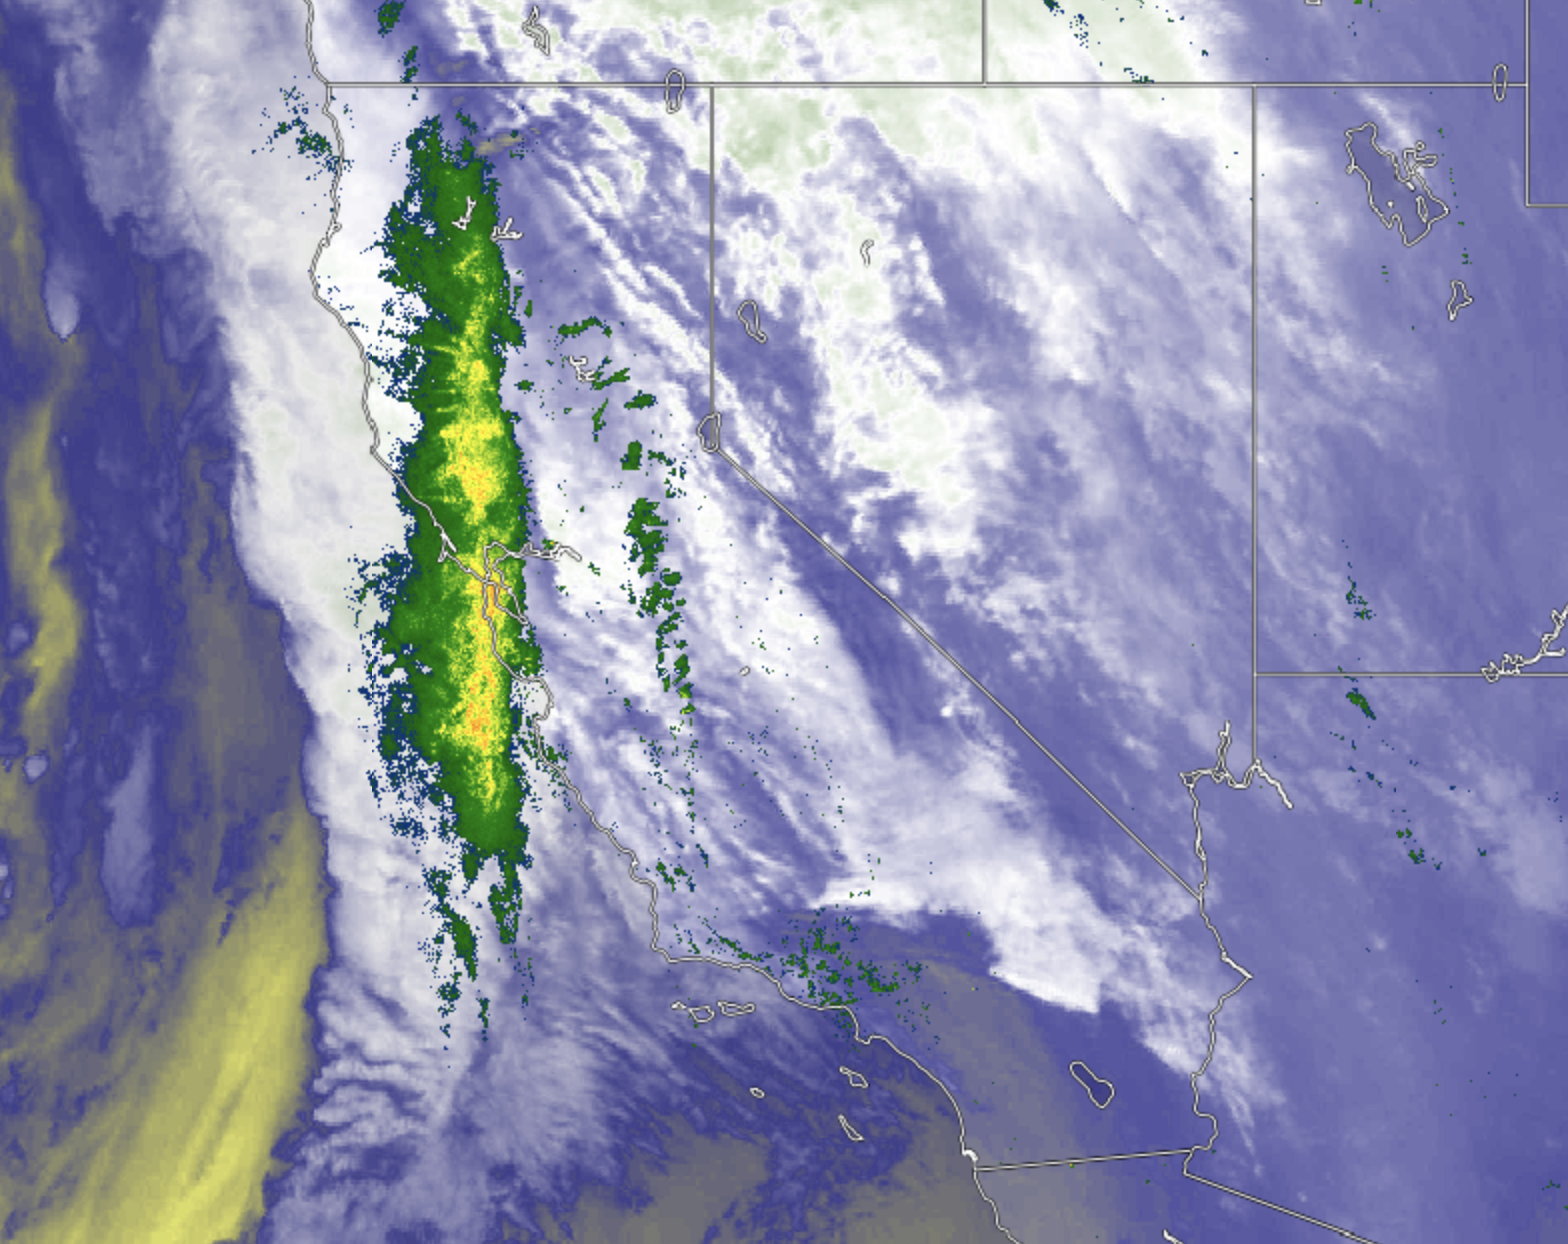
A sequence of GOES-16 (GOES-East) “Red” Visible (0.64 µm), Day Cloud Phase Distinction RGB and Day Snow-Fog RGB images (above) showed widespread fog/stratus across parts of Montana, North/South Dakota and Minnesota during the day on 06 January 2023. With a quasi-stationary area of high pressure located over that area (surface analyses), winds remained light and the fog/stratus layer was slow... Read More

GOES-16 “Red” Visible (0.64 µm), Day Cloud Phase Distinction RGB and Day Snow-Fog RGB images (with and without hourly observations of Ceiling / Visibility / Surface Weather, plotted in cyan) [click to play MP4 animation | animated GIF]
A sequence of GOES-16
(GOES-East) “Red” Visible (
0.64 µm),
Day Cloud Phase Distinction RGB and
Day Snow-Fog RGB images
(above) showed widespread fog/stratus across parts of Montana, North/South Dakota and Minnesota during the day on
06 January 2023. With a quasi-stationary area of high pressure located over that area (
surface analyses), winds remained light and the fog/stratus layer was slow to dissipate over much of the region (where snow cover was generally in the
10-20 inch range). The surface visibility was near zero at some sites, with scattered reports of freezing fog and/or light snow.
Plots of rawinsonde data from Bismarck ND (KBIS) and Aberdeen SD (KABR) are shown below — both sites indicated that a strong and moist boundary layer temperature inversion remained in place during the day, which also helped the fog/stratus layer to persist or dissipate rather slowly. Judging from the pressure level of sharp dew point decreases, these fog/stratus features were confined to altitudes of 1200-1400 meters (3900-5000 feet) or lower.
Plots of rawinsonde data from Bismarck, North Dakota [click to enlarge]
Plots of rawinsonde data from Aberdeen, South Dakota [click to enlarge]
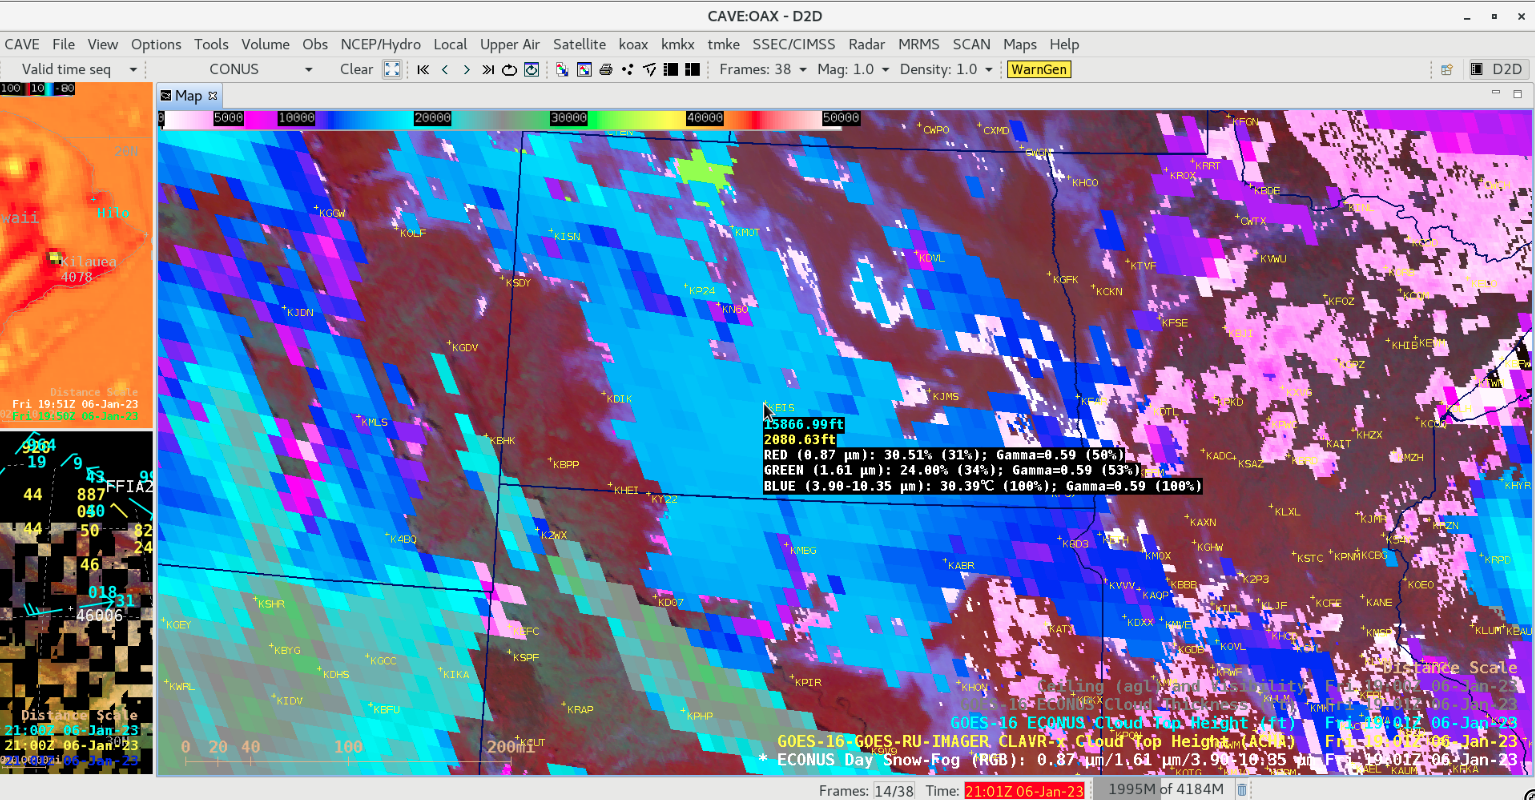
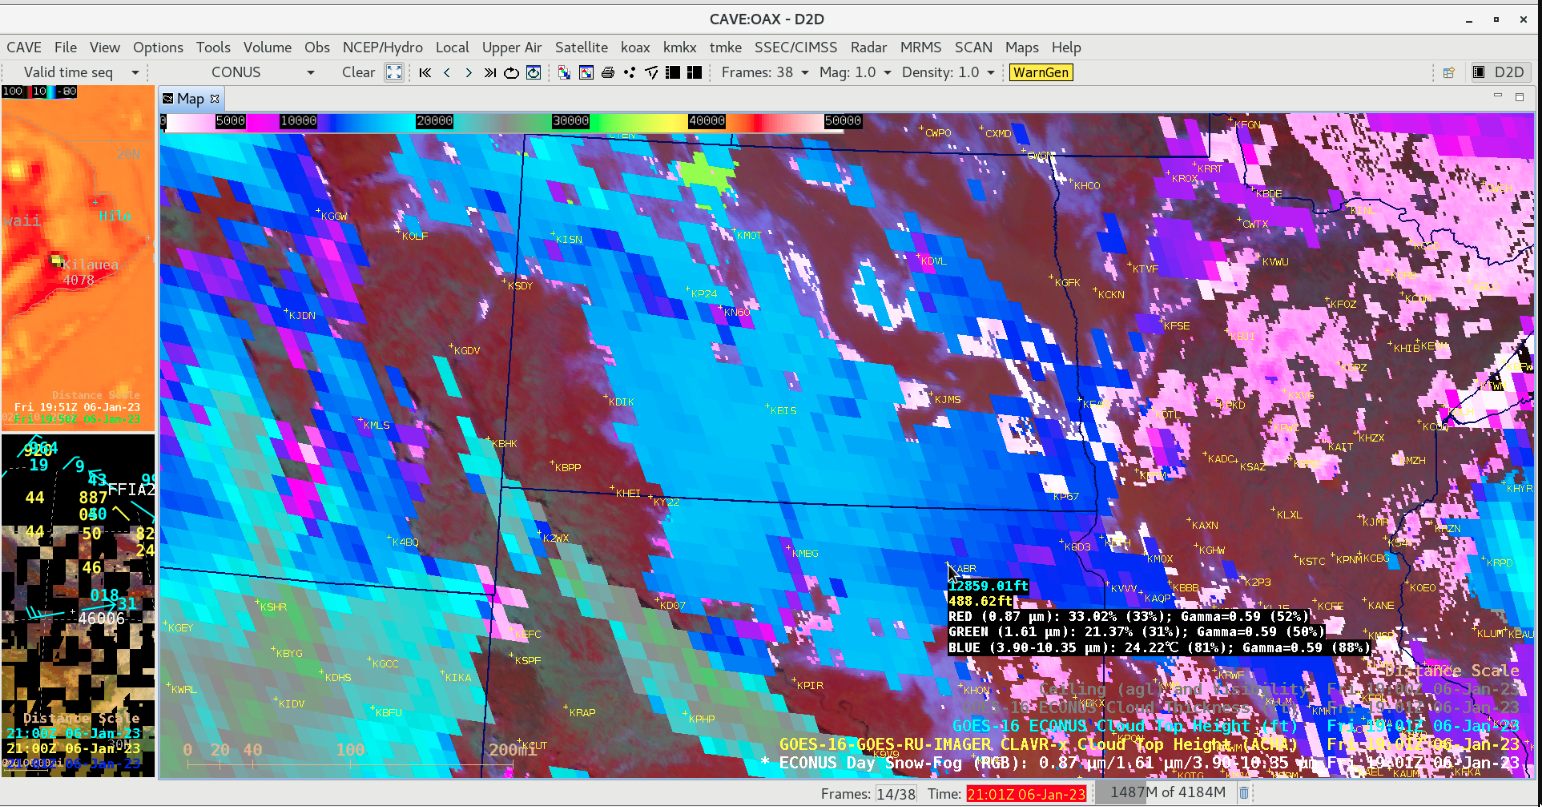
GOES-16 Day Snow-Fog RGB images at 1901 UTC, with an overlay of the corresponding CLAVRx and Operational versions of the Cloud Top Height derived product; cursor-sampled Cloud Top Height values at Bismarck ND are shown [click to enlarge]
GOES-16 Day Snow-Fog RGB images at 1901 UTC — with an overlay of the corresponding
CLAVR-x and Operational versions of the
Cloud Top Height (CTH) derived product — include cursor-sampled those two Cloud Top Height values at Bismarck ND
(above) and Aberdeen SD
(below). It would appear that the 10-km resolution Operational CTH values were unrealistically high — which can often occur over areas with snow cover — compared to the 2-km resolution CLAVR-x CTH values (the full-resolution CLAVR-x products are produced at CIMSS).
GOES-16 Day Snow-Fog RGB image at 1901 UTC, with an overlay of the corresponding CLAVRx and Operational versions of the Cloud Top Height derived product; cursor-sampled Cloud Top Height values at Aberdeen SD are shown [click to enlarge]
A comparison of GOES-16 Day Snow-Fog RGB image, CLAVRx Cloud Top Height and Operational Cloud Top Height derived products at 1901 UTC is shown below.
GOES-16 Day Snow-Fog RGB, CLAVRx Cloud Top Height and Operational Cloud Top Height at 1901 UTC [click to enlarge]
View only this post
Read Less


